Geochemical Characteristics of Heavy Metals Concentration in Sediments of Quiberon Bay Waters, South Brittany, France
M. C. Ong1 , D. Menier2,3, N. A. M. Shazili1 and B. Y. Kamaruzzaman4 *
1Department of Marine Science, Faculty of Maritime Studies and Marine Science, University Malaysia Terengganu, 21030 Kuala Terengganu, Terengganu, Malaysia. 2Géosciences Marines etGéomorphologie du Littoral, UMR 6538 Domain Océaniques, Centre de Recherche Yves Coppens,Université de Bretagne–Sud, 56017 Vannes, France. 3Department of Petroleum Geoscience, Faculty of Geoscience and Petroleum Engineering, UniversitiTeknologi PETRONAS, Bandar Seri Iskandar, 31750 Tronoh, Perak, Malaysia. 4Institute of Oceanography and Maritime Studies,International Islamic University Malaysia, 25200 Kuantan, Pahang, Malaysia.
Cr, Co, Cu, Zn, Cd and Pb in the bottom sediments from 93 sites at Quiberon bay were analyzed by Inductively Coupled Plasma Mass Spectrometry (ICPMS) after acid extraction. The ranges of the concentration in the sediments are as follows: 27.3 µg/g (Cr), 11.6 µg/g (Co), 13.8 µg/g (Cu), 42.0 µg/g (Zn), 0.08 µg/g (Cd) and 17.8 µg/g (Pb). Potential contamination of the bay was assessed by Igeo and pollution load index whether the concentration observed represent background or contaminated levels. Based on the results, it can be concluded that the bay is unpolluted for the studied metals.
KEYWORDS:Quiberon bay; ICPMS; Igeo; Pollution load index
Download this article as:| Copy the following to cite this article: Ong M. C, Menier D, Shazili N. A. M, Kamaruzzaman B. Y. Geochemical Characteristics of Heavy Metals Concentration in Sediments of Quiberon Bay Waters, South Brittany, France. Orient J Chem 2013;29(1). |
| Copy the following to cite this URL: Ong M. C, Menier D, Shazili N. A. M, Kamaruzzaman B. Y. Geochemical Characteristics of Heavy Metals Concentration in Sediments of Quiberon Bay Waters, South Brittany, France. Available from: http://www.orientjchem.org/?p=11941 |
Introduction
Marine sediments, including materials originating from the terrestrial and land inputs, as well as atmospheric deposition and autogenetic matter from ocean itself, preserve a continuous record of regional and global environmental changes, which can be employed in reconstructing environmental evolution (Wan et al. 2003; Dai et al. 2007). To some extent, sediment is the mirror of any sedimentary environmental changes, which can reflect the biological and geochemical process of former conditions. On the other side, environmental changes are not only driven by natural forces, but also by anthropogenic effects (Kalis et al. 2003). Especially in recent years, the anthropogenic impacts on the environment have been leading to eutrophication in coastal zone and offshore and the interaction of the natural force and human activities have exerted great effects on the whole environmental system (Cobelo–Garcia and Prego 2003; Meng et al. 2008).
In this work, Cr, Co, Cu, Zn, Cd and Pb total concentrations have been determined in bulk sediment of 93 surface sediments from Quiberon Bay, in order to increase the knowledge on metal levels in this area, which is not been studied very much. Geo–accumulation index and pollution load index has been calculated to assess sediments contamination and establish if metals concentrations represent background levels for the Northwest France (Loska et al. 1997; Ruiz 2001). Moreover, analytical results have been elaborated by using Geographical Information System (GIS) ArcGIS 9 software, to show metals’ accumulation areas. Multivariate statistical analysis has been used to evaluate the possibility to distinguish sampling stations, in relation to their geographical location (Guillen et al. 2004; Buccolieri et al. 2006). The aim of this paper is to describe the distribution of heavy metals, to provide preliminary data on the environmental conditions, and to evaluate the risks from metal contamination, the impact of the human activities and the mariculture areas, in this area compared with other bay in this region.
Materials and Methods
Description of sampling sites
Quiberon Bay is a large well–sheltered expanse of open sea at the south coast of Brittany and made up of two complementary areas with an equivalent surface area, approximately 120 km² (Figure 2). The bay is roughly triangular in shape, almost completely surrounded by land on the north and east sides, open to the south with the Gulf of Morbihan to north–east and the narrow peninsular of Presqu’île de Quiberon of providing protection from the Atlantic Ocean to the west (Chaumillon et al. 2008). The Belle Island, Houat Island and Hœdic Island add to the bay’s protection (Guillaud et al. 2008).
Sample collection
This oceanographic fieldwork was accomplished with the vessel from Regional Committee of Conchyliculture (CRC), South Brittany. A total of 93 sediment samples were collected randomly in Quiberon Bay with Orange Peel Grab. Sediment samples were collected from the top 3–5 cm of the surface at each sampling point. During sampling, precautions were taken to minimize any disturbance in the grain–size distribution of the original sediment. Samples were taken only when the grab was firmly closed on arrival on the boat deck, so as to avoid any leaks of fine material withdrawn by water. In addition, to avoid metal contamination from the grab’s wall, the outermost layer of the sediment sample was removed and only the inner part was kept. After collection the samples were placed in plastic containers and kept at 4oC until analysis.
Reagents and calibration
The reagents used were all of analytical reagent grade certified for high purity. Ultrapure water (water resistivity > 18.2MΩ at 25°C) was produced with a Mili–Q Integral Water Purification System. High purity concentrated HNO3, HCl and HF (Merck) were used in aqua regent digestion. Calibration was done using external and internal standards. The external standard was prepared by diluting the ICP multi–element standard solution VI for ICP–MS CentiPUR® with the same acid mixture used for sample digestion. A mixture of scandium (Sc), indium (In) and bismuth (Bi) was used as an internal standard. All glass and plastic wares were cleaned by soaking overnight in 5% HNO3 and were then rinsed with Mili–Q water.
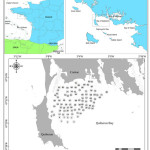 |
Figure 1: Surface sediment sampling locations in Quiberon Bay, Brittany, France. Click here to View figure |
Analytical procedures
The sediment samples were digested and the analyses for total heavy metals carried out following published methodologies with some modifications (Ong and Kamaruzzaman 2009; Kamaruzzaman et al. 2008). An inductively coupled plasma mass spectrometer (Perkin Elmer Elan 6000) was used for the quick and precise determination of Cr, Co, Cu, Zn, Cd and Pb in the digested sediment with acid. The digestion method involved heating of 50mg of a finely powdered sample in a sealed Teflon vessel in a mixture with a mixed acid solution of concentrated HF, HNO3 and HCl. The Teflon vessel was kept at 150°C for 5 hours. After cooling, a mixed solution of HBO and EDTA was added, and the vessel was heated again at 150°C for 5 hours. After cooling at room temperature, the solution of the vessel was transferred into a polypropylene test tube and was dilute to 10mL with deionized water. A clear solution with no residue should be obtained at the last stage. The accuracy was also examined by analyzing duplicate Standard Reference Material 1646a Estuarine Sediment, the results of which were within ±3% of certified values. Recoveries of elements ranged from 96.3–102.6%.
Results and Discussion
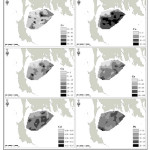 |
Figure 2: Heavy metal distribution (in µg/g dry weight) in Quiberon Bay. |
The distribution of metals in bottom sediment of Quiberon Bay has been examined in order to enhance the data inventory for the region, characterize the geochemistry of Cr, Fe, Co, Cu, Zn, Cd, and Pb in bottom sediments and to help understand the influence of anthropogenic activities on biogeochemical process in this bay system. Meanwhile, the distribution patterns were depicted through the interpolation of metal concentration by using ArcGIS 9.3 software (Figure 2). Concentrations of the heavy metals show a wide range of values; Cr (8.52–61.9 µg/g); Co (2.12–19.7 µg/g); Cu (3.45–40.9 µg/g); Zn (8.96–87.1 µg/g); Cd (0.02–0.13 µg/g); and Pb (8.88–28.0 µg/g). The mean values of the study area was 27.3 µg/g for Cr, 11.6 µg/g for Co, 13.8 µg/g for Cu, 42.0 µg/g for Zn, 0.08 µg/g for Cd and 17.8 µg/g for Pb, allowing to arrange the metals from lower to higher mean content as; Cd < Co < Cu < Pb < Cr < Zn.
Pearson’s correlation coefficient matrixes among the selected heavy metals in the sediment are depicted in Table 1. The matrix summarizes the strength of the linear relationships between each pair of variables. All the metal pairs in the surface sediment exhibit positive relations and some of them were significant at the 95% and 99% confidence levels. Fe–Co, Fe–Cu, Fe–Zn, Co–Zn pairs are significantly positively correlated with each other at the 99% confidence level, which may suggest a common pollution sources or a similar geochemical behaviour for these metals (Ahdy and Azza 2009) and a similar terrigenous source or a result of similar mechanisms of transport and accumulation within the sediments.
Table 1: Correlation matrix between heavy metals in sediment samples from Quiberon Bay
|
Cr |
Fe |
Co |
Cu |
Zn |
Cd |
Pb |
Mean Size |
|
| Cr |
1 |
|||||||
| Fe |
0.560 |
1 |
||||||
| Co |
0.412 |
0.760 |
1 |
|||||
| Cu |
0.632 |
0.845 |
0.652 |
1 |
||||
| Zn |
0.534 |
0.928 |
0.805 |
0.779 |
1 |
|||
| Cd |
0.352 |
0.569 |
0.557 |
0.462 |
0.670 |
1 |
||
| Pb |
0.485 |
0.569 |
0.393 |
0.570 |
0.648 |
0.431 |
1 |
|
| Mean size |
0.071 |
0.170 |
0.266 |
0.148 |
0.283 |
0.278 |
0.056 |
1 |
Significant correlation between all metal studied and Fe suggested Fe has a strong correlation with other oxides which have a higher affinity with most elements (Cardoso et al. 2001; Zabetoglou et al. 2002). Meanwhile, positive correlation also been found between the metals and sediment size suggested fine–grained sediments tend to have relatively high metal contents, due in part to the high specific surface of the smaller particle size.
Many authors prefer to express the metal contamination with respect to average shale to quantify the extent and degree of metal pollution (Muller 1969). In order to compare present day heavy metal concentrations with background values, we computed the ‘‘Index of Geoaccumulation’’, which was introduced by Müller (1979). The formula used for the calculation, Igeo = log2 (Cn/1.5Bn), where Cn is the measured content of element “n”, and Bn the element’s content in “average shale” (Turekian and Wedepohl 1961). The factor 1.5 is introduced to include possible variations of the background values due to lithogenic effects. Muller (1979) has distinguished seven classes of geoaccumulation index (Table 2).
The world average shale aften used to provide background metal levels. The regional background value for these metals are not available, thus the background concentration of Cr, Cu, Zn, Cd and Pb in the average shale obtained from Turekian and Wedepohl (1961) are used in this study. These values are commonly used as background values in sediment studies to quantify the extent and degree of metal pollution (Cevik et al. 2009; Nobi et al. 2010)
Table 2: Igeo classification (Müller 1979)
| Igeo | Igeo class | Description of sediment quality |
| <0 | 0 | Uncontaminated |
| 0–1 | 1 | Uncontaminated to moderately contaminated |
| 1–2 | 2 | Moderately contaminated |
| 2–3 | 3 | Moderately to strongly contaminated |
| 3–4 | 4 | Strongly contaminated |
| 4–5 | 5 | Strongly to extremely strongly contaminated |
| >5 | 6 | Extremely contaminated |
According to the Muller scale, the sediments of Quiberon Bay were found to be in class 0, uncontaminated (Table 3). On the basis of the mean values of Igeo, sediments are enriched for metals in the following order: Cd<Cu<Cr<Zn<Co<Pb.
Table 3: Geoaccumulation index value of heavy metals in sediment
|
Igeo |
Sediment quality |
||
| Average |
Min / Max |
||
| Cr | –2.40 |
–3.99 / –1.13 |
Uncontaminated |
| Fe | –2.67 |
–5.28 / –0.79 |
|
| Co | –1.50 |
–3.75 / –0.53 |
|
| Cu | –2.45 |
–4.29 / –0.72 |
|
| Zn | –1.94 |
–3.99 / –0.71 |
|
| Cd | –2.59 |
–4.53 / –1.77 |
|
| Pb | –0.78 |
–1.76 / –0.10 |
|
The extent of pollution by metals has been assessed by employing the method on pollution load index (PLI). PLI, for a particular site, has been evaluated following the method proposed by Tomilson et al. (1980). This parameter is expressed as, PLI = (CF1 x CF2 x CF3 x ……..CFn)1/n, where n is the number of metals (six in the present study) and CF is the contamination factor. The contamination factor can be calculated from the following equation, CF = (metal concentration in the sediment/background value of the metal). Because we do not have the background values of the metals of interest, same as we did in enrichment factor calculation, we will adopt the average shale values (Turekian and Wedepohl 1961) in index of geoaccumulation calculation.
The following terminology has been used in this pollution index to get a uniform way of describing the contamination factor. The PLI value > 1 is polluted whereas PLI value < 1 indicates no pollution (Chakravarty and Patgiri 2009; Seshan et al. 2010). The PLI value range from 0.23 to 0.79 confirmed that Quiberon bay superficial sediments are in unpolluted condition. The pollution load index does not show much fluctuation. Lower values of PLI imply no appreciable input from anthropogenic sources.
Acknowledgements
This work was partially funded by Laboratoire Géosciences Marines et Géomorphologie du Littoral, Université de Bretagne Sud, France and University Malaysia Terengganu, Malaysia. The authors would like to express sincere thanks to acknowledge Mr. Alain Brizard from Regional Committee of Conchyliculture (CRC), South Brittany assistance in collecting sediment samples and Mr. Joseph Bidai for the assistance of the laboratory of Institute of Oceanography, UMT for ICP–MS analyses.
References
- Ahdy HHH, Khaled A (2009) Heavy metals contamination in sediments of the Western Part of Egyptian Mediterranean Sea. Aust J Basic Appl Sci 3(4): 3330–3336.
- Buccolieri A, Buccolieri G, Cardellicchio N, Dell’Atti A, Di Leo A, Maci A (2006) Heavy metals in marine sediments of Taranto Gulf (Ionian Sea, Southern Italy). Mar Chem 99: 227–235.
- Cardoso AGA, Boaventura GR, Silva Filho EV, Brod JA (2001) Metal distribution in Sediments from the Ribeira Bay, Rio de Janeiro – Brazil. J Braz Chem Soc 12(6): 767–774.
- Cevik F, Göksu MZ, Derici OB, Fındık O (2009) An assessment of metal pollution in surface sediments of Seyhan dam by using enrichment factor, geoaccumulation index and statistical analyses. Environ Monit Assess 152(1–4): 309–317.
- Chakravarty M, Patgiri AD (2009) Metal pollution assessment in sediments of the Dikrong River, N.E. India. J Hum Ecol 27(1): 63–67.
- Chaumillon E, Proust JN, Menier D, Weber N (2008) Incised–valley morphologies and sedimentary–fills within the inner shelf of the Bay of Biscay (France): A synthesis. J Mar Syst 72: 383–396.
- Cobelo–Garcıa A, Prego R (2003) Land inputs, behaviour and contamination levels of copper in a ria estuary (NW Spain). Mar Environ Res 56: 403–422.
- Dai JC, Song JM, Li XG, Yuan HM, Li N, Zheng GX (2007) Environmental changes reflected by sedimentary geochemistry in recent hundred years of Jiaozhou Bay, North China. Environ Pollut 145: 656–667
- Guillaud JF, Aminot A, Delmas D, Gohin F, Lunven M, Labry C, Herbland A (2008) Seasonal variation of riverine nutrient inputs in the northern Bay of Biscay (France), and patterns of marine phytoplankton response. J Mar Syst 72: 309–319.
- Guillen G, Rainey G, Morin M (2004) A simple rapid approach using coupled multivariate statistical methods, GIS and trajectory models to delineate areas of common oil spill risk. J Mar Syst 45: 221– 235.
- Kalis AJ, Merkt J, Wunderlich J (2003) Environmental changes during the Holocene climatic optimum in central Europe: human impact and natural causes. Quat Sci Rev 22: 33–79.
- Kamaruzzaman BY, Ong MC, Noor Azhar MS, Shahbudin S, Jalal KCA (2008) Geochemistry of sediment in the major estuarine mangrove forest of Terengganu region, Malaysia. Am J Appl Sci 5(12): 1707–1712.
- Loska K, Cebula J, Pelczar J, Wiechula D, Kwapulinski J (1997) Use of enrichment and contamination factors together with geoaccumulation indexes to evaluate the content of Cd, Cu and Ni in the Rybnik water reservoir in Poland. Water Air Soil Pollut 93: 347– 365.
- Meng W, Qin YW, Zheng BH, Zhang L (2008) Heavy metal pollution in Tianjin Bohai Bay, China. J Environ Sci 20: 814–819.
- Muller G (1969) Index of geoaccumulation in sediments of the Rhine River. Geojournal 2(3): 108–118.
- Muller G (1979) Heavy metals in the sediment of the Rhine – Changes seity. 1971. Umsch Wiss Tech 79: 778–783.
- Nobi EP, Dilipan E, Thangaradjou T, Sivakumar K, Kannan L (2010) Geochemical and geo–statistical assessment of heavy metal concentration in the sediments of different coastal ecosystems of Andaman Islands, India. Estuarine Coastal Shelf Sci 87(2): 253–264.
- Ong MC, Kamaruzzaman BY (2009) An assessment of metals (Pb and Cu) contamination in bottom sediment from South China Sea coastal waters, Malaysia. Am J Appl Sci 6(7): 1418–1423.
- Ruiz F (2001) Trace metals in estuarine sediments from the South Western Spanish coast. Mar Pollut Bull 42: 482– 490.
- Seshan BRR, Natesan U, Deepthi K (2010) Geochemical and statistical approach for evaluation of heavy metal pollution in core sediments in southeast coast of India. Int J Environ Sci Tech 7(2): 291–306.
- Tomlinson DL, Wilson JG, Harris CR, Jeffrey DW (1980) Problems in the assessments of heavy metal levels in estuaries and formation of a pollution index. Helgol Meeresunters 33: 566–575.
- Turekian KK, Wedepohl KH (1961) Distribution of the elements in some major units of the earth’s crust. Geol Soc Am Bull 72(2): 175–192.
- Wan GJ, Bai ZG, Qing H, Mather JD, Huang RG, Wang HR, Tang DG, Xiao BH (2003) Geochemical records in recent sediments of Lake Erhai: implications for environmental changes in low latitude high altitude lake in southwest China. J Asian Earth Sci 21: 489–502.
- Zabetoglou K, Voutsa D, Samara C (2002) Toxicity and heavy metal contamination of surficial sediments from the Bay of Thessaloniki (Northwestern Aegean Sea) Greece. Chemosphere 49(1): 17–26.

This work is licensed under a Creative Commons Attribution 4.0 International License.
![]()
A New Edition of Web of Science
Journal Impact Factor
2022: 0.5
Five Year: 0.8
Journal is Indexed in

Cabells Whitelist
![]()


