Extractive Spectrophotometric Determination of Nicergoline Through Ion-Pair Complexation Reaction
K. Kiran Kumar1, R. Venkata Nadh2* and K. E. V. Nagoji3
1Department of Chemistry, Nalanda P.G. College, Vijayawada - 520 001, India.
2School of Biotechnology, Vignan University, Vadlamudi - 522 213, India.
3Department of Pharmacy, Sri Venkateswara College of Pharmacy, Etcherla, Srikakulam - 532 410, India.
Two simple, sensitive, selective, accurate and economical spectrophotometric methods (A and B) have been described in the present work for the determination of Nicergoline in bulk drug and pharmaceutical formulations (tablets). Methods – A/B are based on the formation of orange red / yellow colored ion-association complexes between Nicergoline and Tropaeolin ooo (TPooo) / Alizarine Red S (ARS) in acid medium followed by their extraction with chloroform, exhibiting absorption maxima at 490nm / 430nm, and obeying Beer’s law in the concentration range of 2.5–12.5µg/ml. Statistical analysis of the results of the proposed methods reveals high accuracy and good precision. The proposed methods could be successfully extended to the commercial pharmaceutical formulations containing Nicergoline.
KEYWORDS:Nicergoline; Tropaeolin ooo; Alizarine Red S; Ion-pair complex; Visible spectrophotometry
Download this article as:| Copy the following to cite this article: Kumar K. K, Nadh R. V, Nagoji K. E. V. Extractive Spectrophotometric Determination of Nicergoline Through Ion-Pair Complexation Reaction. Orient J Chem 2013;29(1). |
| Copy the following to cite this URL: Kumar K. K, Nadh R. V, Nagoji K. E. V. Extractive Spectrophotometric Determination of Nicergoline Through Ion-Pair Complexation Reaction. Orient J Chem 2013;29(1). Available from: http://www.orientjchem.org/?p=25173 |
Introduction
Nicergoline (Ergoline-8-methanol,10-methoxy-1,6-dimethyl-,8-(5-bromo-3-pyridinecarboxylate) is an ergot derivative used to treat cognitive, affective behavioural disorders of older people1 (Fig. 1). It has been used to treat symptoms of mental deterioration associated with cerebrovascular insufficiency and in peripheral vascular disease. The side effects of nicergoline are usually limited to nausea, hot flushes, mild gastric upset, hypotension and dizziness2. Literature survey revealed that spectrophotometric3-5, electrochemical6, capillary electrophoretic7, spectrofluorimetric8, HPLC9-11, LC-MS12 and radioimmunoassay13-14 methods have been developed for its determination. The chromatographic, voltammetric and electrophoretic methods utilized delicate and /or expensive instruments that are not available in most quality control laboratories. Visible spectrophotometry may serve as a useful alternative to many of the aforesaid sophisticated techniques, because of its cost effectiveness, ease of operation, sensitivity, fair accuracy and precision, and wide applicability. The extraction spectrophotometric procedures are popular for their sensitivity and selectivity in the assay of drugs15 and spectrophotometric techniques are the most widely used in pharmaceutical analysis16. In addition, the analytically important functional groups in Nicergoline have not been exploited properly so far, hence, in the present study, an attempt has been made to develop sensitive and flexible extractive visible spectrophotometric method involving ion pair complex formation for the determination of Nicergoline in pure and dosage formulations using the acidic dyes (ARS & TPooo).
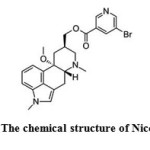 |
Figure 1: The chemical structure of Nicergoline. Click here to View figure |
Materials and Methods
Instrument
A Systronics digital spectrophotometer (model-106) provided with 1 cm matched quartz cells was used for all absorbance measurements. An Elico LI-120 digital pH meter was used for pH measurements. All spectroscopic measurements were carried out at room temperature (25 ± 40C).
Materials and Reagents
Chemicals used were of analytical reagent grade and distilled water was used throughout the investigation.
TPooo solution (0.2%)
Prepared by dissolving 200mg of Tropaeolin ooo (Benzenesulfonic acid, 4-[2-(2-hydroxy- 1-naphthalenyl)diazenyl]-, sodium salt, Fluka make) in 100ml of distilled water.
ARS solution (0.2%)
Prepared by dissolving 200mg of Alizarine Red S (9,10-dihydro-3,4-dihydroxy-9,10-dioxo-2-anthracenesulfonic acid sodium salt, BDH make) in 100ml of distilled water.
HCl solution (0.1M)
Prepared by diluting 8.6ml of conc HCl to 100ml with distilled water in a volumetric flask.
Preparation of standard solutions
The standard stock solution of Nicergoline was prepared by dissolving 25mg of the drug in 25mL of the methanol to get 1.0mg/mL solution. Final working standard solution of 100μg/mL of Nicergoline was prepared by diluting 1.0mL solution of the above solution to 10mL with distilled water. Calibration curves were constructed by plotting optical densities of the coloured solution (developed by following the proposed methods) versus concentrations of Nicergoline and the regression equations were calculated.
Preparation of Marketed formulations
In case of marketed formulations, two accurately weighed tablets were crushed to a fine powder and an amount equivalent to 10mg of Nicergoline was added into different 100mL volumetric flasks and volume was made up with methanol. The samples were filtered through a 0.45μm-membrane filter. The drug content of this solution was obtained by applying the proposed procedure to aliquot containing different volumes of solution drugs.
Proposed procedure for methods A and B
Different portions of standard Nicergoline solution (for Method A & B) were delivered in to a series of 80ml separating funnels and then 6.0 ml of 0.1M HCl and 2.0ml of 0.2% dye solution (TPooo and ARS in Method A and Method B respectively) were added successively and the total volume of aqueous phase in each separating funnel was made to 15.0ml with distilled water. To each separating funnel 10ml of chloroform was added and the contents were shaken for 2min. The two phases were allowed to separate and the absorbance of the separated chloroform layer was determined at λmax 490nm and 430nm respectively in Method A (TPooo) and Method A (ARS) against chloroform blank.
Results and Discussion
Ion pair extraction spectrophotometry has received considerable attention for quantitative estimation of many pharmaceutical compounds. This technique depends on the reaction of a drug that has basic cationic nitrogen and an anionic dye, where a highly colored ion-pair complex is formed17,18. An important advantage of the extractive spectrophotometric method is that it can be applied to the determination of an individual component in the presence of routine excipients and filling materials. This aspect of spectrophotometric analysis is of great interest since it offers distinct possibilities for the assay of a particular component in a complex dosage formulation. This lead the authors to develop two accurate, selective, precise, and inexpensive procedures for the determination of Nicergoline in bulk drug and pharmaceuticals based on ion-pair complex formation using Tropaeolin ooo (TPooo) / Alizarine Red S (ARS) as chromogens.
Absorption Spectra of extracted coloured ion-pair complexes
In the present investigation, the nitrogen on pyridine ring of Nicergoline enabled it to develop yellow and orange-red colours by the formation of ion association complexes with chromogens – TPooo (Method A) and ARS (Method B) respectively. These complexes have absorption maxima (λmax) at 490nm and 430nm for method A(Tpooo) and method B(ARS) respectively against chloroform blank (Fig. 3 and 4).Ca˜namares et al.19, (2006) have shown that alizarin red S can exist in three different forms (neutral absorbing at 433 nm, monoionized absorbing at 526 nm, and di-ionized absorbing at 567 nm) based on different pHs 3.4, 10.0, and 12.8, respectively. Nemodruk and Karalova20 have stated that alizarin red S has a yellow color in acid solutions (pH < 5).
Reaction Mechanism
Nicergoline being a base, forms an ion association complexes with acidic dyes – Tropaeolin ooo (TPooo) and Alizarine Red S (ARS) which are extractable into chloroform from the aqueous phase. In acidic medium, the nitrogen on pyridine of Nicergoline gets protonated and is expected to attract the oppositely charged part – anionic dye and behave as a single unit being held together by electrostatic attraction. The probable reaction mechanism of ion association complex is represented in scheme (Fig. 2)
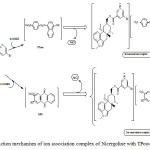 |
Figure 2: Reaction mechanism of ion association complex of Nicergoline with TPooo and ARS. |
Optimisation of reaction variables
The effect of the dye concentration was studied by measuring the absorbance of solutions containing a fixed concentration of Nicergoline (12.5 μgmL−1) and different amounts of the dye solution and the study showed that 2.0mL of 0.2% dye solution was necessary to yield a maximum absorbance. It was noticed that the maximum color intensity was observed using hydrochloric acid. Also, the formed ion-pair complex was found to be pH independent since no remarkable changes were observed while using different concentrations of HCl such as 0.05, 0.1, 0.3, and 0.5 M. Further, 6.0mL of 0.1M HCl gave reproducible results, and it was fixed throughout the study. The optimization of the reaction conditions was investigated. Among various organic solvents studied (benzene, toluene, cyclohexane, carbon tetrachloride, and chloroform), chloroform was preferred because of its selective and quantitative extraction of the drug-dye ion-pair from the aqueous phase, greater stability of the extracted ion-pair complex and short time required for the separation of the two phases hence, it was used in this experiment. The ratio of aqueous to organic phase on extraction was taken as 3:2. Shaking times ranging from 1 to 4 min produced no change in absorbance, and so two minutes shaking time was selected. Only one extraction was sufficient to achieve quantitative recovery of the complex as a second extraction with identical quantity of chloroform yielded negligible absorbance. The absorbance of the chloroform phase was stable for 2 – 3h. The absorbance was measured periodically at an interval of 15 min for 3 h. The composition of the ion-pair complex formed between Nicergoline and TPooo/ARS was established by applying Job’s method21 of continuous variations. The plot reached a maximum value at a mole fraction of 0.5 which indicated that a 1 : 1 (drug : acid dye) ion-pair complex was formed.
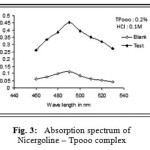 |
Figure 3: Absorption spectrum of Nicergoline – Tpooo complex. |
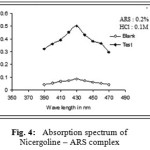 |
Figure 4: Absorption spectrum of Nicergoline – ARS complex.
|
Validation of the proposed methods
Validation of the proposed spectrophotometric methods was done according to ICH guidelines22.
a) Linearity and Range
The linearity of the method was determined at five concentration levels ranging from 2.5μg ml to 12.5μg.mL for Nicergoline. The calibration curve was constructed by plotting optical densities of coloured ion complexes against various concentrations of Nicergoline. The regression equations derived using the least-squares method23 for the calibration curves of Nicergoline were Y=0.031x+0.001 (R2=0.9995) for Method A(TPooo) and Y=0.036x+0.003 (R2=0.9998) for Method B(ARS) respectively. The results showed an excellent correlation between optical density and concentration of drugs within the concentration range indicated above (Table.1) for both the methods proposed. The calibration curves are shown in figures 5 and 6.
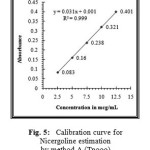 |
Figure 5: Calibration curve for Nicergoline estimation by method A (Tpooo). |
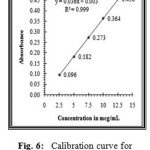 |
Figure 6: Calibration curve for Nicergoline estimation by method B (ARS). |
b) Sensitivity (LOD and LOQ)
The limit of detection (LOD) is defined as the lowest concentration of an analyte that an analytical process can reliably differentiate from back-ground levels. The limit of quantification (LOQ) is defined as the lowest concentration of the standard curve that can be measured with an acceptable accuracy, precision and variability. In this study, LOD and LOQ were based on the standard deviation of the response and the slope of the corresponding curve. The values of LOD and LOQ for Method A(TPooo) and Method B(ARS) are given in Table 1.
Table 1: Statistical analysis of calibration graphs and analytical data in the determination of the nicergoline using the proposed methods.
| Parameter |
Method A |
Method B |
| lmax (nm) |
490 |
430 |
| Beer’s law limits (mg/ml) |
2.5 – 12.5 |
2.5 – 12.5 |
| Molar absorptivity (1 mol-1.cm-1) |
3.658 x 10³ |
3.489 x 10³ |
| Sandell’s sensitivity(mg.cm-2/0.001 absorbance unit) |
0.0389 |
0.0328 |
| Optimum photometric range (mg/ml) |
3.0 – 9.0 |
3.5 – 10.0 |
| Slope (b)(From regression equation, Y=a+bc) |
0.0310 |
0.0360 |
| Standard deviation on slope (Sb) |
0.0002463 |
0.002571 |
| Intercept (a) |
0.001 |
0.003 |
| Standard deviation on intercept (Sa) |
0.0001423 |
0.0002674 |
| Standard error on estimation (Se) |
0.002366 |
0.002033 |
| Correlation coefficient (r) |
0.9995 |
0.9998 |
| Relative standard deviation (%)* |
1.006 |
1.674 |
|
% Range of error (confidence limits) |
||
| 0.05 level |
0.8415 |
1.4999 |
| 0.01 level |
1.244 |
2.218 |
| LOD |
0.01848 |
0.02853 |
| LOQ |
0.1848 |
0.2853 |
* Average of six determinations considered
c) Precision and Accuracy
The precision of the method was demonstrated by intraday variation studies. In the intraday studies, six repeated estimations of standard and sample solutions were made and the optical densities of the drug and Relative standard deviation (%) were calculated and found to be within permissible limits. The accuracy of the method was determined by recovery experiments. The recovery studies were carried out six times and the percentage recovery and standard deviation of the percentage recovery were calculated and presented in Table 1.
d) Analysis of pharmaceutical preparations
Commercially available Nicergoline tablets were subjected to analysis by the proposed methods. Results obtained by the proposed methods [Method A(TPooo) and Method B(ARS)] (Table 2) for Nicergoline confirm the suitability of these methods for commercial pharmaceutical formulations. The methods were successful to the determination of the active drug in pharmaceutical formulations without any detectable interference from the excipients present in the tablets.
Table 2: Estimation of Nicergoline in pharmaceutical formulations.
|
Sample |
Labelled amount (mg) |
Amount obtained (mg) Proposed methods* |
% Recovery of Proposed methods |
||
|
Method-A |
Method-B |
||||
|
Method-A |
Method-B |
||||
|
Sermion |
10 |
9.992 |
9.978 |
99.92 |
99.78 |
*Average of six determinations
Conclusion
Nicergoline was estimated successfully by the developed extractive spectrophotometric methods, both as a pure compound and as a pharmaceutical formulation. The proposed methods are suitable and valid for application in laboratories lacking of liquid chromatographic or other sophisticated instruments. These methods are simple, rapid, accurate, and does not involve any critical reaction conditions, or tedious sample preparation. It is unaffected by slight variations in experimental conditions such as pH, dye concentration, shaking time and temperature. Hence, the proposed methods can be used for the routine analysis of the cited drug in their available dosage forms.
References
- Fioravanti M. and Flicker L., Cochrane Database Syst Rev (4): CD003159 (2001).
- Sweetman S.C., 36 ed., Supplementary drugs and other substances. Martindale: The complete drug reference, Pharmaceutical Press, London, 2352 (2009).
- Zayed S.I.M., J. Anal. Chem., 65(9), 921-928 (2010).
- Vachek J., Czech., CS 236599 B1 19850515 (1986).
- Abdelal A.A., Kitagawa S., Ohtani H., El-Enany N., Belal F. and Walash M. I., J. Pharm. Biomed. Anal., 46(3), 491–449 (2008).
- Walash M.I., Belal F., El-Enany N. and Abdelal A., J. AOAC Inter., 91(2), 349-359 (2008).
- Qiu L.I. and Zhang D., Huaxi Yaoxue Zazhi, 21(6), 572–574 (2006).
- Kiran Kumar K. and Venkata Nadh R., Rasayan J. Chem., 4(4), 885–889 (2011).
- Jianzhen L.I. and Jiang Z., Yaowu Fenxi Zazhi, 20(2), 124–126 (2000).
- Banno K., Horimoto S. and Mabuchi, M., J. Chrom. Biomed. App., 568(2), 375–384 (1991).
- Bizollon C.H.A. and Rocher J.P. and Chevalier P., Euro. J. Nuc. Med., 7(7), 318–321 (1982).
- Ezan E., Delestre L., Legendre S., Riviere R., Doignon J.L. and Grogne J.M., J. Pharm. Biome. Anal., 25(1), 123–130 (2001).
- Beckett A.H. and Stenlake J.B., Practical Pharmaceutical chemistry, Vol. II, IV edition, CBS Publishers, New Delhi, 304 – 308 (1997).
- Al-Tamimi Salma, Alarfaj Nawal and Al-Hashim Hanan, Research Journal of Chemistry and Environment, 15 (2) 963–972 (2011).
- Al-Gannam S.M., J. Pharm. Biomed. Anal., 40, 151– 156 (2006).
- Vinay K.B. and Revanasiddappa H.D., Ind. J. Chem. Tech., 19, 205–212 (2012).
- Ca˜namares M.V., Sevilla P., Sanchez-Cortes S., and Garcia-Ramos J.V., Biopolymers, 82, (4) 405–409 (2006).
- Nemodruk A.A. and Karalova Z.K., Analytical Chemistry of Boron, Ann Arbor-Humphrey Science, London, UK, 1969.
- Job P, Ann. Chem,, 16, 97–102 (1936), In, “Advanced Physicochemical Experiments“. 2nd edition. Oliner and Boyd, Edinburgh, 54–56 (1964).
- International Conference on Harmonization, (ICH), Validation of Analytical Procedures: Text and Methodology, Q2 (R1), (2005).
- Mendham J., Denney R.C., Barnes J.D. and Thomas M., Vogel’s Textbook of Quantitative Chemical Analysis, Pearson Education Ltd, England (2000)
- Ahmad A.K.S., Kawy M.A. and Nebsen M., J. Pharm. Biomed. Anal., 30, 479–489 (2002).
- Sturm J.C., Nunez-Vergara L.J. and Squella J.A., Talanta, 39, 1149–1154 (1992).

This work is licensed under a Creative Commons Attribution 4.0 International License.
![]()
A New Edition of Web of Science
Journal Impact Factor
2022: 0.5
Five Year: 0.8
Journal is Indexed in

Cabells Whitelist
![]()


