Binuclear Copper(I) Complex Constructed by two End-to-End, µ-1,3-Azide bridges, [Cu2(PPh3)4(µ-N3)2]
Mohammad Hakimi
Chemistry Department, Payame Noor University, 19395-4697 Tehran, I. R. Iran.
Article Received on :
Article Accepted on :
Article Published : 19 Oct 2016
In this work, a mixed-ligand copper complex, [Cu2(PPh3)4(µ-N3)2] (1), was prepared and identified by elemental analysis, molar conductivity, FT-IR, Raman, 1H NMR, 13C NMR and UV-Vis spectroscopy and single-crystal X-Ray diffraction. The copper atom in 1 which is coordinated by two nitrogen atoms of the two azide groups and two phosphorus atoms of the two triphenylphosphine groups has a distorted tetrahedral geometry. If the distortion in 1 is disregarded, with a C2 axis and two perpendicular C2 axes to C2 axis it has D2 symmetry. The C–H···N and C–H···C hydrogen bonds and p®p stacking are stabilized the crystal network of1.
KEYWORDS:Binuclear; Copper(I) Complex; Azide Bridge; Triphenylphosphine; X-ray Crystal Structure
Download this article as:| Copy the following to cite this article: Hakimi M. Binuclear Copper(I) Complex Constructed by two End-to-End, µ-1,3-Azide bridges, [Cu2(PPh3)4(µ-N3)2]. Orient J Chem 2013;29(1). |
| Copy the following to cite this URL: Hakimi M. Binuclear Copper(I) Complex Constructed by two End-to-End, µ-1,3-Azide bridges, [Cu2(PPh3)4(µ-N3)2]. Available from: http://www.orientjchem.org/?p=22566 |
Introduction
The azide group (N3−) is a versatile bridging agent. It can bond to metal centers in several ways, as a terminal ligand via one nitrogen donor, as a bridge in the μ-1,1 (end-on, EO) and μ3-1,1,1 modes via one nitrogen donor, and in the μ-1,3 (end-to-end, EE) and μ3-1,1,3 via both of the peripheral nitrogen donor atoms1. Azide bridged metal complexes have been received much attention because of their remarkable structural diversity and rich magnetic behavior2. Its bonding in transition metal centres has generated varieties of magnetic materials. Non-transition metal complexes of N3− are less developed compared to that of transition metal complexes3.
In the past few years we have studied complexation of multi N-donor ligands4−6. In continuation of our previous studies, in this work the preparation of copper(I) complex, [Cu2(PPh3)4(μ-N3)2] (1), with mixed-ligand, azide and triphenylphosphine, was described. This complex was characterized by elemental analysis, FT-IR, Raman, UV-Vis, 1H NMR and 13C NMR spectroscopy, molar conductivity, and X-ray crystallography.
Material And Methods
General methods
All starting chemicals and solvents were reagent or analytical grade and used as received. [Cu(PPh3)3N3]was prepared accordingly to the literature7. 1H NMR and 13C NMR spectra were recorded on a Bruker BRX-100 AVANCE instrument operating at 100 MHz; chemical shifts are given in parts per million, with values in reference to an internal standard of TMS. Raman spectrum was obtained using a Nicolet Model 910 Fourier-transform spectrometer. The infrared spectrum of a KBr pellet was recorded in the range 400–4000 cm−1 using a FT-IR 8400-Shimadzu spectrometer. The electronic spectrum was recorded in DMF with a Shimadzu model 2550 UV/Vis spectrophotometer (190–900 nm). The molar conductance value of 1.0 × 10⁻³ M DMF solutions of the complex was measured with a Metrohm 712 conductometer. The carbon, hydrogen and nitrogen contents were determined in a Thermo Finnigan Flash Elemental Analyzer 1112 EA. Melting point was determined using a Barnsted Electrothermal 9200 electrically heated apparatus.
Synthesis of [Cu2(PPh3)4(μ-N3)2], 1.
A hot ethanolic solution of isatine-3-thiosemicarbazone (1 mmol, 0.23 g ) was added with stirring to a hot solution of [Cu(PPh3)3N3](2 mmol, 0.18 g) in CH2Cl2 (30 mL). The reaction mixture was stirred at 70 °C for 3 h and filtered. Colorless crystals suitable for X-ray diffraction were obtained from the solution after standing for 7 days. Yield (0.78 g) 62 %; m.p.: 213 °C. Anal. Calcd for C72H60Cu2N6P4 (%): C, 68.62; H, 4.80; N, 6.67. Found: C, 68.11; H, 4.75; N, 6.69. IR (KBr, cm−1): 3055 vw (ν CHar), 2052 s (νa NNN), 1435 w (ν C=C), 1311 w (νs NNN), 1095 w (ν P−C), 748 m (γ CH), 628 w (δ NNN), 509 m (ν Cu−N). Raman (cm−1): 1424 s (ν C=C), 1308 w (νs NNN), 1020 m (ν P−C), 771 m (γ CH), 612 w (δ NNN), 493 m (ν Cu−N), 311 m (ν Cu−P). 1H NMR (100 MHz, [D6]-DMSO): 7−7.5 (m, 60 H) ppm. 13C NMR (100 MHz, [D6]-DMSO): 128.6, 129.6, 132.3, 133.2 ppm. UV-Vis (DMF, λmax (nm)/ε): 444/1.1× 104 (n→π*), 362/1.2 × 104 (n→π*), 256/3.2 × 104 (π→π*). Molar conductivity (1 × 10⁻³ mol L−1, Ethanol): 9.837 Ω−1 cm2 mol−1.
Crystal structure determination and refinement
The data collection for 1 was carried with a Bruker APEX-II CCD diffractometer, using graphite-monochromatized MoKα (λ = 0.71073 Å) radiation at 296 K. The data were integrated with SAINT8 and corrected for Lorentz and polarization effects. Absorption was corrected for using SADABS9. The structure was solved by Patterson methods, implemented in SHELXS-9710. Refinement by full-matrix least-squares methods based on F2 values against all reflections has been performed by SHELXL-9710, including anisotropic displacement parameters for all non-H atoms. The position of hydrogen atoms belonging to the carbon atoms Csp2 were geometrically optimized applying the riding model [Csp2–H, 0.93 Å; Uiso(H) = 1.2 Ueq(C)]. Calculations concerning the molecular geometry, the verification of space group and the analysis of hydrogen bonds were performed with PLATON11. Table 1 contains crystallographic data and details of the data collection and structure refinement. Selected bond lengths (Å) and angles (°) and dimensions of the hydrogen bonds (Å and °) for complex are listed in table 2 and table 3, respectively.
Table 1: Crystal data and structure refinement for 1.
| Empirical formula | C72H60Cu2N6P4 |
| Formula weight (g mol−1) | 1260.22 |
| Temperature (K) | 296 |
| Crystal system | Monoclinic |
| Space group | P21/c |
| Unit cell dimensions (Å, °) | |
| A | 23.4833(18) |
| B | 13.6611(10) |
| C | 19.9645(15) |
| Β | 106.522(1) |
| Volume (Å3), Z | 6140.3(8), 4 |
| Calculated density (g cm−3) | 1.363 |
| Absorption coefficient (mm−1) | 0.85 |
| F(000) | 2608 |
| Crystal size (mm3) | 0.10 × 0.10 × 0.05 |
| θ range for data collection (°) | 1.7–27.5 |
| h, k, l ranges | −26:30, −17:16, −25:21 |
| Reflections collected | 33960 |
| Independent reflections | 13812 |
| Rint | 0.026 |
| Data / restraints / parameters | 13812 / 0 / 752 |
| Goodness-of-fit on F2 | 1.07 |
| Final R indices [I > 2σ(I)] | R1 = 0.039, wR2 = 0.1012 |
| R indices (all data) | R1 = 0.0620, wR2 = 0.123 |
| Largest diff. peak and hole (e.Å−3) | 0.47 and −0.60 |
Table 2: Selected bond length (Å) and angles (°) for 1 with estimated standard deviations in parentheses.
| Distances | |||||
| Cu1–N1 | 2.115(2) | Cu2–N3 | 2.101(2) | ||
| Cu1–N4 | 2.114(2) | Cu2–N6 | 2.103(2) | ||
| Cu1–P1 | 2.2721(8) | Cu2–P3 | 2.2458(7) | ||
| Cu1–P2 | 2.2614(7) | Cu2–P4 | 2.2600(7) | ||
| N1–N2 | 1.186(3) | N2–N3 | 1.174(3) | ||
| N4–N5 | 1.171(3) | N5–N6 | 1.185(3) | ||
| Angles | |||||
| N1–Cu1–N4 | 98.61(10) | N3–Cu2–N6 | 99.12(9) | ||
| N1–Cu1–P1 | 103.08(8) | N3–Cu2–P3 | 114.22(7) | ||
| P1−Cu1−P2 | 120.88(3) | P3−Cu2−P4 | 121.69(3) | ||
| P2–Cu1–N4 | 108.31(7) | P4–Cu2–N6 | 107.75(8) | ||
| N1–N2–N3 | 177.0(3) | N4–N5–N6 | 177.6(3) | ||
Table 3: Dimensions of the hydrogen bonds (Å and °) in 1
| D–H···A | d(D–H) | d(H···A) | <(DHA) | d(D···A) | Symmetry code |
| C29–H29A···C4 | 0.930 | 2.862 | 140.0 | 3.624(4) | 1− x, − 0.5 + y, 1.5 − z |
| C30–H30A···C11 | 0.930 | 2.857 | 155.9 | 3.725(5) | 1− x, − 0.5 + y, 1.5 − z |
| C40–H40A···C57 | 0.930 | 2.839 | 143.9 | 3.633(4) | x, 1 + y, z |
| C46–H40A···C41 | 0.930 | 2.888 | 154.1 | 3.747(5) | x, 1.5 − y, 0.5 + z |
| C51–H51A···N3 | 0.929 | 2.576 | 148.8 | 3.405(4) | 2− x, 1 − y, 2 − z |
| C63–H63A···C58 | 0.929 | 2.746 | 140.6 | 3.514(4) | x, 0.5 − y, 0.5 + z |
Results and Discussion
Similar structure to 1 was reported previously12. In this paper we used new synthetic rout and different precursors for synthesis of 1 and extensive spectroscopic methods for characterization. Also the data collection of 1 was carried in different temperature respect to the previous report.
Presence of N3‾ in the structure of 1 affects IR and Raman spectra in three regions including 2052 and 1311 cm−1 for asymmetric and symmetric NNN stretches and 628 cm−1 for NNN bending13. Information about the low-frequency vibrations of the metal-ligand bonds can be obtained by Raman spectroscopy14. The Cu−N and Cu−P stretching vibrations have been assigned to the bands at 493 and 311 cm−1, respectively, consistent with the values reported in the literature15. UV–Vis spectrum of 1 in DMF exhibited a broad absorption with the λmax at 444 and 362 nm for n→π* transitions and 256 nm for π→π* transition.
Description of the crystal structure
The crystal structure of 1 was determined by X-ray single-crystal diffraction. The molecular graphics were drawn with ORTEP-III16 and Mercury17.
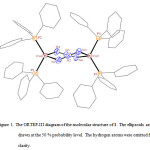 |
Figure 1. The ORTEP-III diagram of the molecular structure of 1. The ellipsoids are drawn at the 50 % probability level. The hydrogen atoms were omitted for clarity. Click here to View figure |
In the crystal structure of 1 (figure 1), each copper atom has a distorted tetrahedral coordination environment. Two sites are occupied by nitrogen atoms of the two azide groups with the Cu–N bond lengths in the range of 2.114(3)–2.115(2) Å. The two other sites are occupied by two phosphorus atoms of the two triphenylphosphine groups with the Cu–P bond lengths in the range of 2.2614(6)–2.2720(8) Å. If the distortion in 1 is disregarded, with a C2 axis and two perpendicular C2 axes to C2 axis it has D2 symmetry (figure 2).
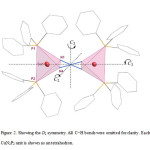 |
Figure 2. Showing the D2 symmetry. All C−H bonds were omitted for clarity. Each CuN2P2 unit is shown as an tetrahedron. Click here to View figure |
In the crystal network of 1 (figure 3), there are intermolecular C–H···N and C–H···C hydrogen bonds (table 3). The nitrogen atoms in hydrogen bonds act as proton acceptors whereas the carbon atoms participate in hydrogen bonding as both proton donors and acceptors. In addition to these hydrogen bonds there are π−π stacking18 between parallel aromatic rings belonging to adjacent complexes.
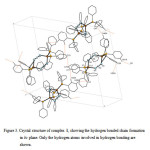 |
Figure 3. Crystal structure of complex 1, showing the hydrogen bonded chain formation in bc plane. Only the hydrogen atoms involved in hydrogen bonding are shown. Click here to View figure |
Supplementary material
CCDC 917542 for [Cu2(PPh3)4(μ-N3)2] (1) contain the supplementary crystallographic data for this paper. These data can be obtained free of charge via www.ccdc.cam.ac.uk/conts/retrieving.html.
Acknowledgement
We are grateful to Payame Noor University of I. R. Iran for financial support.
References
- Mautner F. A., Sudy B., Egger A., Mautner E. M., Escuer A. and Vicente R., Inorg. Chem. Commun., 21, 4 (2012).
- Ribas J., Escuer A., Monfort M., Vicente R., Corte´s R., Lezama L. and Rojo T., Coord. Chem. Rev., 1027, 193 (1999).
- Chand B. G., Ray U. S., Mostafa G., Cheng J., Lu T.-H. and Sinha C., Inorg. Chim. Acta, 358, 1927 (2005).
- Hakimi M., Mardani Z., Moeini K. and Fernandes M. A., J. Coord. Chem., 65, 2221 (2012).
- Hakimi M., Maeder M. and Lawrance G. A., J. Coord. Chem., 64, 105 (2011).
- Hakimi M., Moeini K., Mardani Z., Fernandes M. A., Mohr F. and Schuh E., J. Coord. Chem. 65, 1232 (2012).
- Lemos S. S., Camargo M. A., Cardoso Z. Z., Deflon V. M., Forsterling F. H. and Hagenbach A., Polyhedron, 20, 849 (2001).
- SAINT (version 7.12), Bruker Analytical X-ray Instruments Inc., Madison, Wisconsin, USA (2004).
- Sheldrick G. M., SADABS, Program for Empirical Absorption Correction of Area Detector Data, University of Gottingen, Gottingen, Germany (1996).
- Sheldrick G. M., Acta Crystallogr., A46, 467 (1990).
- Spek A. L., J. Appl. Crystallogr., D65, 148 (2009).
- Ziolo R. F., Gaughan A. P., Dori Z., Pierpont C. G. and Eisenberg R., Inorg. Chem., 10, 1289 (1971).
- K. Nakamoto, Infrared and Raman Spectra of Inorganic and Coordination Compounds, 6th ed., John Wiley & Sons, Hoboken, pp. 290 (2009).
- Hakimi M., Mardani Z., Moeini K., Minoura M. and Raissi H., Z. Naturforsch., 66b, 1122 (2011).
- Yazdanbakhsh M., Hakimi M., Heravi M. M., Ghassemzadeh M. and Neumüller B., Z. Anorg. Allg. Chem., 630, 627 (2004).
- Farrugia L. J., J. Appl. Crystallogr., 30, 565 (1997).
- Macrae C. F., Bruno I. J., Chisholm J. A., Edgington P. R., McCabe P., Pidcock E., Rodriguez-Monge L., Taylor R., van de Streek J. and Wood P. A., J. Appl. Crystallogr., , 41, 466 (2008).
- Hakimi M., Mardani Z., Moeini K., Mohr F., Schuh E. and Vahedi H., Z. Naturforsch., 67b, 452 (2012).

This work is licensed under a Creative Commons Attribution 4.0 International License.
![]()
A New Edition of Web of Science
Journal Impact Factor
2022: 0.5
Five Year: 0.8
Journal is Indexed in

Cabells Whitelist
![]()


