2, 4-Dihydroxy-5-Bromo-Alpha-Phenylacetophenone Thiosemicarbazone (Dhb-&-Pat) as Analytical Reagent: Studies on Cu(Ii) Chelate
Nitinkumar B. Patel1, Yashpal Sinh, J. Solanki2 and A. B. Patel3
1,2Shree Jayendrapuri Arts & Science College, Bharuch, Gujarat, India. 3Faculty of Engineering Technology and Research Bardoli - 394 620, India.
2, 4-dihydroxy -5-bromo-α-phenyl acetophenone thiosemicarbazone [DHB-α-PAT] has been used for the spectrophotometric determination of Cu(II). The method is simple, rapid and sensitive. Light green colour 1:2 (M:L) complex formed between Cu(II) and DHB-α-PAT in the pH range 3.0-6.5. The absorption spectrum shows as shoulder at 420 nm. The molar absorptivity and Sandell’s sensitivity is found to be 5.018 x10³lit.mol-1.cm-1 and 0.01266 µg/cm2, respectively. A number of foreign ions are tested for their interference. Antibacterial activity, TGA studies, Elemental analysis, 1H1 NMR spectra of Reagent, IR spectra of the reagent and its complex were reported. The reagent has been successfully applied to the determination of Cu(II) in drained microetch solution.
KEYWORDS:Chelate; Complex; TGA; IR; NMR; Antibacterial activity
Download this article as:| Copy the following to cite this article: Patel N. B, Sinh Y, Solanki J, Patel A. B. 2, 4-Dihydroxy-5-Bromo-Alpha-Phenylacetophenone Thiosemicarbazone (Dhb-&-Pat) as Analytical Reagent: Studies on Cu(Ii) Chelate. Orient J Chem 2013;29(1). |
| Copy the following to cite this URL: Patel N. B, Sinh Y, Solanki J, Patel A. B. 2, 4-Dihydroxy-5-Bromo-Alpha-Phenylacetophenone Thiosemicarbazone (Dhb-&-Pat) as Analytical Reagent: Studies on Cu(Ii) Chelate. Orient J Chem 2013;29(1). Available from: http://www.orientjchem.org/?p=25170 |
Introduction
The thiosemicarbazone of aldehydes and ketones are found to be better chelating agents and they have been exploited to the maximum extent by many workers (1-6). Many organic reagents like o-hydroxy oximes, oximes, thiosemicarbazones, chalcone oxime, anilides, various heterocyclic compounds have been used for gravimetric and spectrophotometric reagent for cu (II). Spectrophotometric methods have been used to confirm the stoichiometry of the complex and to determine the stability constant of the complex. The stoichiometry was also confirmed by thermo gravimetric analysis.
Material and Methods
Instruments
Spectrophotometric measurements were done on Shimadzu UV–1700 UV-Visible spectrophotometer and all the pH measurement were done on electronic pH-meter (EQ-614).
Synthesis of 2, 4-Dihydroxy-5-Bromo-α-Phenylacetophenonethiosemicarbazone
[DHB-α-PAT]
2, 4-dihydroxy-α-Phenylacetophenone was prepared from resorcinol, phenyl acetic acid and anhydrous zinc chloride according to the method of H. Nogemi(7). The bromination of 2, 4-dihydroxy-α-Phenyl acetophenone using Br2 in glacial acetic acid gives 2, 4-Dihydroxy-5-Bromo-α-Phenylacetophenone.The reagent was prepared by refluxing the solution of 2, 4-Dihydroxy-5-Bromo-α-Phenyl acetophenone with alcoholic solution of thiosemicarbazide. It was crystallized from absolute alcohol. (m.p. 95 ºc)
The thiosemicarbazone reagent was characterized by following probe
Elemental analysis
Elemental analysis of the reagent was done using Carlo-Erba Elemental Analyzer Model 1106. The percentage elements, found are in agreement with its molecular formula. The results are given in the following Table-I.
Table 1
|
Reagent |
%Carbon [Calc.] |
%Hydrogen [Calc.] |
%Nitrogen [Calc.] |
%Sulphur [Calc.] |
|
DHB-α-PAT |
47.32% [ 47.38% ] |
3.66% [ 3.71% ] |
10.96% [ 11.05% ] |
8.37% [ 8.43% ] |
UV-Visible spectral studies
The UV-Visible spectrum of reagent in ethanol was recorded on Shimadzu UV–1700 Perkin-Elmer Lambada-35 UV-Visible spectrophotometer. Wavelength of maximum absorption was found at 280 nm that falls in UV region.
FT-IR Spectral Studies
FTIR spectrum of the reagent was recorded on a Simadzu 8400-spectrophotometer in KBr pallet. The IR spectrum of DHB-α-PAT shows strong band at 3394cm-1 which may be assigned to O-H stretching due to two Phenolic –OH groups and –OH moiety of =N-OH group. Strong bands at 2908 cm-1, 3061 cm-1and 1618 cm-1may be assigned to aliphatic C-H stretching, aromatic C-H stretching and C=N stretching respectively.
On comparing the IR spectra of the Cu(II)- DHB-α-PAT chelate shows the weak band around 3394 cm-1which shows that among two Phenolic –OH groups, the hydrogen of 2-hydroxy group is lost and oxygen forms covalent bond with metal during complex formation. The bands of aliphatic C-H stretching and aromatic C-H stretching are observed at nearly same position in reagent as well as in complex. The band due to C=N stretching which is observed at 1618 cm-1in ligand is shifted to around 1593 cm-1 in complex. This may be due to coordination of metal through nitrogen. Thus, in the chelates, metal is covalently bonded with oxygen and co-ordinately bonded with nitrogen.
1H1-NMR Spectral Studies
The NMR spectrum of the reagent was taken in DMSO. The NMR spectrum was (obtained at SAIF, Punjab) recorded on a BRUKER AVANCE II 400 NMR Spectrometer using TMS as reference, Assignment of signals to different protons is given in the following table-II.
Table 2
|
Reagent
|
-CH2 singlet
|
-NH2 singlet
|
Aromatic Proton Multiplate |
-CSNH- singlet
|
Phenolic -OH Singlet
|
| DHB-α-PAT |
δ= 3.48 |
δ= 4.25 |
δ= 6.5-8.0 |
δ= 11.13 |
δ=12.62 |
Antibacterial activity of reagent and chelate:
Thiosemicarbazones being chelating agents shows good antibacterial activity (9-11) by hinder the growth of bacteria by chelating the metal ions which are present in trace in biological fluids. The antibacterial properties of the above compound are studied by using “Broth Dilution Method” (12,13) to evaluate the antibacterial activity.
Table 3
|
STANDARD DRUGS |
E.Colli [gram –ve] [microgram /ml] |
S.Aures [gram +ve] [microgram /ml] |
|
GENTAMYCINE |
0.05 |
0.25 |
|
AMPICILINE |
100 |
250 |
|
CHLORAMPHENICOL |
50 |
50 |
|
CIPROFLOXACIN |
25 |
50 |
|
NORFLOXACIN |
10 |
10 |
Table 4:
|
SAMPLE |
E.Colli [gram –ve] [microgram /ml] |
S.Aures [gram +ve] [microgram /ml] |
|
DHB-α-PAT |
200 |
250 |
|
Cu(II) – DHB-α-PAT |
100 |
250 |
From above result we can conclude that,
DHB-α-PAT reagent shows same activity for S. Aureus (Gram+ve) bacteria like “Ampicilline drug” while shows poor activity against E.coli (Gram-ve) bacteria.
Cu(II)-DHB-α-PAT chelate shows good activity against E.coli (Gram-ve) bacteria than S.aureus (Gram+ve) bacteria both activities are same as “Ampicilline drug”.
Preparation of Cu(II) solution
A stock solution (0.05 M) of Cu(II) was prepared by dissolving requisite quantity of CuSO4.5H2O (A.R.) in double distilled water with little sulphuric acid and diluting it to 250 ml. The stock solution was used after standardization with EDTA(17). Experimental solutions of required concentration were prepared by appropriate dilution of the above stock solution.
Spectrophotometric determination of copper, Selection of wavelength and effect of pH
To take the absorption spectra 1.0 ml of (0.002M) metal ion solution and 5.0 ml of (0.01M) reagent DHB-α-PAT solution were taken in a 50 ml beaker. The pH of the solution was adjusted within the range where maximum colour develops. The solution was made up to the mark using 50% aqueous ethanol and the absorbance was recorded between 380 nm to 800 nm against reagent blank. The absorption spectra showed a shoulder at 420nm and hence all the measurements were carried at this wavelength. It was observed that the absorption
increased up to pH= 6.0 and then decreased with increase in pH. Hence, all the subsequent measurements pH= 6.0 was maintained. It was found that colour development is quite rapid and the absorbance of complex remains unchanged for 24 hours. The order of addition of reagents (metal ions, ligand and buffer solution) had no effect on the absorbance of the complex.
Varification of Beer’s law
To 4.0ml (0.01 M) solution of the reagent DHB-α-PAT in each of a set of beakers, varying amount of metal solution (0.001M) were added and the pH was adjusted to 6.0 by acetic acid-sodium acetate buffer. This solution was diluted to 25ml with aqueous ethanol so as to keep 50% concentration of ethanol in final diluted solution. The absorbance of this solution was measured at 420 nm against reagent blank. This wavelength was selected from the absorption spectra as there is a shoulder at this wavelength. Absorbance values were plotted against the metal ion concentration expressed in ppm. A straight line passing through the origin, indicating the obeyance of Beer law was obtained up to 2.55 ppm of Cu(II). The molar absorptivity(e) from Beer’s law plot was found to 5.018 X 10³ lit.mol-1.cm-1 for Cu(II)-DHB-α-PAT complex at 420 nm and Sandell’s(14) sensitivity was found to be 0.01266 μg /cm2. The reagent can be used for the determination of Cu(II).
Thermo gravimetric analysis
Thermogravimetric analysis of copper chelate was done on on “TA-Instrument SDTQ-600”. A definite quantity of chelate was taken in an alumina crucible and was put on a hanger of microbalance and crucible was kept in a furnace. The temperature of the furnace was raised from 30οC to 900 οC in a programmed manner at the rate of 10οC/min. The atmosphere in the furnace was of static air. The temperature was calibrated using the standard methods. The graph of weight of chelate as a function of temperature was recorded automatically. The instrument had also facility to compute the percentage weight loss in different stages. The weight of final residue obtained was recorded. From thermogravimetric analysis of the Cu(II) chelate, it was found that there is no mass loss up to 140°C, indicating that the chelate can be dried safely without decomposition at 110ºC. Loss in mass above 140°C-810°C is due to decomposition of chelate and loss of ligand molecules. Mass of final residue corresponds to CuO is in accordance with the formula (C15H13O2N3SBr)2Cu. The observed loss and mass expected as per formula of chelate in which M: L ratio is 1:2 in the complex. Broido method(12) was applied to TG thermo grams of Cu(II) chelate obtained with heating rate 10ºC/min. Activation Energy Ea was calculated using this method for thermal decomposition of chelates. The value of ‘Ea’ was found to be 30.51 and 24.65 k cal/mole for first and second decomposition step respectively.
Stoichiometry of complex
The Job’s (15) method of continuous variation and Yoe and Jones(16) mole ratio method, suggest the composition of complex to be 1:2 (metal: ligand) ratio. The average stability constant found from two methods is 2.46 x 10¹⁰. The standard free energy change for the complex formation reaction was calculated using the relationship ΔGο = -RTlnKs and it is found to -14.263 k cal/mole at 27οC
Effect of diverse ion
Interference due to associated ions was examined in the determination of 2.55 ppm of Cu(II) at pH=6.0 using the reagent DHB-α-PAT. The tolerance limit was taken as the amount of foreign ion required to cause + 2% error in the absorbance. How many excess could be tolerated in shown in bracket.
Many anions like F–, Cl–, Br–, NO3– and SO4-2 do not interfere in the determination of copper at pH-6.0, even when they are present in 50-fold excess. Thiourea (20), thiosulphate (20), oxalate (2) can be tolerated. A 30-fold excess of Zn(II), Sr(II), Ca(II), Mg(II), Cd(II), Al(III), Na(I), K(I), Ba(II) do not interfere.
Analytical Application of the Reagent
Determination Of Copper In Drained Microetch Solution Using Dhb-Α-Pat
Gujarat Narmada Valley Fertilizers Corporation Ltd, Bharuch (GNFC) has a plant to manufacture printed circuit boards. In this plant, they get microetch solution which has approximately 2% copper.
This solution was used to check the applicability of the reagent [DHB-α-PAT] to determine copper. 10ml of above sample solution was diluted to 100ml with double distilled water in SMF. Diluted Drained microetch sample was analyzed by conventional titrimetric method, which showed 2.364% copper content in original solution.
From original microetch sample solution an aliquot of 10ml was diluted to 1000ml. From this diluted solution, 10ml was further diluted to 100ml using double distilled water. So, we get stock solution of 1ml = 23.64µg.
Complexation behaviour of Cu(II) present in 1.0ml and 2.0ml of diluted microetch sample solution was studied with excess of reagent (0.2ml and 0.4ml, 0.01M) at pH 6.0 by making final volume 25ml with 50% aqueous ethanol and the absorbance of above solution was measured at 420 nm using ligand blank. Absorbance values obtained were plotted in Beer’s law plot.
Table 5; % of Cu(II) in microetch sample solution =2.364%
|
Absorbance |
ppm Cu(II)taken |
ppm Cu(II)found |
% of Cu(II)obtained |
%Error |
|
0.076 |
0.9456 |
0.9400 |
2.350 |
-0.59% |
|
0.138 |
1.8912 |
1.8700 |
2.338 |
-1.10% |
Fig 1
<
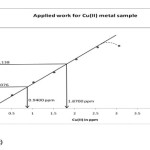 |
Figure 1
|
(Beer’s law plot)
Acknowledgement
The authors are very thankful to the principal, Head of the chemistry department of Shree Jayendrapuri Arts & Science College, Bharuch for providing laboratory and library facilities during my research work.
References
- A.werner; Z. Anorg. Chem.,3 ,270(1983).
- R. M. Patel, K. S. Parikh and K. N. Patel; Int. J. Chem Tech Research Vol. 2, No.2, pp 1090-1093 (2010).
- G. Ramanjaneyulu, P. Raveendra Reddy, and T. Sreenivasulu Reddy;The Open Analytical Chemistry Journal, 2, 78- 82 (2008).
- A. Praveen Kumar, P. Raveendra Reddy and V. Krishna Reddy; J. A. Method and Management in Chemistry. Article ID 48768, 6 (2007).
- B. Krishna Reddy, J. Rajesh Kumar, K. Janardhan Reddy and A.Varada Reddy;Analytical Science (J. S. A. C) Vol. 20 (2004).
- K. Hussain Reddy, N. B. L. Prasad and T. Sreenivasulu Reddy; Talanta, Vol. 59, 3, 425-433 (2003).
- H. Nogami: J. Pharm.Soc.,Japan,61, 46(1945).
- A. Broido J. Polymer Sci., Part A-2, 7, 1761 (1969).
- S. R. Modi; Ph. D. Thesis, SouthGujaratUniversity, Surat (1994).
- S. H. Abo EL Fetoh, A. E. Eid, A.T. Abd EL-Kareem and M. A.Wassel; J. Mater. Sci. Technol., Vol. 14(1998).
- A. K. Parekh and K. K. Desai; Indian J. Chem., Vol. 45B pp. 1072-1075 (2006).
- Clinical Microbiology procedure handbook, vol. II, chapter 5,Page no. 501, Henry d. Isenberg, 2nd edition Indian Journal of chemistry, section-b, vol.46b, pp. 550-553 (2007).
- E. B. Sandell; “Colourimetric determination of traces of metals” 3rd.,Wiley Interscience (1962).P. Job;
- Ann(10),9,113(1928);(11),6,97(1936); compt.Rend.,180,928(1925).
- J. H.Yoe and A. L. Jones; Ind. Engg. chem. Anal. Ed.,16, 111(1944).
- Vogel A.I. “A Text book of quantitative Inorganic analysis” 3rd Ed. Longman, London. 1971, 37, 40

This work is licensed under a Creative Commons Attribution 4.0 International License.
![]()
A New Edition of Web of Science
Journal Impact Factor
2022: 0.5
Five Year: 0.8
Journal is Indexed in

Cabells Whitelist
![]()


