Transition Metal Chelates of 2-[(2, 6-dichlorophenyl)-amino] Benzene Acetic Acid: Synthesis, Spectral Characterization and Antimicrobial Studies
Dilip R. Kulkarni1 and Madhavrao N.Deshpande2
1Shrikrishna Mahavidyalaya, Gunjoti, Tq Omerga.Dist Osmanabad - 413 613, India. 2Deparment of Chemistry and Agrochemicals and fertilizers, NES Science College, Nanded - 431 602, India.
Article Received on :
Article Accepted on :
Article Published : 20 Oct 2016
No
KEYWORDS:Transition metal chelates; Spectral analysis; Antimicrobial activity
Download this article as:| Copy the following to cite this article: Kulkarni D. R, Deshpande M. N. Transition Metal Chelates of 2-[(2, 6-dichlorophenyl)-amino] Benzene Acetic Acid: Synthesis, Spectral Characterization and Antimicrobial Studies. Orient J Chem 2012;28(4). |
| Copy the following to cite this URL: Kulkarni D. R, Deshpande M. N. Transition Metal Chelates of 2-[(2, 6-dichlorophenyl)-amino] Benzene Acetic Acid: Synthesis, Spectral Characterization and Antimicrobial Studies. Available from: http://www.orientjchem.org/?p=22716 |
Introduction
Several aromatic carboxylic acids and metal Carboxylate complexes are known to have antibacterial and antifungal properties1,2. Transition metal complexes of carboxylate anions can adopt a wide range of bonding modes including monodentate, symmetric and asymmetric chelating and bidentate and monodentate bridging3 and they are reported to play an important role in biochemistry4. Among these, acetates, benzoates and salicylates have attracted considerable interest from structural and biological viewpoints5, 6. Structural diversity observed in metal carboxylates has significant influence of the preparation route on the structure of the final product7.
In view of the biochemical activity of transition metal carboxylates is influenced by the molecular structure and coordination status of the metal ion8,9, synthesis of transition metal chelates of 2-[(2,6-Dichlorophenyl)amino]benzene acetic acid (DAPA)(fig.1.) would be beneficial.
 |
Figure 1: 2-[(2, 6-Dichlorophenyl) amino] benzene acetic acid (DAPA) Click here to View figure |
Synthesis of metal chelates
Calculated amounts of metal chlorides and ligand DAPA were separately dissolved in ethanol to obtain 0.1M solutions and then clear solutions were mixed in stoichiometric amounts. PH of the mixture was adjusted 6.0 to 7.0 by adding ammonia buffer and resultant mixtures were refluxed on water bath for about 1 to 2 and half hours and allowed to cool. Solid mass separated at the end was separated after digestion, washed with water and ethanol, dried and stored.
Results and Discussion
Physico-chemical analysis: – Complexes are sparingly soluble in DMSO/DMF, solvents, have high thermal stability at normal conditions11. Molar conductivity recorded in DMSO (Λm 6.3 to 7.2 Ω-1cm2) is too low to account for dissociation reveals non electrolytic nature12. Magnetic moments (table.1) in the range 1.7 to 4.9 B.M. indicate square planar environment around copper and octahedral environment around cobalt and chromium complexes.
Table 1: Physico-chemical of TBPD metal complexes
|
compound |
% C Cal (obs) |
% H Cal (obs) |
% N Cal (obs) |
%M Cal/ (obs) |
Cl % |
Magnetic moments µ B.M. |
Molar conductivity Λm Ω-1cm2 |
Transitions observed |
|
DAPA |
56.78 |
3.74 |
4.73 |
— |
—- |
— |
— |
π → π* Transition |
|
[Cr(DAPA)(H2O)2.Cl]Cl |
40.17 (40.98) |
3.37 (2.38) |
3.35 (3.40) |
12.42 (14.82) |
— |
3.91 |
6.3 |
Charge transfer4T1g (F) → 4T1g 4T2g→4A2g transitions |
|
[Co(DAPA) l(H2O)2] |
39.51 (40.7) |
3.32 (3.18) |
3.29 (3.40) |
13.85 (13.80) |
7.8 |
4.92 |
6.3 |
Charge transfer4T1g (F) →4A2g 4T1g(F)→4T1g(P)transitions |
|
Cu(DAPA)Cl ] 2H2O |
38.96 (39.88) |
2.55 (2.08) |
3.24 (4.17) |
14.7 (13.83) |
— |
1.77 |
7.2 |
Charge transfer2B1g→2A2g and2B1g→2Eg transitions |
Electronic spectra
Ligand DAPA exhibits strong absorption band in the range of 48780 to 49751cm-1 and a sharp peak at 32468cm-1 because of intramolecular charge transfer n→π, π→π* within the ligand molecule. Electronic spectra of complexes under study exhibit new bands that do not resemble with free ligand support complex formation. In chromium complex, absorption bands at 25641cm-1 and 15625cm-1 and 17241cm-1 are assignable to 4T1g(F)→4T1g , 4T2g→4A2g transitions 13,14 , in cobalt complex bands at 20833cm-1, 15625 Cm-1 and 12500cm-1 assigned to 4T1g (F) →4A2g, 4T1g(F)→4T1g(P) transitions15-19. In copper complex absorption at 14925cm-1 is assignable to 2B1g→2A2g and 2B1g→2Eg transitions, 20, 21, Shifts in absorption bands, appearance of new bands and increase in molar absorptivity infer the involvement of metals in bonding with ligand.
Infra red spectra
ligand DAPA exhibits strong symmetric stretching at 3434 cm-1 due carboxylic, ν OH asymmetric stretching at 3232cm-1 for υNH, at 1629 cm-1 for υC=0, at 1287cm-1 for υC-N and at 1069 cm -1 υC-N (ring) 22-24. On complexation, ν OH has been shifted to higher or lower wave number region and turned weak. υNH has disappeared, υC=0 and υC-N have shifted to lower wave number. Deprotonation of –NH moiety due to involvement in coordination25, bonding of acetate group via ketone26-28 may be responsible for observed shifts. This has been supported by the appearance of new vibrations υM-O and υM-N that are absent in free ligand29-31. In copper complex bands at (υM-O) 528cm-1 and (υM-N) 509cm-1 have appeared. In cobalt complex shift in wave length can be observed, the strong NH stretching at 3232cm-1 has disappeared in cobalt and chromium complexes suggesting that the ligand has coordinated to metal through secondary amine and carboxylic acid groups. This has been evidenced by the appearance new bands υM-O and υM-N at 544cm-1, 510cm-1, in cobalt and at 518cm-1and 466cm-1, in chromium complex. Thus ligand DAPA exhibits binegative tridentate behavior and coordinates to the metal through secondary amine, chloride and carboxylic acid group. Significant changes of wave numbers involved in coordination of ligand DAPA and metal complexes are shown in table 2.
Table 2: Significant IR wave numbers involved in coordination of DAPA complexes.
|
compound |
V O-H (sym) cm-1 |
V NH (asy) cm-1 |
V C=O cm-1 |
V C-N bend cm-1 |
V C-N (ring) cm-1 |
V M-O |
VM-N |
|
DAPA |
3434 |
3232 |
1629 |
1287 |
1069 |
— |
— |
|
[Cr(DAPA)(H2O)2.Cl]Cl |
3413 |
— |
1631 |
1394 |
1111 |
518 |
466 |
|
[Co(DAPA) Cl(H2O)] |
3435 |
— |
1577 |
1284 |
1047 |
544 |
510 |
|
[Cu(DAPA)Cl ] 2H2O |
3536 |
3437 |
1577 |
1283 |
1093 |
528 |
509 |
1HNMR spectra
1HNMR spectrum of ligand shows peaks at δ 2.08 ppm corresponding to methyl proton, at δ 6.40 ppm due to Ar-C=O and at δ 4.0 ppm for Ar-NH. On complexation signals due to Ar-NH and methine proton have disappeared32-34 and peak corresponding to Ar-H has been shifted to deshielded region35. Disappearance of peak for Ar-NH may be due to change in –NH moiety on involvement in bonding with metals to form complexes. Involvement of acetate group in bonding may be the reason for disappearance of methyl peak and shifting of Ar-H signal to the deshielded region. Besides this small peaks corresponding to coordinated water in chromium and cobalt complexes were observed at δ 2.0 ppm36.
EPR Spectra
In chromium and cobalt complexes Sharp peaks indicate negligible distortion33 where as broad signal in copper complex reveals distorted environment. Chromium complex (Fig2.) with a maximum at 3000 gauss suggests antistrophic nature, broadening of peak reveals distorted geometry of the complex. Presence of water molecules in coordination can induce distortions and broadening of spectral lines are expected. Gyrometric ratio ‘g’ is a function of covalancy, if it is greater than 2.3, metal is in ionic environment and if it is less than 2.3 metal ions will be predominantly in covalent atmosphere39, 40. g∏ g(table3)are found to be 1.844 and 1.850 and ‘G’ the exchange interaction coupling constant is 1.04 suggests strong exchange interactions. g∏ g and lower gav values suggests covalent nature of the tetragonally elongated metal ligand bond and probability of unpaired electron being occupied in dx2-y2 orbital37, 38.cobalt complex exhibits a peak around 3600 gauss on negative side having very low ‘g’ value. However this peak is not well resolved and isotropic or anisotropic nature can not be specified, Copper complex exhibits a sharp anisotropic peak at around 3350 Gauss on positive side with. ‘g’ = 1.855 and e/gm = 1052 x 1021.
Table 3: EPR parameters for ligand DAPA and metal complexes.
|
complex |
gyrometic ratio |
A (gauss) |
exchange interaction coupling constant G |
electrons per gram e/gm X 10 21 |
|
[Cr(DAPA)(H2O)2.Cl]
|
g 1.844 g 1.850 gAv 1.848 |
A 150 A 100 Aiso 116 |
1.040 |
1.41 |
|
[Co(DAPA) Cl(H2O)2 ] |
g 1.743 |
—– |
— |
1.49 |
|
[Cu(DAPA)Cl ] 2H2O ] |
g 1.855 |
—– |
—- |
1.43 |
![Figure.2: EPR spectrum of complex [Cr(DAPA)(H2O)2.Cl]Cl](http://www.orientjchem.org/wp-content/uploads/2012/12/Vol28No3_TRAN_DILI_fig2-150x150.jpg) |
Figure.2: EPR spectrum of complex [Cr(DAPA)(H2O)2.Cl]Cl
|
Thermal analysis
In chromium complex (Fig 3.6) gradual and steady decomposition of the complex exothermically in the range of 50 to 6250C is observed. Decomposition seems to be activated at 3410C converting the complex into metal oxide residue at above 6250C. The amount of chromium observed in residue (14.82%) is in agreement with that of calculated (14.42%).Cobalt complex decomposed in four steps of which two are endothermic while other two are exothermic. Lattice water eliminated at around 1100C. Chlorides might be removed at above 2000C exothermically, while benzyl part seems to be expelled out from the complex at around 3000C. Decomposition completes at about 8000C leaving residue of cobalt oxide as end product. Mass of cobalt in residue as observed in TG (13.8%) is in close agreement with calculated value (13.85%). The Cu(DAPA) complex shows three peaks , first one is corresponding to exothermic removal of water molecules at 1100C and other two at 2000C and 5300C due to partial decomposition of ligand molecule. Complex is completely decomposed at a temperature of 6300C leaving the residue of copper oxide. Calculated mass of Cu (14.7%) is in resemblance with observed mass of Cu in residue observed (13.83%).
Thermal data of the complexes are subjected to analysis for non isothermal kinetic parameters (Table 4.) as per Coats Redfern equation43. In chromium complex first step differ from remaining three and in general, decomposition of complex followed first order kinetics while Cobalt and copper complexes reveal second order kinetics. Change in entropy and free energy values are nearly same in all the three steps suggesting that the activated complex has more ordered structure44. Frequency factors are as usual abnormal indicating that decomposition process is slow45. Order of reaction suggests second order kinetics and decomposition of complexes at elevated temperature is a complex process46. Energy of activation reveals stability of DAPA complexes in the order as Cu (II) > Co (II) > Cr (III) 47.
Table 4: Thermal decomposition and kinetic parameters of complexes
|
complex |
DTA peak 0C |
Temp Range 0C |
Order of reaction n |
Activation energy Ea KJ/Mole |
Entropy change ∆s J/K/Mole |
free energy of activation G KJ/Mole |
Frequency factor Z /S |
|
[Cr(DAPA)(H2O)2.Cl]Cl |
341.15(+) |
50 -625 |
1 |
9.36 |
-269.46 |
36.85 |
0.1494 |
|
[Co(DAPA) Cl(H2O)2] |
106.41(-) |
30-110 |
2 |
22.88 |
-204.67 |
150.47 |
2.09 |
|
200(+) |
110-265 |
1 |
27.19 |
-221.72 |
39.82 |
25.826 |
|
|
300 (+) |
265-555 |
1 |
13.96 |
-254.07 |
32.84 |
0.3936 |
|
|
815(-) |
555-850 |
1 |
12.50 |
-296.11 |
51.42 |
0.0078 |
|
|
[Cu(DAPA)Cl ] 2H2O |
110 (+) |
50-155 |
2 |
11.15 |
-270.8 |
24.27 |
0.0605 |
|
200(-) |
155-250 |
2 |
38.35 |
-217.96 |
40.75 |
40.82 |
|
|
530(-) |
250-630 |
1 |
44.93 |
-330.67 |
74.48 |
8.33 |
![Figure3: (a) [Cr(DAPA)(H2O)2.Cl]Cl, (b) Co(DAPA) Cl(H2O)2], (c) [Cu(DAPA)Cl ] 2H2O](http://www.orientjchem.org/wp-content/uploads/2012/12/Vol28No3_TRAN_DILI_fig31-150x150.jpg) |
Figure3: (a) [Cr(DAPA)(H2O)2.Cl]Cl, (b) Co(DAPA) Cl(H2O)2], (c) [Cu(DAPA)Cl ] 2H2O |
X-Ray analysis
powder X-ray diffraction diffractions of the complexes are obtained from D8 advance X-ray spectrophotometer using Cukα radiation source at a wavelength of 1.5407 A0 within the 2θ range of 10 to 900 at a room temperature. The interplanar distance‘d’ is then obtained from major refluxes. Independent indexing, calculation of miller indices and evaluation of lattice parameters is followed by powder X computer programme. Unit cell volume and percent porosity of the complexes is then calculated by standard formulae48, 49. Analysis revealed tetragonal crystal system for copper where as monoclinic lattice for cobalt and chromium complexes with ‘p’ type lattice.
Chromium complex reveals lattice parameters a =18.10, b = 2.74 and c = 10.5 A0 and α=ν=90, β=105.450, unit cell volume and percent porosity are found to be 506.26 cm3 and 2.37. Cobalt complex exhibited maximum at 46.3 with‘d’ equal to 1.946A0 having lattice parameters a = γ = 900 and β = 1000 where as a = 12.61, b = 5.05 and c = 8.15 A0, values of unit cell volume and percent porosity calculated to be 511.73cm3 and 5.946. In copper complex maxima is obtained at 550 with‘d’ equal to 0.9327 A0. The lattice parameters α=β=ν=900 and a=b=7.795 c = 5.401A0. Unit cell volume and percent porosity are 328.63 cm3 and 6.632.
Microbial activity
Antimicrobial activity of the metal complexes increases compared to complexing ligands. This increase in antimicrobial activity of the metal complexes is reported to be due to Overtone’s concept and chelate effect9. Bidentate ligands containing nitrogen donor atom have shown higher microbial activity compared to monodentate nitrogen donor ligands10. Antimicrobial activity also found to change with nature of ligands, total number of charges on the complex, (decrease in the order cationic > neutral > anionic complexes) nature of ion neutralizing complex ion, nuclearity of the metal centre in the complex11. Bimetallic complexes are usually seen to be more active as compared to monometallic complexes12.
Lipid membrane that surrounds the cell micro-organisms favors the passage of only lipid soluble materials. Thus lipid solubility is an important factor to control antimicrobial activity. Movement of charged metal ions into the cell is hindered by non polar lipid membranes where as on chelation polarity of the metal ion is reduced which in turn increases lipid solubility. This increased lipid solubility will enhance the penetration of the metal chelates into membrane and interact with cellular compounds thereby blocking the normal cell process. Metal chelates that are lipid soluble and interact will cellular compounds exhibit antimicrobial activity13. Ligands containing oxygen, nitrogen, and/or sulphur are reported to increase lipid solubility on complexation. Chloro complexes generally found to exhibit strong antimicrobial activity over other complexes14.Results of the antibacterial study (table5) revealed that metal complexes exhibit strong inhibition activities. Inhibition zones produced by these complexes were found to be larger than that control and ligand.
Table 5: Antibacterial activity of DAPA metal chelates
|
sample |
E. Coli
|
S. typhi |
S. aureus |
B. subtilis |
||||
|
|
inhibition zone in mm |
Activity index |
inhibition zone in mm |
Activity index |
inhibition zone in mm |
Activity index |
inhibition zone in mm |
Activity index |
|
DAPA |
14 |
127 |
18 |
112 |
14 |
116 |
32 |
114 |
|
CuDAPA |
20 |
181 |
20 |
125 |
18 |
150 |
34 |
121 |
|
CrDAPA |
23 |
209 |
26 |
162 |
22 |
183 |
39 |
139 |
|
coDAPA |
16 |
145 |
20 |
125 |
16 |
133 |
32 |
114 |
|
control |
11 |
— |
16 |
— |
12 |
— |
28 |
— |
|
penicillin |
-ve |
— |
-ve |
— |
-ve |
— |
-ve |
— |
Summary and Conclusion
The ligand DAPA forms thermally stable six member metal chelates with transition metals with distorted geometries, and behaves as a bi negative tridentate in nature. Electronic transitions support square planar geometry for copper and octahedral geometry for cobalt and chromium complexes.1H NMR spectra suggests involvement amine group and acetate group in coordination and also inferred by IR spectra. Further, appearance of υM-O and υM-N stretching vibrations confirms involvement of amine and acetate groups in coordination. ESR spectra indicated anisotropic behavior suggesting that the line width are independent of temperature, Exchange interaction coupling constants support strong exchange interactions and local tetragonal axes are misaligned.
TG/DTA support presence of coordinated water and kinetic parameters indicate decomposition process follow in general first or second order kinetics and activated complex has more ordered structure. Stability of the complexes decreases in the order as Cu (II)> Co (II)> Cr (III). Based on the results of elemental analysis, thermal results and spectroscopic studies following structures (Fig 4) are proposed to the complexes under study.
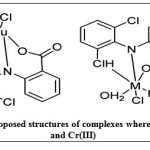 |
Figure 4: proposed structures of complexes where M = Co(II) and Cr(III) Click here to View figure |
 
References
- Annamaria Erdelyiova, Katarina Gyoryova, Robert guepes, Ladislav Halas,Jana Kovarova.; polyhedron Vol.28 ,2009,131-137.
- .Dendrinouamara,D.,Tsotsou,G., Ekateriniadou,L.V. Kortsaris,A.H., Raptopoulou,C.P.Terzis,A., Kyriakiis.D.A.,;J.Inorg.Biochem.71. (1998) 171.
- Shahazadi,S.,Ali,S., Jabeen,S., Kanwal,N., Rafique,U and Khan, N.; Rassian J. coord. Chem.Vol.34 (1), 2008, 38-43.
- Eremenko,I.G., Nefedov,S.E., Sidorov,A.A. et al , Inorg. Chem. Vol.38. (1999) pp3764.
- Zhu,L.G.Kitagava,S., Miyasaka,H.and Cheng H.C.,;Inorg. Chim. Acta. vol 355.(2003) pp.121.
- Lemione, P.,Vissoy.B.,Morgant.G, et al .J. Inorg. Biochem. vol.89. (2003), pp.18.
- Amerreza Azadmehar, Mostafa M.Amini,Nasser Hadipour, Hamid Reza Khavasi, Hoong-Kun-Fun and Chun-Jung-Chen.; Appl. Organometal. Chem. Vol. 22, 2008.pp 19-24.
- Molloy, K.C., Prucell,T.G., Hahn,E.,Suchmann H., Zukerman,J.J. Organometallic.Vol.5 (1986),pp 85.
- Holomes, R.R Acc. Chem Res.Vol.22 (1989), p.190.
- Handbook of Pharmaceutical chemicals.p.57.
- Vogel A.I.Textbook of Inorganic analysis.Vth edition (1996) ELBS.London.
- Geary, W. J .coord. Chem. Rev. Vol.7 (1971) p. 81
- Gayatri Kumari, Shanu Paliwal and Rajesh Dhakarey. J. Indian council of chemists. Vol.25 (2) 2008.p.82
- Datta, R.L. and Shyamal A., Elements of Magneto chemistry.2nd edition New age (press) 1992.p.82.
- Gupta,A.K., and Krishna kumar;J. Indian council of chemists. Vol.24 (2) 2007, p.46.
- Carlin, R.L. and Van A.J., Dryneveledt.Magnetic properties of transition metal compounds. Springer, New York.1997.

This work is licensed under a Creative Commons Attribution 4.0 International License.
![]()
A New Edition of Web of Science
Journal Impact Factor
2022: 0.5
Five Year: 0.8
Journal is Indexed in

Cabells Whitelist
![]()


