Penicillamine: Determination, Spectral and Antibacterial Studies as its Ru (III) Complex
Download this article as:
![]()
A spectrophotometric method has been developed for the determination of penicillamine, using Ru (III) as complexing reagent .The complex formed gives a maximum absorbance at 545 nm resulting in an orange coloured stable complex formed within 20 minutes with molar absorption coefficient 2.1× 10⁴ L mol-1 cm-1. The complex obeys Beer‘s law in the range of 0.099 ppm to 1.399 ppm. Stoichiometry of the complex is confirmed by Mole ratio method as well as Job‘s method of continuous variance and M: L (metal: ligand) ratio was found to be 1:2.In addition, on the basis of Elemental analysis, FTIR, H1 NMR ESR, RAMAN spectral data a plausible structure of mononuclear Ru (III) complex of penicillamine {Ru PAM2 (H2O} has been reported. Thus confirming the bonding of Ru (III) ion with sulphydryl and amino group of penicillamine.The formed complex was further screened for the antibacterial activity against several bacteria and the results are compared with the activity of penicillamine.
KEYWORDS:Penicillamine; Spectrophotometric; Antibacterial and ruthenium (III) chloride
Introduction
The Importance Of Penicillamine (PAM) Is Due To Its Widespread And Different Pharmacological Effects. Penicillamine (D-3, 3 Dimethyl Cysteine) (Figure 1) Is Used For Treatment Of Rheumatoid Arthritis, In Pb Poisoning As Chelating Agent. The Ability Of D-Penicillamine To Act As Chelating Agent In Therapeutic Treatment Of Wilson’s Disease And Mercury Poison Has Been Extensively Investigated 1–2, And The Stability Constants For Bivalent Metals Were Reported And Calculated From Ph Values Using Known Mathematical Relations And Computer Programming 3.
 |
figure 1: Structure of Penicillmaine |
The molecule of penicillamine exist in zwitter ionic form, with three functional groups (NH2, S and COO–). This molecule usually forms bidentate complexes by coordination of N and S atoms but the possibility of forming monodentate (S) 4 tridentate (N, O, S) or tetra dentate (N, O, O, S) 5 complexes have been reported. The sulfur, nitrogen or oxygen atoms can also act as a bridge between two or more metallic atoms.
Penicillamine is an active ligand and easily forms complexes with transition metals. Some of its complex have been reported with mercury (II) in acidic and neutral condition 6, with Pd (II) and Pt (II) 7, Cu (I), Cu (II) 8 Pb (CH3COO)2, and NiSO4 9 . However, its complexation has been exploited for reducing the nephrotoxicity 10 with Pt antitumor drugs.
The published methods reported for the determination of penicillamine include titrimetry 11–13, spectrophotometry 14–16, fluorometry 17-18, electro-analysis 19–21 and chromatography 22–24. Spectrophotometric method for the determination of penicillamine in dosage forms using 2, 6-dichloroquinone-4-chlorimide 14 Beer’s Law plot showed good correlation (r 0.9998) and the calibration graph was rectilinear over the range 4–20 mgmL-1 with a detection limit of 0.15 mgmL-1. The average recovery for the commercial capsules was 101.66% with an RSD of 1.57%. Colorimetric analysis of penicillamine based on Cu (II) complex formation was reported with absorption maxima of 522 nm (obtained after 30 minutes) 25.
The use of ruthenium (III) chloride as a complexing agent for the quantitation of drugs is fairly wide. The chelate complex of ruthenium (III) ion bears the advantage of being water soluble, and hence does not necessitate any extraction procedure. Several drugs were determined spectrophotometrically by measuring the color intensity of the complex formed between their molecules and ruthenium (III) ions, e.g. ketoconazole and clotrimazole 26.
Some published methods suffer interference from tablets base, while others are not simple for routine analysis as they need sophisticated instruments and expensive reagents, not yet available in many control laboratories. Therefore, it was considered worthwhile to develop a rapid, simple and accurate procedure suitable for application in quality control laboratories.
The present paper reports a simple, sensitive and accurate spectrophotometric method for the determination of penicillamine. The proposed method is based on the reaction between the investigated drugs and ruthenium (III) with the formation of an orange colored complex. The optimum conditions (volume of reagent, pH etc) were established before the application of the method for the analysis of drugs as bulk or in different pharmaceutical preparations. The composition as well as the stability constant of the complex was also investigated and characterization of the complex was done by Elemental Analysis, FTIR, 1HNMR, ESR and Raman on the basis of following equation. Other advantages of the method are cheapness and prediction of its binding sites confirming the formation of complex.
NH2
H2O
2CHC (CH3) 2 – SH + RuCl3 {Ru- [S- (CH3) 2 CHC- NHCOOH] 2 (H2O) 2}
.2Cl. HCl
COOH
(Penicillamine) (Penicillamine: RuCl3 Complex)
Scheme 1: Reaction of Penicillamine with Ru (III)
Similar complexes of Ru (III) chloride have been reported by Orioli et al 27 for thiopyrimidines and its derivatives 6-thiopurine riboside, and 2-thio-1, 3 pyrimidine which are investigated for their antiviral potentials as well as for photochemical properties that can be brought to design photodynamic therapies 28.
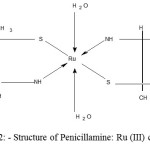 |
Figure 2: Structure of Penicillamine: Ru (III) complex |
Experimental
Apparatus
A Helios Ð Model Digital Spectrophotometer Provided With 1 Cm Quartz Cells Was Used For Absorbance Measurement.Elemental Analyses Were Carried Out In Thermo Finnigan CHNS Analyser. The FTIR Spectra Were Recorded In Nicolet FTIR Spectrophotometer In The Range 4000-400 Cm-1 Using Kbr Pellets.1HNMR Spectra Were Recorded In Varian 300 Mhz Using Deuterium Oxide As Solvent.ESR Spectra Were Recorded In Varian Spectrometer In The Scan Range Of 3000 Gauss Using Tetracyanoethylene As Marker.Laser Raman Spectra Were Recorded By Ramanor HG 25 Using Argon Laser (488nm) As A Source Of Irradiation.
Antibacterial activity test
In vitro antibacterial activities of penicillamine and its complex were tested using the paper disc diffusion method 38. The chosen strains were G (+) Staphylococcus aureus and G (-) Proteus mirabilis, Shigella sonnei, Salmonella enteritidis, Pseudomonas aeruginosa and Escherichia coli. The liquid medium containing the bacterial subcultures was autoclaved for 20 minutes at 121oC, at 151 lb pressure before inoculation. The bacteria were then cultured for 24 h at 36oC in an incubator .Muller-Hinton broth was used for preparing basal media for the bioassay of the organisms. Nutrient agar was poured onto a plate and allowed to solidify. The test compound (in methanol) was added dropwise to a 10 mm diameter filter paper disc placed at the centre of the agar plate. The plate is maintained at 5oC for 1 h then transferred to an incubator maintained at 36o C. The width of the growth inhibition zone around the disc was measured after 24 h incubation. Four replicas were made for each treatment.
Reagents and Chemical
All reagents used were of analytical reagent grade and the water was always double distilled obtained from Millipore.
Preparation of Penicillamine Standard Solution and its formulations
Penicillamine was kindly offered by Alembic Pharmaceutical Industry, India. The purity of the drug was determined by applying the official method 9. Stock solutions of the studied drug were prepared by dissolving 100.0 mg of the drug in 100 mL of double distilled water. Other concentrations were prepared by diluting with double distilled water.
Formulations containing 25 mg and 150 mg penicillamine were purchased from local commercial sources. Stock standard solution containing 0.005 M was prepared by dissolving the weighed amount of penicillamine in deionized water and stored in refrigerator. Standardization of the stock solution of pharmaceutical samples was done by using KIO3 solution 29.
Preparation of Ruthenium (III) chloride
Hydrated ruthenium trichloride was purchased from Johnson and Matthew Co. Standard stock solution was prepared by dissolving 1g of hydrated ruthenium (III) chloride in 2 M HCl and volume is made up to 1 L. Standardization was carried out gravimetrically by dithioxamide 30. Solutions of lower concentrations were prepared by approximately diluting aliquots of stock solution.
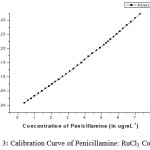 |
figure 3: Calibration Curve of Penicillamine: RuCl3 Complex |
Procedure
Preparation of Complex
The complex was prepared by adding excess of penicillamine solution (7.12×10⁻⁴ M) to an equimolar solution of Ru (III) (7.49×10⁻⁴ M) taken in a flask and the contents are allowed to react for a period of 20 minutes at room temperature. The absorbance was measured against a reagent blank prepared simultaneously at the specific λmax (Table 1). A Beer Lambert’s law graph for penicillamine and Ru (III) complex was prepared by recording and plotting the absorbance value of the concentrations of a series of penicillamine solutions of known concentration at 545 nm, which is the lmax of the complex.The solid complex is prepared by evaporating the content of the complex formed. The solid sample was further purified by forming its crystallization.
Table 1: Collective data of the studied compound by complexometry
|
Conditions |
Penicillamine: RuCl3
|
|
Optimum pH Volume of Metal solution Wavelength (λ max) Concentration range (µg/ml) έRegression Equation * Y = a + b X Slope Intercept Correlation Coefficient Molar ratio (M: L (drug)) Detection limit |
Neutral 2.0 mL 545nm 0.005 – 0.1 2.1 x 10 4
Y=0.01024+0.1379X 0.1379 0.01024 0.9965 1:2 0.58 |
* Y: absorbance; a: intercept; X: Concentration (μgmL-1); b: slope
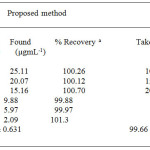 |
table 1:Determination of penicillamine by Ru (III) chloride |
a Each result is the average of three separate experiments
Procedure for the dosage forms
An accurately weighed quantity of the mixed contents of 10 capsules equivalent to 100 mg of the drug was transferred into a 100 mL volumetric flask and the volume was made up to the mark with double distilled water. The contents of the flask was sonicated for 5 minutes and filtered if necessary and above procedure was followed for complex formation. The nominal content was calculated either from a previously plotted calibration graph or using the corresponding regression equation.
Results and discussion
Penicillamine possesses a sulphur atom, which reacts with metal ions forming stable complexes. Determination of penicillamine in the pharmaceutical drugs by complexation with a large number of metal ions such as Co+2, Ni+2 and Pb+2, Zn+2, Mn+2 has already been reported 31. All used metals for penicillamine were proved to be equally satisfactory but complexation with Ru+3 ion was more sensitivity, detection limit, quantification limit and A% of the formed complex was more as compared to the reported methods (Table 3).
 |
Table 2:Comparison of results from the proposed method with those from other spectrophotometric methods for the determination of penicillamine in pharmaceutical formulations |
a Each result is the average of three separate experiments
Optimization of the reaction conditions
UV-Visible Spectra of Penicillamine and its Ru (III) complex
Penicillamine has maximum absorbance at 215 nm in aqueous solution, on addition of RuCl3, two maxima are obtained one at 310 nm and other at 545 nm, whereas the latter wavelength has maximum absorbance (Figures. 4–5).
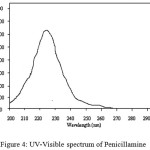 |
Figure 4: UV-Visible spectrum of Penicillamine |
 |
figure 5: UV-Visible spectrum of Penicillamine: Ru (III) complex |
Effect of pH
The reaction between a series of penicillamine and the Ru (III) ion was performed in different media. In acid medium, low sensitivity is noticed, while in alkaline medium, the metal ions are precipitated as hydroxides.Different acidic buffers such as KCl+HCl (pH 1.6-3.5) and phosphate buffer (pH 9.5) do not show any increase in absorbance so room temperature was found to be accurate for the formation of complex.
Effect of metal ion concentration
The required amount of metal ions for maximum absorbance, besides the optimum pH, is summarized in Table 1. Absorbance was found to increase with increase in concentration of metal ion but after certain molar concentration absorbance was found to decrease.
Effect of time on the formation and stability of the formed complexes
The effect of time on the absorbance of drug metal complex was investigated. It was found that the complex formation was instantaneous and the formed complex was stable for more than 1 h.
Composition of the Complex
The M: L stoichiometric ratio of ruthenium (III) chloride: penicillamine in the complex was confirmed by Mole ratio method 32. The curve displayed a maximum when ruthenium concentration (7.12×10⁻⁴M) was kept constant and penicillamine concentration (7.49 x10⁻⁴ M) was varied, and the mole ratio was found to be 1:2. Further Job’s method of continuous variance 33 was also applied and M: L ratio was found to be 1:2.
The stability constants of the complex was calculated according to the equation34
Kf = A/Am
![]() Cn nn
Cn nn
[(1-A)/Am ]n-1
where A and Am are absorbance and maximum absorbance obtained from Job’s continuous variation curves; n = ratio between drug to metal; C = molar concentration of the drug; Kf = stability formation of the complex.
The stability constant of penicillamine with the Ru (III) ion is 2.54 x 10⁴.
Applications
By adjusting the optimum conditions required for the reaction between penicillamine with the Ru (III) metal ion, rectilinear calibration graph was obtained in the concentration range, limit of detection, regression equation and molar ratio are tabulated in Table 1. Calibration graph is shown inFigure 3the % recoveries of the studied drug was compared with those obtained by the former reported methods 11 are given in Tables 2, 4. Statistical analysis carried out between the results of proposed and official methods 11 are given in Tables 2 which shows no significant difference between the two procedures regarding accuracy and precision. The proposed method was successfully applied for the determination of the studied drugs in their different dosage forms, as shown Table 4, and the results obtained were compared by the reference methods 11, 12. The latter methods recommend spectrophotometric method for determination of penicillamine in their dosage forms and there is no significant difference between the two procedures regarding accuracy and precision. The complex formed as a reaction product was characterized by following spectral data.
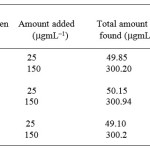 |
Table 3: Determination of Penicillamine via penicillin in dosage forms by the standard addition method |
a The results are the average of 6–separate determinations
Cipla Pvt ltd, India
Panacea pvt ltd India
Arvind Remedies, India
Characterization of the Penicillamine:Ru (III) Complex
Elemental Analysis
The % of carbon, hydrogen and nitrogen was determined by elemental analysis and was found to be 27.22%, 4.76%, and 4.78%, which was very much similar to the calculated value.Thus confirming the molecular structure of Penicillamine:Ru (III) complex as {C10 H18 N2 S2 O4 Ru (H2O) 2}. Cl .2HCl.
FTIR Data of the Complex
The FTIR spectrum of penicillamine (Figure 6) and its complex have been assigned mainly for those specific frequencies, which are directly involved in complex formation. The sulphydryl group stretch band appears at 2519 cm-1 in the spectrum of penicillamine while it is missing in the spectrum of the complex. A medium intensity band due to NH2 group appears at 3236 cm-1 is found to be shifted to 3100 cm-1 in the spectrum of complex. All this suggests that, coordination of the ligand with metal ion occurs through the sulphur atom and nitrogen atom. Further a small band at 564 cm-1,corresponding to the C-S stretch is shifted to lower wave number after complexation with Ru (III) ion(Figure 7) thus indicating coordination through the thione group. Similarly C-N stretching band at 1354 cm-1 is shifted to 1380 cm-1 in the spectrum of complex.
 |
figure 6: FTIR Spectrum of Penicillamine |
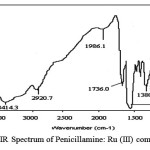 |
figure 7: FTIR Spectrum of Penicillamine: Ru (III) complex. |
The carboxylate bands namely, (C=O) str, (-OH) bending, (COOH) antisymmetric, (-COOH) symmetric stretch arise formely at 1050 cm-1, 1156 cm-1, 1400 cm-1 and 1610 cm-1 shows a slight shifting to 1051 cm-1, 1150 cm-1, 1410 cm-1, 1617 cm-1 in the penicillamine: Ru complex spectrum. A broad diffuse band of medium intensity at 3414 cm-1 may be assigned to the OH stretching vibration for the lattice water similar broad diffuse band has been reported by Anacona et al 35. Thus confirming the presence of water molecule attached to the metal ion through coordinate bond. A medium intensity band at 450 cm–1 is due to Ru-N stretching which is quite prevalent in coordination compounds like ruthenium: xylenol complex 36.The intensity of M-N bond also predicts the ionic character of the bond if the intensity of M—N bond and have lower stretching frequency then it is more ionic in nature 37
Proton NMR Studies of Complex
1HNMR spectrum of penicillamine (Figure 8) shows a peak at 1.47 ppm assigned to CH3 protons, which shows a slight shifting of 1.47 ppm peaks in complex spectrum. A sharp peak at 1.2 ppm in the spectrum of the penicillamine get reduced to half in case of complex spectrum showing the binding of sulphydryl with the metal ion (M-S) bond.A sharp peak at 4.77 ppm is assigned to the impurity of water in D2O, which is found in both the spectrum. As solvent used is D2O, which involve rapid exchange of SH, and NH protons with deuterium and simplifying the spectrum thus it is easier to predict the presence of protons as well as confirm the binding of M-N and M-S. A multiplet appears at 3.93 ppm in penicillamine spectrum which completely disappears and exists in the form of singlet in the spectrum of complex this is assigned to the –NH2 group the reduction in the peak is mainly due to the deprotonation of primary amino group to secondary amino group while undergoing coordination with Ru (III) ion (Figure 9).
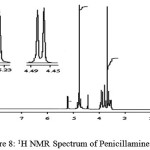 |
figure 8: 1H NMR Spectrum of Penicillamine Click here to View figure |
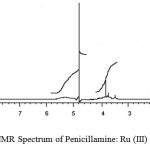 |
figure9:1H NMR Spectrum of Penicillamine: Ru (III) Complex Click here to View figure |
ESR Studies of the Complex
Electron Spin Resonance spectrum of penicillamine (Figure 10) and its Ru (III) (Figure 11) complex was recorded at liquid nitrogen temperature and it exhibits the following features.
 |
figure 10: ESR Spectrum of Penicillamine Click here to View figure |
 |
figure 11: ESR spectrum of Penicillamine: Ru (III) complex Click here to View figure |
A, Calculation of g (Lande`s Splitting Factor)
![]() g Sample = g Stan ( 1 – LH )
g Sample = g Stan ( 1 – LH )
H
Where
LH = Width between deflection points on the derivative absorption curve
H = Magnetic field
g Stan = Lande`s Factor for free electron
= 2.0023(1- 0.013939)
= 2.0023 x 0.8608
g Sample = 1.7231
Total Number of ESR Signals for ML2 Complex.
1, Nitrogen as donor atom (I 1 = 1)
(2 x n x I1 + 1) = (2 x 2 x 1 + 1) = 5.
2, Sulphur as donor atom (I2 = 0)
(2 x n x I2 + 1) = (2 x 2 x 0 + 1) = 1.
3, Oxygen as donor atom (I3 = 0)
(2 x n x I3 +1 = (2 x 2 x 0 + 1) = 1
Total numbers of ESR Signals are.
(2 x n x I1 + 1) x (2 x n x I2 + 1) x (2 x n x I3 +1)
5 x 1 x 1 = 5
These five resonance peaks are observed in the ESR spectrum of Ru (III): penicillamine complex confirming the presence of two penicillamine molecules in the complex.Lower value of g obtained for the complex shows its covalent nature, owing to d5 electronic configuration, Ru (III) forms low spin complexes with octahedral geometry.
Laser Raman Studies of the Complex
Raman spectrum of penicillamine (Figure 12) shows band at 333 cm-1 assigned to -SH out of plane deformation, is absent in the spectrum of penicillamine: Ru (III) complex confirming the bonding of sulphydryl group to Ru (III). Raman bands at 592 cm-1, 665 cm-1 assigned to C-SH and C-S stretch respectively are found in penicillamine spectrum which is diminishing in the complex spectrum (Figure 13-14). Wagging band for – NH group appears at 752 cm-1 and 853 cm-1 in the spectrum of penicillamine but found to disappear in the spectrum of Ru (III): penicillamine complex. Presence of COOH in the penicillamine spectrum can also be confirmed by the bands appearing at 869 cm-1. This peak becomes smaller in the spectrum of Ru (III): penicillamine complex showing the presence of uncoordinated – COOH group.For aliphatic -CH group raman stretching frequencies are obtained at 3015 cm-1 and 3024 cm-1 in the penicillamine spectrum, which are shifted to 3174 cm-1 and 3224 cm-1 in the Ru (III) complex.The presence of M—N bond is also confirmed by the presence of two raman active stretching modes A1g at 500 cm–1 and Eg mode at 475 cm-1generally ν A1g is higher than ν Eg one of the useful information obtained from these bands is that complex formed is having octahedral geometry which is the main feature of ruthenium ion 37.From these studies we hereby propose the most plausible structure of Penicillamine: Ru (III) complex as follows.
 |
figure 12: Laser Raman spectrum of penicillamine |
 |
figure 13: Laser Raman spectrum of Penicillamine continued |
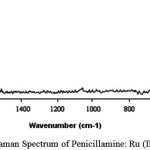 |
figure 14: Laser Raman Spectrum of Penicillamine: Ru (III) Complex |
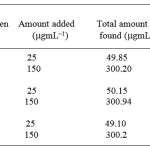 |
Table 4: Determination of Penicillamine via penicillin in dosage forms by the standard addition method Click here to View table |
a The results are the average of 6–separate determinations
Cipla Pvt ltd, India
Panacea pvt ltd India
Arvind Remedies, India
Microbiological screening
The susceptibility of certain strains of bacterium towards penicillamine and its metal complex was judged by measuring the size of inhibition diameter. As assessed by color, the complex remains intact during biological testing. The antibiotic and the complex presented bactericide diameter larger than 20 mm showing that they have a good activity as bactericides 39.The average results are shown in Table 5.
The result showed that the antibacterial activity of metal complex when compared to the parent ligand was found to increase against P.mirabilis, E.coli and P.aeruginosa, whereas metal complex showed less activity against S.aureus and S.enteritidus. This phenomenon is explained on the grounds of chelation theory 40.Chelation reduces the polarity of the metal ion due to partial sharing of its + charge with donor groups and also due to the delocalization of electrons over the whole chelate ring. Thus Chelation increase lipophilic character in the complexes and results in enhancement of activity.
 |
Table 5: Antibacterial activity of penicillamine: Ru (III) complex |
Conclusion
The proposed method is simple, accurate, precise, sensitive, very rapid, low cost and relatively selective compared to the official method. Furthermore, the proposed method does not require elaboration of procedures, which is usually associated with chromatography methods. The proposed method could be applied successfully for screening the antibacterial activity of penicillamine: ruthenium complex in different concentrations.
Acknowledgement
The authors gratefully acknowledges for the instrumentation facility provided by the Sophisticated Analytical Instrumentation Facility (SAIF) Indian Institute of Technology Powai Mumbai, India and Central Drug Research Institute (CDRI) Lucknow India. . Special thanks to Dr Anjana Sharma of bioscience department Rani Durgavati University Jabalpur (M.P) India for providing screening of penicillamine complex for antibacterial activity.
References
- Birker P. J. and Freeman H. C., J. Am. Chem. Soc., 99, 6890(1977).
- Fischer K., Water Air Soil Poll., 137, 267(2002).
- Stypinske-Mis B. and Anderegg G., Anal. Chim. Acta., 406, 325(2000).
- Carty A. J. and Taylor J., J.Chem.Soc.Chem.Comm., 11, 214(1976).
- Muller A. Johannes K. U. Straube M. Kreckemeyer M. and Boge H., Z. Anorg. Allg. Chem., 619, 1037(1993)
- Szalai H. K. and Paal T. L., Talanta., 48,393(1999).
- Cervamtas G. Moreno V. Molins E. and Quiros M., Polyhedron., 17, 3343(1998)
- Kato N. Nakamura M. and Vchiyama T., J.Inorg.Biochem., 23, 117(1999).
- Walash M. I. Brashy A. M. El. Metwally M. E. S. and Abdelal A. A., Il.Farmaco., 59, 493(2004).
- Slater T. F. Ahmed M. and Ibrahim S. A., J.Clin.Hematoncol., 7, 534(1977).
- British Pharmacopoeia, Her Majesty’s Stationary Office, London., (1995).
- The United States Pharmacopoeia XXII, National Formulary XVII, USP convention Inc, Rockville, MD (2000).
- Risk M. S. and Zakhari N.A., Il Farmaco., 41, 75(1986).
- Majed A. A. Al., J. Pharm. Biomed. Anal., 21, 827(1999).
- Issopoulos P. B. and Economou P. T., Anal. Chim. Acta., 257, 203(1992).
- Raggi M. A. Cavrini V. and Pietra A. M. Di., J. Pharm. Sci., 71, 1384(1982).
- Majed A. A. Al., Anal. Chim. Acta., 408, 169(2000).
- Ghannam M. Al. Brashy A. M. El. and Farhan B. S. Al., Il Farmaco., 57, 625(2002).
- Zhang X. J. Yuliya-kislyak J. L. Dickson A. L. and Cardosa M. B., Electro Chem. Commun., 4, 11(2002).
- Tiwari B. B., Rev. Anal. Chem., 20, 303(2001).
- Forsman U., J.Electroanal. Chem. Interfacial Electrochem., 152, 241(1983).
- Williams M. L. and Wainer I. W., Ther.Drug. Monit., 24, 290(2002).
- Schlauch M. Kos O. and Frahm A.W., J. Pharm. Biomed. Anal, 27, 409(2002).
- Schlauch M. Volk F. J. Fondekar K. P. Wede J. and Frahm A.W., J. Chromatogr.A, , 897, 145(2000).
- Vermeij P., Pharm. Weekbl., 112(1977).
- Navarro M. Lehmann T. Fajardo E. J.C. Fuentes A. Delgado R. A. S. Silva P. and Urbina J. A., Polyhedron, 19, 2319(2000).
- Cini R. Tamasi G. Defazio S. Corsini M. Zanello P. Messori L. Marcon G. Piccioli F. and Orioli P., Inorg Chem, 42, 8038(2003).
- Massey A. Xu, Z.Y. and Karran P., Curr.Biol., 11, 1142(2001).
- Grime J. K., Anal Chim Acta., 105, 361(1979).
- Lingane P. J., Anal Chim Acta., 47, 529(1969).
- Walash M. I. Brashy A. M. El., Metwally M. E. S. and Abdelal A. A., Il Farmaco., 59, 493(2004).
- Moore R. I. andAnderson R. C., J.Am.Chem.Soc., 67,168(1945).
- Braun R. D., Introduction to Instrumental Analysis., Mc Hraw-Hill, New York (302)1987.
- Inczedy J., Analytical Application of Complex Eqilibra., JohnWiley and Sons Inc, Budapest 1976.
- Anacona J. R. and Toledo C., Transition Metal Chemistry., 26, 228(2001).
- Vandersteen O. S. Vrublevska T. and Lang H., Acta Chim Slov., 51, 95(2004).
- Nakamoto K., Infrared and Raman spectra of Inorganic and Coordination Compounds., Part, V Edition, John Wiley, Inc., USA, 384(1997).
- Liu D. and Kwasniewska K., Bull.Environ.Contam.Toxicol, 27, 289(1981).
- Shungu D. L., J.Clin.Microbiol, 18, 888(1988).
- Tweedy B. G., Phytophathology, 55, 910(1964).


![]()


