Method Development and Validation for Simultaneous Estimation of Atenolol and Nifedipine in Pharmaceutical Dosage Forms by RP-HPLC
S. Vidyadhara1, R. L. C.Sasidhar1* , B. Praveen Kumar1, N.T. Ramarao2 and N. Sriharita1
1Chebrolu Hanumaiah Institute of Pharmaceutical Sciences, Guntur, India
2Alkem Research Center, Mumbai, India
Article Received on :
Article Accepted on :
Article Published : 20 Oct 2016
A simple precise and economical reverse phase high performance liquid chromatographic method has been developed and validated for the estimation of atenolol and nifedipine simultaneously in combined dosage form. The method was developed using agilent ODS C18 column with a mobile phase constituting of methanol:acetonitrile:phosphate buffer(60:20:20) final adjusted to pH 3.0 with o-phosporic acid at a flow rate of 1.0ml/min and detection was carried out at 235nm.. The selected chromatographic conditions were found to effectively separate atenolol (Rt: 2.80 min) and Nifedipine (Rt: 4.40 min) having a resolution of 12.307. The developed method was validated for linearity, accuracy, precision, LOD, LOQ, robustness and for system suitability parameters as per ICH guidelines. Linearity for atenolol and nifedipine were found in the range of 5-25ìg/ml and 2-10ìg/ml, respectively. The percentage recoveries for atenolol and nifedipine ranged from 99.38-100.56% and 99.16-99.71%, respectively. The proposed method could be used for routine analysis of atenolol and nifedipine in their combined dosage forms.
KEYWORDS:Atenolol; Nifedipine; RP-HPLC; Method Validation
Download this article as:| Copy the following to cite this article: Vidyadhara S, Sasidhar R. L. C, Kumar B. P, Ramarao N. T, Sriharita N. Method Development and Validation for Simultaneous Estimation of Atenolol and Nifedipine in Pharmaceutical Dosage Forms by RP-HPLC. Orient J Chem 2012;28(4). |
| Copy the following to cite this URL: Vidyadhara S, Sasidhar R. L. C, Kumar B. P, Ramarao N. T, Sriharita N. Method Development and Validation for Simultaneous Estimation of Atenolol and Nifedipine in Pharmaceutical Dosage Forms by RP-HPLC. Available from: http://www.orientjchem.org/?p=22694 |
Introduction
Atenolol (ATE) is a β1-selective (cardioselective) β-adrenergic receptor blocking agent without membrane stabilizing or intrinsic sympathomimetic activities. Atenolol inhibits β2-adrenoreceptors, chiefly located in the bronchial and vascular musculature (1). Atenolol is also used to treat myocardial infarction and arrhythmias, angina, and disorders arising from decreased circulation and vascular constriction, including migraine. Atenolol may be used alone or concomitantly with other antihypertensive agents including thiazide-type diuretics, hydralazine, prazosin, and α-methyldopa (2).
Nifedipine (NFE) is a potent vasodilator agent with calcium antagonistic action. It is a useful antianginal agent that also lowers blood pressure. It is mainly used in the treatment of diuretics and ACE inhibitors although calcium channels anta-gonists are still favored as primary treatment for older black patients- sub lingual. Nifedipine has previously been used in hypertensive emergencies(3-4).Literature survey revealed about RP-HPLC methods for individual drugs. However, RP-HPLC methods employing UV-Visible detection have been reported in combination with other drugs (5-9). Hence in the present work a simple precise and accurate, RP-HPLC method was developed for the estimation of atenolol and Nifedipine in combined dosage forms.
Materials and Methods
Chemicals and Reagents
Reference standard samples of atenolol and nifedipine were procured from life line formulations Ltd., vijayawada. Formulation of brand “BETATROP” having combination of atenolol (50mg) and nifedipine (20mg) were procured commercially from the local market. HPLC grade methanol, acetonitrile and water procured from Merck specialties pvt ltd, mumbai India.
Equipment
Agilent 1120 compact LC chromatographic system, equipped with variable wavelength programmable UV detector and Rheodyne injector equipped with 20 µL fixed loop was used for the chromatographic separation. The chromatogram was recorded at and peaks quantified by means of Ezchrome software. Chromatographic separation was carried out on a C18 column [Agilent ODS 5 column, 250mm x 4.6mm].
Chromatographic Conditions
The mobile phase was composed of mixture of acetonitrile, methanol and buffer in the ratio of 60:20:20v/v (pH adjusted to 3.0 with orthophosphoric acid). It was filtered through a 0.45 μ membrane filter and degassed for 15 minutes. The flow rate of the mobile phase was maintained at 1 ml/min. Detection was carried out at 235 nm at ambient temperature.
Experimental
Preparation of standard stock solution
Standard stock solutions were prepared by dissolving 100 mg of atenolol and 100 mg of nifedipine working standard in a 100 ml volumetric flask using 50 ml of mobile phase and sonicated until the reference solution completely dissolves. Then the volume was made up to the mark with the mobile phase. Aliquots of each standard solutions were transferred to a series of 10ml volumetric flasks and the volume was made up to mark with mobile phase to give binary mixtures of various concentrations ie.., 5, 10, 15, 20, 25μg/ml for atenolol and 2,4,6,8,10μg/ml for nifedipine
Preparation of sample solutions
Twenty tablets each contacting 50mg of atenolol and 20mg of nifedipine were accurately weighed and finely powdered. A quantity of tablet powder equivalent to 50 mg of atenolol and 20 mg of nifedipine was weighed and transferred into a 100 ml volumetric flask. 50 ml of mobile phase was added and sonicated for 30 minutes and solution was made up to 100ml with mobile phase. 5 ml of filtered solution was diluted up to 50ml with mobile phase. Before injection, both standard and sample solutions were filtered.
Validation
The method was validated for the parameters like system suitability, specificity, linearity, precision, accuracy, robustness, LOD, LOQ, ruggedness and according to the ICH guidelines Q2B.
System suitability
Various system suitability parameters were carried out for the proposed method. Six injections of standard samples of ATE and NFE were given to HPLC system. The %RSD for tailing factors was determined. The theoretical plate number should be less than 1%.
Selectivity/Specificity
A method is said to be specific when it produces a responses only for a single analyte. In order to check that the method chosen was specific and selective. The parameters like retention time (Rt), resolution (RS) capacity factor, tailing factor were calculated.
Linearity
Linearity of the method was determined by mean of calibration graph using an increasing amount. Linearity was evaluated by visual inspection of a calibration graph. The linearity of the method was determined in concentration range of 5-25µg/mL for atenolol and 2-10µg/mL for nifedipine. Each solution was injected in triplicate. The slope, intercept were reported and the values were given in table 2.
Precision
Precision was studied by measuring intra-day and inter-day. Study was carried out by injecting six replicates of different sample solutions and the % RSD of the peak areas were determined and reported in the table 3.
Accuracy
To determine the accuracy of the proposed method, recovery experiments were performed by standard addition technique. In this method a known quantity of pure drug was added at three different levels i.e. 80 %, 100%, and 120% to pre-analyzed sample solutions and calculating the recovery of atenolol and nifedipine for each concentration.
LOD and LOQ
The LOD and LOQ values were determined by the formulae LOD = 3.3 σ/S and LOQ = 10 σ/S (Where, σ is the standard deviation of the responses and S is mean of the slopes of the calibration curves)
Robustness
The robustness of the method was investigated under a variety of conditions including slight changes in the mobile phase composition, flow rate variation and detection wavelength and the % RSD was determined.
Results and Discussion
A mixture of methanol:acetonitrile: buffer (60:20:20) was proved to be most suitable of all the combinations since the chromatographic peaks obtained were better defined and resolved and free from tailing. The retention times obtained for atenolol and nifedipine were 2.80 and 4.40 min respectively. An optimized chromatogram showing the separation is given in Figure 1
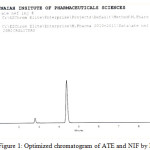 |
Figure 1: Optimized chromatogram of ATE and NIF by RP-HPLC |
System suitability was carried out by injecting 100% concentration of atenolol and nifedipine at different injection volumes. With increment of injection volumes, the %RSD for tailing factor and theoretical plate number was less than 1% and is satisfactory and resolution was found to be 12.307and the other parameters are presented in Table 1.The method specificity was assessed by studying the chromatograms obtained from a mixture of the drugs. The method was found to be specific as none of the excipients interfered with the analytes of interest. Hence, the method was found to be suitable for analyzing the commercial tablets
Table 1: System Suitability Parameters
|
Parameter |
Atenolol |
Nifedipine |
|
Retention time(min) |
2.80 |
4.40 |
|
Theoretical plates |
13948.66 |
10752 |
|
Tailing factor |
0.98 |
0.87 |
|
Resolution |
12.307 |
|
The linearity and range was found be in the range of 5-25µg/mL for atenolol and 2-10μ. The correlation coefficient of atenolol and nifedipine were found to be 0.9990 and 0.9991 respectively (Figure 2,3), which indicates a perfect correlation. The results are presented in Table 2. The % assay values of ATE and NFE were calculated from the responses of intraday and interday precision studies and were not less than 95% and not more than 105 %. The results indicates that the method was precise. Precision is reported as % RSD in Table 3, and minimum variation in the %RSD indicates the present method is precise.
Table 2: Linearity and Range
|
Parameters |
Atenolol |
Nifedipine |
|
slope |
1328471 |
256479.4 |
|
Intercept |
12838.67 |
51777.6 |
|
R |
0.9990 |
0.9991 |
|
LOD and LOQ |
0.16 µg/ml and 0.49 µg/ml |
0.33 µg/ml and 1.01µg/ml |
Table 3: Results of Precision
|
Concentration of solution(μg/ml) |
Observed concentration for 6 replicates(μg/ml) |
||||
|
Atenolol |
Nifedipine |
Intra day |
Inter day |
||
|
Mean |
%RSD |
Mean |
%RSD |
||
|
10 |
25 |
9.7 |
0.345 |
24.5 |
0.670 |
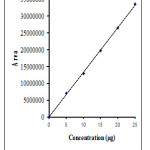 |
Figure 2: Calibration Curve of Atenolol |
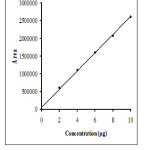 |
Figure 3: Calibration curve of nifedipine μ |
Accuracy of the proposed method was assessed by standard addition method at 80%, 100% and 120% levels of recovery to the pre analyzed sample in triplicate. Recovery values obtained (Table 4) indicate that the proposed method is highly accurate. The recovery of the added standard to the drug product sample was calculated and it was found to be 99.38 – 100.56 % for atenolol and 99.16 – 99.17% for nifedipine and the % RSD was less than 2 for both the drugs which indicates a good accuracy of the method to that of the label claim..
Table 4: Results of Accuracy
|
Spiked level |
Mean % recovery |
Mean % RSD |
||
|
Atenolol |
Nifedipine |
Atenolol |
Nifedipine |
|
|
80 |
99.38 |
99.53 |
0.127 |
0.303 |
|
100 |
99.99 |
99.16 |
0.110 |
0.220 |
|
120 |
100.56 |
99.71 |
0.747 |
0.247 |
LOD and LOQ were calculated from the average slope and standard deviation of y-intercepts of the calibration curve. LOD was found to be 0.16 µg/mL and 0.33 µg/mL LOQ was found to be 0.49 µg/mL and 1.01µg/mL respectively for atenolol and nifedipine indicating high sensitivity of the method.
Robustness was carried out by change in the flow rate (±0.1mL/min) and variation in wavelength (± 2 nm) and the mobile phase variation of 10%.Solution of 100% concentration is prepared and injected in triplicate for every condition. The Results are tabulated in the Table 5. The proposed method was applied for the assay of commercial tablets containing atenolol (50mg) and nifedipine (20 mg). Each sample was analyzed in triplicate. The mean recovery values were 100.12 and 100.03 for ATE and NFE.
Table 5: Results of Robustness
|
Parameters |
Optimum range |
Conditions in procedure |
Remarks |
|
Mobile phase composition
|
10% variations in the mobile phase composition |
60:20:20 v/v methanol : acetonitrile: buffer |
Beyond the optimum range of variation in the mobile phase composition, the resolution factor was decreased and the peak was not symmetric. |
|
Flow rate ml/min |
0.9-1.1 |
1.0 |
At lower flow rates the asymmetry factor was increased and at higher flow rates the resolution factor was decreased. |
|
Detection wavelength |
233-237 |
235 |
Beyond the optimum range the peak was not detected. |
Table 6: Result of Analysis of Formulation and Recovery Studies
| Drug | Amount claimed(mg per tablet) | Amount recovered (mg per tablet) | Mean recovery | %RSD |
| Atenolol | 50 | 50.06 | 100.13 | 0.563 |
| Nifedipine | 20 | 20.03 | 100.03 | 0.607 |
Conclusion
The developed RP-HPLC method for simultaneous assay of atenolol and nifedipine in combined tablets dosage forms are simple, precise, specific and highly accurate and less time consumption for analysis could be recorded. So, it can be employed for the routine analysis for simultaneous estimation OF ate AND NFE in quality control of formulations and also in the dissolution studies.
Acknowledgement
The authors are thankful to the management of Chebrolu Hanumaiah Institute of Pharmaceutical Sciences, Guntur, Andhra Pradesh for providing facilities to carry out the research work.
References
- Montvale N.J., Physician’s Desk Reference-PDR, 51st Edition (Medical Economics Company,1999.
- Wadworth AN, Murdoch D, Brogden RN., Drugs. (1991)
- Hideshi S, Hisakazu S. Chem. Pharm. Bull., 46(1), (1998)
- Tripathi K. D., Essentials of Medical Pharmacology, 5th Edition, Jaypee Brothers Medical Publishers, New Delhi.
- Behera A. K., Int Journal of ChemTech Research. (2010)
- Sandip L, Pandurang N, Indrajeet D.G, Vivek D, Pradeep.D. International Journal of Pharmacy and Pharmaceutical Sciences.(2010)
- Brigh A, Renuga Devi T and Gunasekaran S. Int Journal of ChemTech Research.(2010)
- Revath.R, Ethiraj.T, SaravananV.S ,Ganeshan .V, .Saranya.V., Int Jl of Pharmacy and Pharm Sciences. (2010)
- Charles.F. Drug information hand book international lexi comp inc USA. 2005

This work is licensed under a Creative Commons Attribution 4.0 International License.
![]()
A New Edition of Web of Science
Journal Impact Factor
2022: 0.5
Five Year: 0.8
Journal is Indexed in

Cabells Whitelist
![]()


