Determination of Aflatoxins G1 and G2 Using Ion Mobility Spectrometry
Ali Sheibani1, Meysam Zare-Khormizi1 and Mahmoud Tabrizchi2
1Department of Chemistry, Yazd Branch, Islamic Azad University, Yazd, Iran.
2Department of Chemistry, Isfahan University of Technology, Isfahan, Iran.
Article Received on :
Article Accepted on :
Article Published : 01 Dec 2012
This work describes a rapid and sensitive ion mobility spectrometry method for the determination of aflatoxins G1 and G2 (AFG1 and AFG2 ). The effective instrumental parameters were investigated and optimized. After optimizing, the calibration curves for AFG1 and AFG2 were linear in the range of 1 to 300 ng. Relative standard deviation was 8% and limit of detection was 0.5 ng. The capability of the proposed method was evaluated for the determination of AFG in spiked pistachio nut as a real sample that satisfactory results were obtained.
KEYWORDS:Aflatoxin G (AFG); Aflatoxin B (AFB); Ion mobility spectrometry (IMS); Pistachio nut
Download this article as:| Copy the following to cite this article: Sheibani A, Zare-Khormizi M, Tabrizchi M. Determination of Aflatoxins G1 and G2 Using Ion Mobility Spectrometry. Orient J Chem 2012;28(4). |
| Copy the following to cite this URL: Sheibani A, Zare-Khormizi M, Tabrizchi M. Determination of Aflatoxins G1 and G2 Using Ion Mobility Spectrometry. Available from: http://www.orientjchem.org/?p=11905 |
Introduction
Aflatoxins (AF) belong to the group of mycotoxins, toxic fungal metabolites found as contaminants in various agricultural commodities under favourable temperature and humidity. AFs are difuranocumarine derivatives produced by Aspergillus Flavus and Aspergillus Parasiticus through a polyketid path way1–3. These compounds are carcinogenic, mutagenic and teratogenic to the most animals and humans. Among 20 identified AFs, the four major AFs are B1, B2, G1 and G2 (Fig. 1) named based on their fluorescence under UV light (blue or green) and relative chromatographic mobility during TLC5. Those AFs occur naturally in wide variety of agricultural products including cereals, nuts and dried fruits. Pistachio nuts are especially sensitive samples to AFs contamination. Some reports indicate natural contamination with AFB and AFG mainly in countries with warm and humid climate6-8.
In order to control AFs levels in agricultural products, several analytical methods have been developed TLC [9], HPLC with different detectors10-13 and enzyme linked immunosorbent assay14 are the most commonly used. These methods are usually time consuming and require harmful solvents and well equipped laboratories. Therefore, it is still necessary to develop a sensitive, rapid and low cost method for the determination of AFs.
Here we report a method for determination of AFs ion mobility spectrometry (IMS). IMS is a gas phase ion separation technique that allows analytes to be identified on the basis of ion mobility. The principles of IMS are well described in book and literature15,16. In brief IMS characterizes chemical compounds using gas phase motilities of ions in weak eclectic fields at ambient pressure. The mobility of an ion is determined by the ion velocity that is measured in the drift tube of the spectrometer where an electric filed is applied. During their drift, ions are separated based on their size, shape, and charge. Therefore, different ions reach the detector at different drift times, which are their characteristic. The number of ions reach to the detector is considered as a measure of the analytes concentration. IMS has applied for the rapid and sensitive detection of trace amounts of a broad range of compounds.17-20
We previously, reported the capability of IMS equipped with positive corona discharge ionization source in determination of AFB1 and AFB2 in pistachio nut as a real sample18. Here, the method was extended for the determination of AFG1 and AFG2 and also the simultaneous determination of AFB and AFG in pistachio sample investigated.
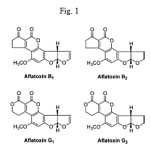 |
Figure 1 Click here to View figure |
Experimental
Materials and Chemicals
Pistachio samples were supplied by Pistachio Co. (Rafsanjan, Iran). The materials and solvents used for this research were purchased from Merck. AFs (B and G) were obtained from sigma Co. Stock standard solutions were prepared by dissolving analytes in methanol. The concentration of the solutions was determined using a UV-vis instrument as explained in Ref.21 and stored below 5 ºC until use. Working standard solutions were prepared by diluting stock standard in methanol. Immunoaffinity columns (Afla Test) were supplied by Vicam of USA.
Instrumentation
The ion mobility spectrometer used in this work was constructed in Isfahan University of Technology. The spectrometer, equipped with corona discharge ionization source was operating in the positive mode. The instrument was described in details in Ref.17. The newly designed injection port18 for direct introducing liquid samples into the IMS was used. The injection port was filled with steel wool to enhance evaporation rate of the solvent and analyte. A UV-vis spectrophotometer (Shimadzu, 160-A, Japan) with 1 cm matched quartz cells was also used to verify the concentration of AF standard solutions.
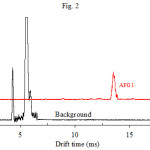 |
Figure 2 Click here to View figure |
Sample Preparation
The extraction and purification of AFs were performed based on the AOAC method22. 25 g grounded pistachio sample was used for each experiment. 5 g of NaCl and 125 mL of methanol solution (70%) were added to the grounded pistachio sample. The mixture was then blended at high speed for 2 min and filtered. 15 mL of the filtered solution was then mixed with 30 mL of water and filtration repeated. 15 mL of filtered solution was passed through Afla test affinity column at a flow rate of 1–2 drops per second. The column was twice washed with 10 mL water and dried with air. Finally, it was eluated by passing 1 mL methanol. This solution was then used for determination of AFs using IMS method.
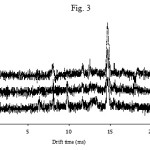 |
Figure 3 Click here to View figure |
Results and Discussion
Optimization of the IMS Operation Parameters
Preliminary studies indicated the possibility of using IMS to determine AFG. AFG1 and AFG2 were separately injected into the IMS cell. Fig. 2 shows the ion mobility spectrum of AFG1 which contains only one peak. The spectrum of AFG2 was similar to AFG1, i.e, a single peak appeared at a drift time identical to that of AFG1. Based on their structures (Fig. 1) and molecular weight (328 and 330), this behavior was predictable. IMS is not able to resolve two ions with similar structure that differ by only 2 amu. This was the case in our previous work, where it was shown that AFB1 and AFB2 have identical spectra18.
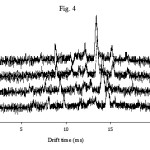 |
Figure 4 Click here to View figure |
To obtain the best sensitivity for determination of AFG the parameters such as the corona and drift voltage, the injection and cell temperature, the flow rates of drift and carrier gas, and the shutter grid pulse width were investigated and optimized. The optimized experimental conditions for determining of AFG are given in Table 1 which are the same as those previously obtained for determination of AFB18. Among all parameters, temperature is the most important one. The spectrum was recorded at different temperature for injection port as well as for the IMS cell. Figs 3 and 4 show the effect of temperature (injector and cell, respectively) on the sensitivity. As shown, increasing the injection port temperature enhances the peak height. Similarly the cell temperature improves the sensitivity.
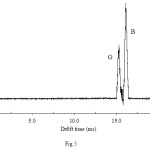 |
Figure 5 |
Table 1: The optimized experimental conditions of IMS for determination of AFG
| Parameter | Setting |
| Length of drift tube | 11 (cm) |
| Drift field | 600 (V cm-1) |
| Corona voltage | 2200 (V) |
| Drift gas flow (N2) | 600 (mL min-1) |
| Carrier gas flow (N2) | 300 (mL min-1) |
| Injection port temperature | 220 (oC) |
| IMS cell temperature | 190 (oC) |
| Typical shutter grid pulse width | 100 (µs) |
Analytical Parameters
The calibration curves for AFG were prepared with spiking different volumes of the analyte standard solutions into uncontaminated pistachio sample as blank. The blank was analyzed by IMS in which no AFG peak was observed. The analytical parameters for the determination of AFG were given in Table 2. According to this Table and Ref.18, the results show the wide linear range in comparison with the determination of AFB. Furthermore, the precision is also improved for determination of AFG.
Table 2: The analytical parameters for the determination of AFG1 and AFG2
|
(0.9887, 0.9986) |
R2 (G1, G2) |
|
1–300 |
LDR (ng) |
|
0.5 |
LOD (ng) |
|
8 |
RSD% |
Determination of AFG1 and AFG2
To evaluate the analytical applicability of the proposed method, it was applied to the determination of AFG1 and AFG2 in spiked pistachio nuts. The results are given in Table 3. The recoveries are close to 100 % and indicate that the developed method can be used to the determination of AFG in pistachio samples.
Table 3: Determination of AFG1 or AFG2 for spiked pistachio samples
|
Recovery% |
Spiking levels (ng) |
Sample |
|
97 |
4.0 |
1 |
|
102 |
7.0 |
2 |
|
104 |
3.0 |
3 |
|
97.8 |
6.0 |
4 |
|
95.8 |
5.0 |
5 |
The possibility of determination of the total AFG1 and AFG2 was investigated. As mentioned before, the product ions of AFG1 and AFG2 completely overlap and appear at same drift time (13.7 ms). This means that IMS cannot separate and distinguish between AFG1 and AFG2. This problem was also observed in determination of AFB1 and AFB218. To achieve to the determination of total AFG1 and AFG2, the response factors of them were evaluated and compared based on the slopes on their calibration curves. Statistical calculations show that the response factors slightly differ. Therefore, the determination of total AFG can be performed by IMS method.
Analysis of Mixtures of AFB and AFG
The other objective of our work was the development of IMS method for the simultaneous determination of mixtures of AFB and AFG without pre-separation. Binary mixtures of AFB1 and AFG1 were injected into the instrument at conditions given at Table 1. The ion mobility spectrum of this mixture is shown in Fig. 5. The product ions were appeared in the range of 15 to 16.8 ms so that the corresponding peaks did not overlap. The peak appeared at lower drift time is originated from AFG1 whereas the second peak originates from AFB1. The obtained results were unacceptable due to influence AFB1 and AFG1 signal on another. Therefore, a separation technique such as HPLC is required in the simultaneous determination purposes.
Conclusions
IMS using corona discharge ionization source permits rapid, sensitive and reproducible determination of AFG1 and AFG2. The reasonable results were achieved that showed the developed method can be applied as a simple and low cost method comparison with to other methods for the determination of AFs.
Acknowledgments
The authors are thankful to the Islamic Azad University, Yazd branch for the financial support of this work.
References
- Sherif, S.O, Salama, E.E., and Abdel-Wahhab, M.A., Int. J. Hyg. Environ. Health 212: 347 (2009).
- Richard, J.L., Int. J. Food Microbiol. 119: 3 (2007).
- Zhang, D.H., Li, P.W., Zhang, Q., Zhang, W., Huang, Y.L., Ding, X.X., and Jiang, J., Anal. Chim. Acta 636: 63 (2009).
- Catharino, R.R., Marques, L.D.A., Santos, L.S., Baptista, A.S., Gloria, E.M., Calori-Domingues, M.A., Facco, E.M.P., and Eberlin, M.N., Anal. Chem. 77: 8155 (2005).
- Bennett, J.W., and Klich, M., Clin. Microbiol. Rev. 16: 497 (2003).
- Luttfullah, G., and Hussain, A., Food Control 22: 426 (2011).
- Sulyok, M., Krska, R., and Schuhmacher, R., Food Chem. 119: 408 (2010).
- Leong, Y.H., Ismail, N., Latif, A.A., and Ahmad, R., Food Control 21: 334 (2010).
- Nawaz, S., Coker, R.D., and Haswell, S.J., Analyst 117: 67 (1992).
- Afsah-Hejri, L., Jinap, S., Arzandeh, S., and Mirhosseini, H., Food Control 22: 381 (2011).
- Becker, M., Degelmann, P., Herderich, M., Schreier, P., and Humpf, H., J. Chromatogr. A 818: 260 (1998).
- Josephs, R.D., Krska, R., Grasserbauer, M., and Broekaert, J.A.C., J. Chromatogr. A 795: 297 (1998).
- Wang, Y., Chai, T., Lu, G., Quan, C., Duan, H., Yao, M., Zucker, B.A., and Schlenker, G., Env. Res. 107: 139 (2008).
- Gonzalez, E., Nogueira, J.H.C., Fonseca, H., Felicio, J.D., Pino, F.A., and Corrêa, B., Int. J. Food Microbiol. 123: 184 (2008).
- Eiceman, G.A., and Karpas, Z., Ion Mobility Spectrometry, CRC Press, Boca Raton, FL, 2005.
- Creaser, C.S., Griffiths, J.R., Bramwell, C.J., Noreen, S., Hill, C.A., and Thomas, C.L.P., Analyst 129: 984 (2004).
- Tabrizchi, M., and ILbeigi, V., J. Hazard. Mater. 176: 692 (2010).
- Sheibani, A., Tabrizchi, M., and Ghaziaskar, H.S., Talanta 75: 233 (2008).
- Schmidt, H., Baumbach, J.I., and Klockow, D., Anal. Chim. Acta 484: 63 (2003).
- Keller, T., Keller, A., Tutsch-Bauer, E., and Monticelli, F., Forensic Sci. Int. 161: 130 (2006).
- AOAC Official Method, 1995, 970.44.
- AOAC Official Method, 2000, 991.31.

This work is licensed under a Creative Commons Attribution 4.0 International License.
![]()
A New Edition of Web of Science
Journal Impact Factor
2022: 0.5
Five Year: 0.8
Journal is Indexed in

Cabells Whitelist
![]()


