A Selective Optical Sensor for Boron Determination Based on Immobilization of Neutral Red on a Ttriacetylcellulose Membrane
Ali Reza Zarei, Sonia Nobakht and Mohammad Ali Zaree
Faculty of Chemistry and Chemical Engineering, Malek Ashtar University of Technology, Tehran, 15875-1774, Iran.
Article Received on :
Article Accepted on :
Article Published : 01 Dec 2012
A novel optical sensor has been proposed for sensitive determination of boron in aqueous solutions. The sensing membrane was prepared by chemical immobilization of neutral red on the triacetylcellulose membrane. The procedure is based on spectrophotometric measurement of the decrease in the pH produced by the complexation of boric acid with mannitol by optical sensor at 540 nm. The influence of factors responsible for the improved sensitivity of the sensor were studied and identified. Under optimum conditions, the optode shows excellent response over a concentration range of 1.0-20 ìg.ml-1 for boron with a limit of detection of 0.50 µg.ml-1. The response time of the optode was about 10 min. The optode revealed very good selectivity with respect to many cations and anions. The proposed optode was applied to the determination of boron in water samples.
KEYWORDS:Boron; Optode; Triacetylcellulose; Neutral red; Spectrophotometry
Download this article as:| Copy the following to cite this article: Zarei A. R, Nobakht S, Zaree M. A. A Selective Optical Sensor for Boron Determination Based on Immobilization of Neutral Red on a Ttriacetylcellulose Membrane. Orient J Chem 2012;28(4). |
| Copy the following to cite this URL: Zarei A. R, Nobakht S, Zaree M. A. A Selective Optical Sensor for Boron Determination Based on Immobilization of Neutral Red on a Ttriacetylcellulose Membrane. Available from: http://www.orientjchem.org/?p=11908 |
Introduction
Boron is an important micronutrient for plants, animals and humans and its presence has been demonstrated to affect the function or composition of several body compartments (such as the brain, the skeleton and the immune system) in humans and animals1,2. Too high an amount of boron can limit plant growth and even lead to its death and for humans an excessive amount may result in nausea, vomiting, diarrhea, dermatitis and lethargy3. Therefore, the consumption of food and water with a high boron contents can be potentially hazardous to the health. As a consequence, the World Health Organization (WHO) has suggested that a safe range of boron intake for adult human beings could well be 1-13 mg per day4. Thus, the control of boron levels in samples that related with animal and human nutrition is very important.
The optical methods for determining boron are atomic absorption spectrometry (AAS)5-8, inductively coupled plasma-atomic emission spectrometry (ICP-AES)9-13, fluorimetry14,15, and spectrophotometry16-20. Spectrophtometric determination of boron with curcumin as complexing agent, because of simplicity and high sensitivity is widely used for routine analysis. But the interference of water in the reaction between boron and curcumin is a serious problem and it is necessary to removal of water from samples. To overcoming this problem, boron has to be selectively separated from the matrix either by solvent extraction with diols (such as 2-ethyl hexane 1,3-diol (EHD)21 or by isothermal distillation of borate ester17. Therefore, sample preparation for the determination of trace amounts of boron using these methods will be time consuming and tedious.
In recent years there has been a growing need or desire for constructing chemical sensors for fast and economical monitoring of environmental samples. In this connection, optical chemical sensors (optodes) are those of the advanced techniques in analytical chemistry and they have been accepted as advantageous because they can be miniaturized and can be manufactured at low cost22-24. The immobilization of sensing reagents onto membranes is an important step in the preparation of optical chemical sensors for practical applications. The indicator dyes can be physically or chemically immobilized on the support matrixes. Immoblization through adsorbed can be done easily, but the reagents tend to leach from the supporting matrixes. Chemical immobilization by covalent binding of reagents on supported matrixes is the most efficient technique for obtaining optical chemical sensors, having well reproducible response and long lifetime25. Various polymeric membranes have been used as a supporting matrix for preparation of optodes. The rapid response results from the porous structure of the polymeric support, which minimizes barriers to mass transport between the analyst and immobilized indicator. The hydrolyzed cellulose film is an example of these polymeric membranes which could be used for the preparation of optical sensors26-30.
In this paper, the design of an optode for determination of low levels of boron is described in which the sensing reagent is neutral red immobilized on triacetylcellulose membrane. Also a simple method is presented for immobilizing reagent on membrane. The reaction take place within few minutes and a color change occurs from yellow to red, which is spectroscopically detected in the absorbance mode. To the best of our knowledge, no attempt has been made up to now to assay boron using optical sensors.
Experimental
Apparatus
A Hitachi model 3310 UV-Vis spectrophotometer was used for recording the visible spectra and absorbance measurements. The sensing membrane was placed and fixed in a disposable cuvette and all measurements were performed in a batch mode. with 1-cm quartz cells was used for recording absorbance spectra. Measurements of pH were made with a metrohm 691 pH-meter using a combined glass electrode. All experiments were performed at 25 0C
Materials and reagents
All reagents were of the best available analytical reagent grade. All solutions were prepared in polypropylene volumetric flask. The neutral red reagent and ethylenediamine were supplied from Merck. A stock solution of 1000 μg.ml-1 of boron was prepared by dissolving 0.5636 g boric acid (Merck) in water and diluting to 100 ml in a volumetric flask. Working standard solutions of lower concentration were prepared by prepared by suitable dilutions of the stock solution with water. A 1.0 M mannitol solution was prepared by dissolving 4.550 g mannitol (Merck) in water and diluting to 25 ml in a volumetric flask.
Analytical procedure for the determination of boron in water samples
An aliquot of the solution containing 10-200 μg of boron and 1.0 ml of 1.0 M mannitol were added to 10 ml volumetric flask and diluted to mark water. A few ml of this solution was transferred to spectrophotometer cell which optical membrane was mounted into it. The cell was shaked and after 10 min the absorbance was measured at 540 nm
Preparation of optical sensor
The immobilized indicator on triacetylcellulose was prepared according to the following procedure31.
The tansparent triacetylcellulose membranes were produced from waste photographic film tapes that were previously treated with commercial sodium hypochloride for several seconds in order to remove colored gelatinous layers. The films were treated with a clear solution of neutral red (10 mg) in 10 ml ethylenediamine for 5 min at room temperature. Then they were washed with water for removing ethylediamine and loosely trapped indicator. The membranes were finally washed with detergent solutions and water. Prepared membranes were kept under water when not in use.
Results and Discussion
Spectral characteristics
In aqueous solution and at neutral pH, boric acid complexes mainly with two molecules of mannitol and produces a negatively charged di-borate ester and decreasing the pH of the solution according to Scheme 132,33.
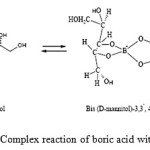 |
Scheme 1: Complex reaction of boric acid with mannitol |
Therefore, pH changes in solution can be monitoring by indicator as an optical sensor. Figure 1 shows the absorption spectra of immobilized neutral red, which were obtained after being equilibrated in different concentrations of boron. The spectral change is a result of the complex formation of boric acid with mannitol and decreasing the pH of the solution. The spectral characteristic of this sensor showed two maxima at 540 and 457 nm. As can be seen from figure 1 the increase in the absorption band at 540 nm is more pronounced in the membrane as the boron concentration increases. Therefore, wavelength of 540 nm was selected for further studies because of high sensitivity at this wavelength.
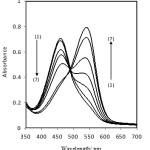 |
Figure 1: Absorption spectra of optode film in the presence of boron (1) 2.0 (2) 3.0 (3) 4.0 (4) 6.0 (5) 8.0 (6) 10 (7) 12 μg.ml-1. Conditions: mannitol, 0.1 M, time, 10 min. |
The effect of mannitol concentration
The effect of mannitol concentration on the complex formation was studied in the range 0.010to 0.30 M. The results revealed that the response of the optical sensor increased by increasing reagent concentration up to 0.10 M, and remained nearly constant at higher concentrations (figure 2). Therefore, a concentration of 0.10 M of mannitol was selected as optimum concentration.
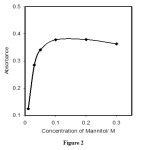 |
Figure 2: Effect of mannitol concentration on the optode film response, Conditions: boron, 5.0 μg.ml-1; mannitol, 0.1 M; time, 10 min Click here to View figure |
Response time
An important analytical feature of any sensor is its response time. The response time is defined as the required for 95% of the total signal change. The response time of the optode was tested by recording the absorbance change from a solution containing mannitol (pH 6.0) to the same solution in the presence of 5.0 μg.ml-1 of boron. The membrane was found to reach 95% of the final signal within 10 min (figure 3).
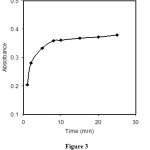 |
Figure 3: Typical response curve of the sensor as a function of time at 540 nm, Conditions: boron, 5.0 μg.ml-1; mannitol, 0.1 M. |
Life time of the optical sensor
The life time of membrane was determined by adding a solution (pH 4.0) in a cuvette including the film. The signal was recorded at wavelength of 540 nm over a period of about 5h. No significant loss of the indicator occurs during this time. When the membrane was exposed to light, no drift in signal occurred and the optode was stable over the experiment with no leaching of the indicator. However, prepared membranes were kept under water when not in use to prevent them from drying out. Also the stability of response of the film was investigated over 2 month under ambient conditions, which indicated that the film stable over this period.
Regeneration of the optode membrane
A good sensor should fully regenerate at short time. For this purpose, the effect of various alkaline materials was studied as regeneration reagent. The best result was obtained by sodium hydroxide. A solution of 0.01 M of sodium hydroxide provided a short membrane regeneration time of lower than 1 min without any leaching the reagent. The membrane could be regenerated about 20 times and used without any loss of sensitivity.
Reproducibility and reversibility
The reproducibility and the reversibility of the membrane in the determination of boron were evaluated by repeatedly exposing the membrane to a 5.0 μg.ml-1 of boron solution. The repeatability was evaluated by performing seven determinations with the same standard solutions of boron, individually. The relative standard deviation (R.S.D.) for the response of one membrane towards a 5.0 μg.ml-1 of boron solution was 2.75 %. The reproducibility of the response of different membranes was also studied. Seven membranes were prepared from the same batch and they were evaluated by performing the determination of 5.0 μg.ml-1 of boron. The relative standard deviation (R.S.D) for the response of between membranes was 3.21 %. The results show that the reproducibility and reversibility are satisfactory.
Effect of foreign ions
The effects of various species on the determination of 5.0 μg.ml-1 of boron was tested under the optimum conditions. The tolerance limit was defined as the concentration of added species causing less than ±5 relative error. The results are given in Table 1. Therefore, the results presented in this table show the good selectivity of the procedure.
Table 1: Tolerance limit of diverse ions on the determination of 5.0 μg.ml-1 of boron solution
|
Species |
Tolerane ratio (wion/wboron) |
|
Na+, K+, Mg2+, NH4+, Ba2+, Zn2+, Fe2+, Cd2+, Ni2+, Ca2+, SO42-, CO32-, NO3–, PO43-, Br–, F–, Cl– Fe3+, NO2– |
200:1 40:1 |
Analytical figures of merit
Under the optimized experimental conditions for boron determination, the standard calibration curves were constructed by plotting the response of the optode membrane versus concentration of boron. The calibration graph was linear in the range of 1.0-20 μg.ml-1 of boron solution. The equation for the line was A= 0.0598C + 0.0772, with regression coefficient (r) of 0.9995 (n=10) where A is the absorbance and C is the concentration of boron in μg.ml-1. The limit of detection (LOD) defined as CL=3SB/m34, where CL, SB, and m are the limit of detection, standard deviation of the blank, and slope of the calibration graph, respectively, was found to be 0.50 μg.ml-1.
Determination of boron in water samples
Finally, the applicability and reliability of proposed method for the analysis of boron was investigated in water samples. For studying the matrix effect on the determination of boron, the water samples were spiked with boron at variable concentrations and were analyzed according to recommended procedure. The analytical data summarized in Table 2 suggests that good recoveries for boron added to samples are achieved.
Table 2: Determination of boron in water samples by proposed method
|
Samples |
Boron (μg.ml-1) |
||
|
Spiked |
Founda |
Recovery (%) |
|
|
Potable water River water Mineral water |
0.0 1.0 5.0 10 0.0 0.50 5.0 10 0.0 0.50 5.0 10 |
Not detected 0.95 ± 0.38 5.28 ± 0.45 9.83 ± 0.49 Not detected 0.52 ± 0.44 4.79 ± 0.56 10.4 ± 0.48 Not detected 0.51 ± 0.28 4.71± 0.37 10.3 ± 0.35 |
– 95.0 105.6 98.3 – 104 95.8 104 – 102 94.2 103 |
aFor five replicate deterrminations
Conclusion
The optical described in this work is easily prepared and provides a simple and inexpensive means for the determination of boron. The membrane responds to boron by changing color reversibly from yellow to red. The sensor can be regenerated readily with a diluted alkaline solution. It is reversible and has a long lifetime. The response of the optode was reproducible and the optode presented a good selectivity for boron over other species. The proposed method could be applied to the determination of boron in water samples.
References
- Power P.P., Woods W.G., Plant Soil, 193: 1(1997).
- Nielsen F.H., Plant Soil, 193: 199 (1997).
- Nielsen F.H., Ultratrace elements of possible importance for human health, An update. In A. S. Prasad (Ed.), Essential and toxic trace elements in human health and disease: an update, Wiley-Liss, New York (1993).
- World Health Organization (WHO), Guidelines for drinking water quality,Geneva, (1998).
- Nowka R., Eichardt K., Welz B., Spectrochim. Acta Part B, 55: 517 (2000).
- Burguera M., Burguera J.L., Rondon C., Carrero P., Spectrochim. Acta Part B, 56: 1845 (2001).
- Resano M., Briceno J., Aramend M., Belarra M.A., Anal. Chim. Acta, 582: 214 (2007).
- Lopez-GarciaI., Vinas P., Romero-Romero R., Hernandez-Cordoba M., Spectrochim. Acta Part B 64: 179 (2009).
- Tamat S.R., Moore D.E., Anal. Chem, 59: 2161 (1987).
- Krejcova A., Cernohorsky T., Food Chem., 82: 303 (2003).
- Simsek A.T., Korkmaz D., Velioglu Y.S., Ataman O.Y., Food Chem., 83: 293 (2003).
- Ozcan H., Yilmaz S., J. Serb. Chem. Soc., 70: 1219 (2005).
- Kataoka H., Okamoto Y., Tsukahara S., Fujiware T., Ito K., Anal. Chim. Acta, 610: 179 (2008)
- Yamane T., Kouzaka Y., Hirakawa M., Talanta, 55: 387 (2001).
- Themelis A.E.D., Bikou H., Tzanavaras P.D., Rigas P.G., Anal. Chim. Acta, 510: 219 (2004).
- Sanchez-Ramos S., Medina-Hernandez M.J., Sagrado S., Talanta, 45: 835 (1998).
- Thangavel S., Dhavile S.M., Dash K., ChaurasiaS.C., Anal. Chim. Acta, 502: 265 (2004).
- Carrero P., Malave A., Rojas E., Rondon C., Petit dePena Y., Luis Burguera J., Burguera M., Talanta, 68: 374 (2005).
- Zaijun L., Zhengwei C., Jian T., Food Chem., 94: 310 (2006)
- Li Q., Zhang T., Talanta, 71: 296 (2007).
- Dyrssen D., Uppstrom L., Anal. Chim. Acta, 46: 55 (1969).
- Moody G.J., Saad B.B., Thomas J.D.R., Sel. Electrode Rev., 10: 71 (1988).
- Wolfbeis O.S., Fresenius Z. Anal.Chem, 325: 387 (1986).
- Brook E., Narayanaswamy R., Sens.Actuators B, 38: 195 (1997).
- Sanchez-Pedreno C., Ortuno J.A., Albero M.I., Garcia M.S., Valero M.V., Anal. Chim. Acta, 414: 195 (2002).
- Liu X., Xing W., Ou G., Liang J., Anal. Sci.,16: 473 (2000).
- Jones T.P., Porter M., D., Anal. Chem., 60: 404 (1988).
- Kostov Y., Tzonkov S., Yotova L., Krysteva M., Anal. Chim. Acta, 280: 15 (1993).
- Safavi A., Abdollahi H., Anal. Chim. Acta, 367: 167 (1998).
- Krysteva M., Al Hallak M., Scientific World J., 3: 585 (2003).
- Safavi A., Bagheri M., Sens. Actuators B, 90: 143 (2003).
- Belcher R., Tully G.W., Svehla G., Anal. Chim. Acta, 50: 261 (1970).
- Makkee M., Kieboom A.P.G., Vanbekkum H., Recl. Trav. Chim. Pay Bas, 104: 230 (1985).
- Ingle J.D., Crouch J.R., Spectrochemical Analysis, Premtice-Hall, USA, 1988.

This work is licensed under a Creative Commons Attribution 4.0 International License.
![]()
A New Edition of Web of Science
Journal Impact Factor
2022: 0.5
Five Year: 0.8
Journal is Indexed in

Cabells Whitelist
![]()


