Removal of Lead from Aqueous Solutions Using Fagus Orientalis Lipsky: Box-Behnken Experimental Design
Ateesa Yazdanipour* and Mona Akbari
Department of Chemistry, Faculty of Science, Islamic Azad University, Arak Branch, Arak, Iran
Fagus orientalis Lipsky tree leaves, which are abundant in Iran, were evaluated for removal of lead from aqueous solutions. The optimization strategy is carried out by using two level full factorial designs. Results of the two levels full factorial design (24) based on an analysis of variance demonstrated that the initial pH, contact time and concentration of biomass are statistically significant. A three factor, three-level Box-Behnken experimental design was employed for maximizing lead removal from aqueous solution by Fagus orientalis Lipsky tree leaves shells based on 17 different experimental data obtained in a lab-scale batch study. Three independent variables (initial pH of solution ranging from 2 to 6, contact time ranging from 10 to 100 min and concentration of biomass ranging from 1 to 10 mg L-1) were consecutively coded as x1, x2 and x3 at three level (-1, 0 and 1), and a second-order polynomial regression equation was taken derived to predict responses. The significance of independent variables and their interactions were tested by means of the analysis of variance (ANOVA) with 95% confidence limits. The optimum values of the selected variables were obtained by solving the quadratic regression model, as well as by analyzing the response surface counter plots. The experimental conditions as this global point were determined to be pH = 5.0, t = 60 min and Cbiomass= 10 mg L-1, and the corresponding lead removal efficiency was found to be about 100%.
KEYWORDS:Lead; Removal; Biomass; Fagus orientalis Lipsky; Box-Behnken design
Download this article as:| Copy the following to cite this article: Yazdanipour A, Akbari M. Removal of Lead from Aqueous Solutions Using Fagus Orientalis Lipsky: Box-Behnken Experimental Design. Orient J Chem 2012;28(3). |
| Copy the following to cite this URL: Yazdanipour A, Akbari M. Removal of Lead from Aqueous Solutions Using Fagus Orientalis Lipsky: Box-Behnken Experimental Design. Available from: http://www.orientjchem.org/?p=22940 |
Introduction
Advances in water and wastewater treatment technology need spur for the development of technologies that may be more effective and less costly. Nowadays, the contamination of water by toxic heavy metals through the discharge of industrial wastewater is a world wide environmental problem. The term heavy metal refers to the metallic elements having density greater than or equal to 6.0 g cm-3.1-3 The contamination of wastewaters and surface waters by toxic heavy metals is a worldwide environmental problem. These toxic metal ions commonly exist in process waste streams from mining operations, metal plating facilities, power generation facilities, electronic device manufacturing units, and tanneries. Because of economic and environmental factors, the removal and recovery of heavy-metal ions from industrial wastewater have been a significant concern in most industrial branches.4,5 Lead has been recognized one of the most hazardous heavy metals since mining, acid battery manufacturing, metal plating, printing, textile, photographic materials, ceramic and glass industries, explosive manufacturing and also lead-containing piping materials are the main source of lead contamination.
The most commonly applied physicochemical treatment methods are: (a) precipitation as hydroxides, carbonates or sulfides and subsequent liquid-solids separation by gravity settling, and flotation or filtration, (b) sorption (adsorption, ion exchange), (c) membrane processes, (d) electrolytic recovery and (e) liquid-liquid extraction.6-9 However, each method has its merits and limitations in application and they are often limited by technical and economical issues.10 Lead has
The use of multivariate experimental design techniques is becoming increasingly widespread in chemistry. Multivariate experimental design techniques, which permit the simultaneous optimization of several control variables, are faster to implement and more cost-effective than traditional univariate (one at a time) approaches.11 One of the most popular multivariate design techniques is two level full/fractional factorial, in which every factor is experimentally studied at only two levels. Due to their simplicity and relatively low cost, full factorial design techniques are very useful for preliminary studies or in the initial steps of an optimization, while fractional factorial designs are almost mandatory when the problem involves a large number of factors. On the other hand, since only two levels are used, the models that may be fit to these designs are somewhat restricted. If a more sophisticated model is needed, as for the location of an optimum set of experimental conditions, then one must resort to augment response surface designs, which employ more than two factor levels. Among these, Box–Behnken is a second-order multivariate design technique based on three-level incomplete factorial designs that received widespread application for evaluation of critical experimental conditions, that is, maximum or minimum of response functions. The number of experiments (N) required for the development of this design is defined as N = 2k(k−1) + C0, where k is the factor number and C0 is the replicate number of the central point. 12-14
The target of this study was to investigate the biosorption potential of Fagus Orientalis Lipsky tree leaves to treat wastewaters contaminated with lead. The metal loading capacity of yeast biomass was determined as a function of the initial metal ion concentration, contact time, biomass amount and pH using Box-Behnken design. The biosorption data were analyzed by Freundlich and Langmuir isotherm models. The effect of temperature and thermodynamic parameters was studied as well.
Experimental
Apparatus and Materials
The experiments were performed using a Shimadzu atomic absorption spectrometer (AA-680) equipped with deuterium background correction. An Pb hollow cathode lamps (Hamamatsu, Photonic Co. Ltd, L233-series) was used as the radiation source. The pH was determined with a model 780 Metrohm pH-meter with combined glass-calomel electrode. Box-Behnken design was accomplished with Minitab Version 16. All reagents used were of the highest available purity and at least analytical reagent grade. The water utilized in all studies was double-distilled and deionized. Metal ion solution used in this study was prepared by dilution of 1000 mg L-1 stock solution of lead obtained by dissolving nitrate salt of lead in distilled and deionized water. Universal buffer solutions were prepared from boric acid, citric acid and phosphoric acid. The final pH was adjusted by the addition of 0.2 mol L-1 sodium hydroxide.
Biosorbent Material
The Fagus Orientalis Lipsky tree leaves were gathered from twigs by clean plastic bags, washed with ion-free distilled water and then dried at 80° C for 24 h. The dried biomass was powdered by using mortar and pastel. The powdered biomass was sieved to the mesh of 40–50 and then stored in plastic bags to get ready for being used as a biosorbent in batch studies.
Biosorption Studies
The biosorption of lead ion on the dried yeast biomass was investigated in batch biosorption equilibrium experiments. The effect of the initial metal ion concentration, contact time, biomass amount and pH using Box-Behnken design were studied. For this adsorption experiments, 10 ml of metal solution of known initial concentration was shaken with sorbent at 150 rpm, at the desired temperature (10, 20, 30, 40, and 50 °C), for 60 min, at the end of the period, after centrifugation, it was analyzed by using Atomic Absorption Spectrometer (Shimadzu AA-680). The concentrations of heavy metal ions were determined using an atomic absorption spectrophotometer before and after biosorption. Biosorption efficiency was expressed as:
Formula1
where Ci and Ce are the initial and residual concentrations of metal ion, respectively. The amount of adsorbed heavy metal ions per unit of biosorbent (mg g-1) was obtained by using the following expression:
Formula2
where q is the amount of heavy metal adsorbed onto the unit amount of the biomass (mg g-1), C0 and Ce are the concentrations of the heavy metal in the initial and equilibrium solution (mg L-1) and after biosorption, respectively and V is the volume of the aqueous phase (L) and finally m is the amount of the biomass (g).
Results and Discussion
There are different factors that affect the adsorption of lead by biomass used in this process. Some of them are selected as suitable initial pH, concentration of lead, contact time and concentration of biomass. It is very important to optimize them in order to obtain good removal and strategy forms.
Factorial Design
A two level factorial 24 design with two replicates of center point is performed in order to determine the influence of these factors on their interactions. The factorial design is evaluated using analytical response (removal of lead from aqueous solution). The experimental matrix and the removal for each trial are shown in Table 1. An analysis of the variance (ANOVA) demonstrated that, within the experimental range, pH, contact time and concentration of biomass were statistically significant and Pareto chart (see Fig. 1) interpretation it.
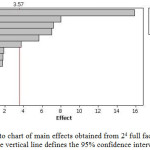 |
Figure 1: Pareto chart of main effects obtained from 24 full factorial designs. The vertical line defines the 95% confidence interval. Click here to View figure |
Table 1: Experimental design and the results obtained in removal.
|
Number |
pH |
Time of contact / min |
Clead / ppm |
CBiomass / ppm |
Removal / % |
|
1 |
6 |
60 |
100.0 |
10.0 |
91.3 |
|
2 |
6 |
60 |
100.0 |
1.0 |
66.3 |
|
3 |
6 |
10 |
100.0 |
10.0 |
74.9 |
|
4 |
2 |
10 |
100.0 |
10.0 |
51.3 |
|
5 |
6 |
10 |
100.0 |
1.0 |
62.3 |
|
6 |
2 |
60 |
100.0 |
1.0 |
56.8 |
|
7 |
2 |
10 |
5.0 |
10.0 |
56.8 |
|
8 |
6 |
10 |
5.0 |
10.0 |
84.6 |
|
9 |
4 |
35 |
52.5 |
5.5 |
68.4 |
|
10 |
2 |
10 |
100.0 |
1.0 |
59.8 |
|
11 |
6 |
60 |
5.0 |
1.0 |
72.3 |
|
12 |
2 |
10 |
5.0 |
1.0 |
51.6 |
|
13 |
2 |
60 |
5.0 |
1.0 |
66.1 |
|
14 |
6 |
60 |
5.0 |
10.0 |
75.6 |
|
15 |
2 |
60 |
5.0 |
10.0 |
59.4 |
|
16 |
6 |
10 |
5.0 |
1.0 |
64.8 |
|
17 |
2 |
60 |
100.0 |
10.0 |
63.5 |
Box-Behnken design
The optimum conditions for maximizing the adsorption of lead by Fagus Orientalis Lipsky were determined by means of a three factor, three level Box-Behnken experimental designs combining with response modeling. The significant variables like pH; contact time and concentration of biomass are chosen as the critical variables and designated as pH, time of contact and CBiomass, respectively. The low, middle and high levels of each variable were designated as -, 0 and + respectively, are given in Table 2.
Table 2: The levels of variables chosen for the trials.
| Variable |
Low level (-) |
Middle level (0) |
High level (+) |
| pH |
2.0 |
4.0 |
6.0 |
| Time (min) |
10.0 |
35.0 |
60.0 |
| CBiomass (ppm) |
1.0 |
5.5 |
10.0 |
The actual design of experiments is given in Table 3. In a system involving three significant independent variables, the mathematical relationship of the response on these variables can be approximated by the quadratic polynomial equation:
Y = b0 + b1 pH + b2 Time + b3 CBiomass + b12 pH×Time+ b13 pH×CBiomass + b23 Time×CBiomass + b11 pH2 + b22 Time2 + b33 CBiomass2 Equation 1
A multiple regression analysis is done to obtain the coefficients and the equation can be used to predict the response. The degree of experiments chosen for this study was Box-Behnken, a fractional factorial design for four independent variables. It is applicable as the critical variables have been identified. In the model given in equation (1), interactions higher than second order have been neglected. A total of 15 experiments were necessary to estimate of the full model. The results from this experimental design provided a statistical process, which was used to identify high yield trends for the removal of lead process.
Table 3: The Box-Behnken design for the optimization of the removal of lead process.
|
Number |
pH |
Contact Time / min |
CBiomass / ppm |
Removal / % |
|
1 |
2 |
35 |
10.0 |
52.1 |
|
2 |
6 |
35 |
10.0 |
87.6 |
|
3 |
4 |
35 |
5.5 |
77.2 |
|
4 |
6 |
35 |
1.0 |
71.3 |
|
5 |
6 |
60 |
5.5 |
88.3 |
|
6 |
4 |
60 |
10.0 |
79.5 |
|
7 |
4 |
10 |
1.0 |
54.3 |
|
8 |
2 |
35 |
1.0 |
49.8 |
|
9 |
6 |
10 |
5.5 |
87.6 |
|
10 |
4 |
35 |
5.5 |
79.3 |
|
11 |
2 |
10 |
5.5 |
49.8 |
|
12 |
4 |
10 |
10.0 |
58.6 |
|
13 |
4 |
60 |
1.0 |
57.6 |
|
14 |
2 |
60 |
5.5 |
48.6 |
|
15 |
4 |
35 |
5.5 |
52.3 |
Table 3 shows the matrix with coded and the responses for removal of lead from aqueous solutions. The equation below illustrates the relationship among the three variables.
A = 34.2731 + 4.2599 (pH) + 0.0739 (Time) + 1.6551 (CBiomass) + 0.2094 (pH)2 – 0.0029 (Time)2 – 0.2586 (CBiomass)2 + 0.0095 (pH)(Time) + 0.3888 (pH)(CBiomass) + 0.0391 (Time)(CBiomass) Equation 2
The critical points in the surface response are found by solving the derivation of equation 2 for the condition of d(R)/d(pH) = 0, d(R)/d(Time) = 0 and d(A)/d(Cbiomass) = 0. The calculated values for the critical point are: pH = 5.0, Time = 60 min and CBiomass = 10 ppm (Fig. 2).
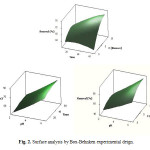 |
Figure 2: Surface analysis by Box-Behnken experimental deign. Click here to View figure |
Thermodynamic parameters such as Gibbs free energy change (∆G°), enthalpy change (∆H°) and entropy change (∆S°) can be estimated using equilibrium constants changing with temperature.15,16The experiments were carried out at 10, 20, 30, 40, and 50 °C and the other parameters were kept constant. The Gibbs free energy change of the sorption reaction is given by the following:
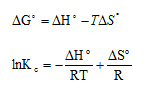
The enthalpy (∆H°) and entropy (∆S°) can be obtained from the slope and intercept of a van’t Hoff equation of ∆G° versus T:
where ∆G° is standard free energy change (J), R the universal gas constant (8.314 J mol.-1 K-1) and T is the absolute temperature (K). Using above equation, standard enthalpy and the entropy changes of sorption process were determined from the ln kc versus 1/T (Fig. 3 and Table 4).
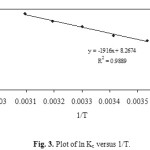 |
Figure 3. Plot of ln Kc versus 1/T. Click here to View figure |
Table 4: Thermodynamic parameters for removal of lead from aqueous solution.
|
Temperature |
DG°(kj mol-1) |
DH°(kj mol-1) |
DS °(j mol -1k-1) |
|
25 ◦C |
-4.56 |
15.92 |
68.73 |
Equilibrium Studies
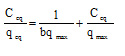
Equilibrium studies for any process of removal are of immense importance, especially to recommend the process for large-scale application. The equilibrium studies for the present process were carried out by using Langmuir and Freundlich isotherms models.17-19 The Langmuir equation, which has been successfully applied to many adsorptions, is given by:
![]()
where qeq adsorbent metal ion quantity per gram of biomass at equilibrium (mg g-1), qmax the maximum amount of metal ion per unit weight of biomass to form a complete monolayer on the surface bound (mg g-1) and b a constant related to the affinity of the binding sites (l mg-1). qm and b are calculated from the slope and intercept of the straight lines of plot Cq/qeq versus Ceq. A linear plot of Ceq/qeq versus Ceq is obtained for adsorbent as shown in Fig. 4.
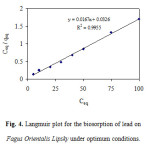 |
Figure 4: Langmuir plot for the biosorption of lead on Fagus Orientalis Lipsky under optimum conditions. Click here to View figure |
Further, Langmuir model is based on assumption that adsorption takes place at specific homogenous sites at and within the adsorbent. The model has been used to explain many adsorption processes successfully. The values of the Langmuir parameters namely, qmax, the term related to the capacity of adsorption and, b, the term related to energy of adsorption were found to be 0.51 mg g-1. The Freundlich model is an empirical equation used to estimate the adsorption intensity of the sorbent towards the adsorbate. Freundlich model equation is of the form:
Formula5where KF and n are the Freundlich’s constants related to the adsorption capacity and adsorption intensity of the adsorbent characteristics of the system . KF and n can be determined from the linear plot of log q eq versus log Ceq, Fig. 5.
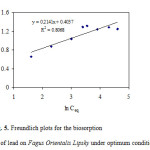 |
Figure 5: Freundlich plots for the biosorption of lead on Fagus Orientalis Lipsky under optimum conditions. Click here to View figure |
The linearized Langmuir and Freundlich isotherms obtained for lead for this biomass is presented in Figs. 4 and 5. The Langmuir and Freundlich adsorption constants calculated from the corresponding isotherms and their respective coefficients are presented in Table 5.
Table 5: Adsorption isotherm parameters for adsorption of lead by Fagus Orientalis Lipsky.
|
Isotherm model |
Adsorption isotherm parameters |
Lead |
|
Langmuir |
qmax (mg g-1) b (l mg-1) r2 |
59.88 0.51 0.9955 |
|
Freundlich |
KF n r2 |
2.24 4.67 0.8068 |
Both isotherms consider qeq as a function of Ceq, corresponding to the equilibrium distribution of ions between aqueous and solid phases as the initial metal ion concentration increases. The values of r2 are regarded as a measure of goodness-of-fit of experimental data to the isotherm models. As seen from Table 5, Langmuir modeling exhibited a better fit to the data for this metal therefore; biosorption process in this study may be interpreted as monolayer adsorption. According to Langmuir model, sorption occurs uniformly on the active sites of the sorbent, and as a sorbent occupies a site, no further sorption can take place at this site.
Regeneration of Biomass
The regeneration of the biosorbent is of crucial importance in assessing the potential for commercial application. Desorption of lead from the metal loaded Fagus Orientalis Lipsky tree leaves using 0.1 mol L-1 HCl which is one of the most effective desorbent,resulted in 90% recovery of this metal ion for Fagus Orientalis Lipsky tree leaves. In order to show the reusability of the sorbents, adsorption–desorption cycle of lead was repeated three times using the same preparations. The adsorption efficiency of this sorbent did not noticeably change and only a maximum of 10% decrease was observed after three cycles. This may be due to the small amount of biomass lost during the repeated adsorption–desorption operations. The regeneration of this biomass shows that biosorption–desorption is a reversible process.
Conclusion
In present study the biosorption properties of Fagus Orientalis Lipsky powdered leaf were studied for removal of lead from aqueous solutions. The results obtained show that initial of pH, contact time and concentration of biomass highly affect the uptake of the biosorbent. The Langmuir adsorption model and Freundlich equation were used for mathematical descriptions of the biosorption of lead on to Fagus Orientalis Lipsky tree leaves. It was found that the adsorption equilibrium data fitted well to the Langmuir model. Thermodynamic parameters ∆H°, ∆S° and ∆G° were estimated and these parameters show that adsorption is exothermic, favorable and spontaneous. Furthermore, the Fagus Orientalis Lipsky tree is grown widely in Iran, the leaves have no commercial value and is a good, inexpensive source of readily available biomaterial.
Acknowledgement
The authors gratefully acknowledge the support to this work from Islamic Azad University, Arak Branch research council.
References
- Seiler H.G., Sigel A. and Sigel H., Handbook on Toxicity of Inorganic Compounds, Marcel-Dekker, New York (1998)
- Yadanaparthi S.K.R., Graybill D. and Wandruszka R.V., J. Hazard. Mater., 171: 1 (2009)
- Ngomsik A.F., Bee A., Siaugue J.M., Talbot D., Cabuil V. and Cote G., J. Hazard. Mater., 166: 1043 (2009).
- Wang J. and Chen C., Biotech. Adv., 27: 195 (2009).
- Yin P., Xu W., Qu R., Zhao G. and Sun Y., J. Hazard. Mater., 173: 710 (2010).
- Hota G., Kumar B.R., Ng W.J. and Ramakrishna S., J. Mater. Sci., 43: 212 (2008).
- Afkhami A. and Conway B.E., J. Colloid Interface Sci., 251: 248 (2002).
- Afkhami A., Madrakian T., Amini A. and Karimi Z., J. Hazard. Mater., 150: 408 (2008).
- Pacheco S., Tapia J., Medina M. and Rodriguez R., J. Non-Cryst. Solids, 352: 5475 (2006).
- Afkhami A., Sber-Tehrani M. and Bagheri H., J. Hazard. Mater., 181: 836 (2010).
- Montgomery D.C., Design and Analysis of Experiments, fourth ed., Wiley, New York (1997).
- Ferreira H.S., Santos A.C.N., Portugal L.A. and Costa A.C.S., Talanta, 77: 73 (2008).
- S.L.C. Ferreira, M.A. Bezerra,W.N.L. dos Santos, B.B.Neto, Talanta, 61: 295 (2003).
- Khajeh K., J. Hazard. Mater., 172: 385 (2009).
- Smith J. and van Ness H., Introduction to Chemical Engineering Thermodynamics, fourth ed., McGraw-Hill, Singapore (1987).
- Tewari N., Vasudevan P. and Guha B., Biochem. Eng. J., 23: 185 (2005).
- Sharma Y.C. and Weng C.H., J. Hazard. Mater., 142: 449 (2007).
- Li Y., Wang J., Luan Zh. and Liang Z., J. Hazard. Mater., 177: 131 (2010).
- Hu Zh., Chen H. and Yuan Sh., J. Hazard. Mater., 173: 292 (2010).

This work is licensed under a Creative Commons Attribution 4.0 International License.
![]()
A New Edition of Web of Science
Journal Impact Factor
2022: 0.5
Five Year: 0.8
Journal is Indexed in

Cabells Whitelist
![]()


