Optimal Decolorization Efficiency of Indigo Carmine by TiO2/UV Photocatalytic Process Coupled with Response Surface Methodology
Abdelhadi Abaamrane1, 2, Samir Qourzal2 , Noureddine Barka3 *, Saïd Mançour Billah1 , Ali Assabbane2 and Yhya Ait-Ichou2
1Laboratoire de Génie des Procédés, Département de Chimie, Faculté des Sciences, Université Ibn Zohr, B.P. 8106 Cité Dakhla, Agadir, Morocco.
2Equipe de Matériaux, Photocatalyse et Environnement, Département de Chimie, Faculté des Sciences, Université Ibn Zohr, B.P. 8106 Cité Dakhla, Agadir, Morocco.
3Equipe de Recherche Gestion de l’Eau et Développement Durable (GEDD), Faculté Polydisciplinaire de Khouribga, Université Hassan 1er, Hay Ezzaitouna, B.P. 145 Khouribga, Morocco
Experimental design methodology was applied for the optimization of indigo carmine dye photocatalytic degradation by supported TiO2 and UV light in a flow reactor. The variables considered were the initial concentration, pH, volume of solution and recirculation flow rate. The effects of individual variables and their interaction effects for the photocatalytic degradation efficiency (%) were determined. From statistical analysis, the most effective parameters were pH and initial concentration. The optimized condition of the photocatalytic degradation of indigo carmine were; initial concentration, 4 mg L-1; pH, 3; volume of solution, 2540 mL; recirculation flow rate, 400 mL min-1.
KEYWORDS:Indigo carmine; Photocatalytic degradation; Experimental design; Response surface methodology (RSM)
Download this article as:| Copy the following to cite this article: Abaamrane A, Qourzal S, Barka N, Billah S. M, Assabbane A, Ait-Ichou Y. Optimal Decolorization Efficiency of Indigo Carmine by TiO2/UV Photocatalytic Process Coupled with Response Surface Methodology. Orient J Chem 2012;28(3). |
| Copy the following to cite this URL: Abaamrane A, Qourzal S, Barka N, Billah S. M, Assabbane A, Ait-Ichou Y. Optimal Decolorization Efficiency of Indigo Carmine by TiO2/UV Photocatalytic Process Coupled with Response Surface Methodology. Available from: http://www.orientjchem.org/?p=11856 |
Introduction
Textile manufacturing is one of the largest producers of wastewaters. It is also a chemically intensive industry and therefore textile wastewaters contain processing bath residues from preparation, dyeing, finishing, slashing and other operations. These residues can cause environmental pollution if they are not properly treated before discharge to the environment1,2. Dyes are highly colored molecules and are very difficult to decompose biologically. Indigo carmine (IUPAC name 3,3’-dioxo-2,2’-bis-indolyden-5,5’-disulfonic acid disodium salt) is popularly known as disodium salt of indigotin 5,5 disulphonic acid, FD & C Blue 2 or Acid Blue W. Apart from its use as textile coloring agent and additive in pharmaceutical tablets and capsules as well as in confectionery items, indigo carmine is also used for medical diagnostic purposes3. It is considered as a highly toxic indigoid class of dyes. Its contact can cause skin and eye irritations to human being. It can also cause permanent injury to cornea and conjunctiva4. The consumption of the dye can also prove fatal, as it is carcinogenic and can lead to reproductive, developmental, neuron and acute toxicity5. It has also been established that the dye leads to tumors at the site of application6.
Numerous physical and chemical processes have been investigated for dye removal from wastewater such as adsorption7,8, coagulation-flocculation9, biosorption10, ultrafiltration11 and photocatalytic degradation12,13. Amongst these numerous techniques of dye removal, photocatalytic degradation (one kind of Advanced Oxidation Processes AOPs) is a procedure of choice for the removal of organic compounds from wastewater, and so, a useful tool for protecting the environment14.
In conventional photocatalytic methods, the experiments are usually conducted by varying some studied parameters while keeping others constant. To avoid repeating this process for all influential parameters, factorial design is an experimental strategy that allows the simultaneous manipulation of many factors, possible synergistic and antagonistic interactions between them that are determined15,16. In addition, system optimization can be attained performing a smaller number of experiments than that needed for invariant techniques resulting in lower reagent consumption and considerably less laboratory work. Response surface methodology (RSM) is an experimental technique invented to optimize response within the specified ranges of the factors17,18. RSM was applied to design and formulate new processes and products. The results have been satisfactory in studies that involve the application in the photocatalytic degradation of organic compounds19-21.
The objective of this study is: (i) to determine the optimal experimental conditions for indigo carmine photocatalytic degradation by supported TiO2 and UV light in a flow reactor using RSM. (ii) To examine both single and combined effects among independent variables of indigo carmine concentration, pH, volume of solution and recirculation flow in the reactor.
Experimental
Reagents
The photocatalyst used in this study was a commercial titania photocatalyst from Ahlstrom firm (France). It consists in PC500 titania by Millennium inorganic chemicals (anatase: >99%, specific surface area 350–400 m2g−1, crystallites mean size = 5–10 nm). Titania PC500 was coated on non-woven fibers (natural and synthetic fibers 254 μm of thickness). Indigo carmine (C16H8O8N2S2Na2) was obtained from Labosi and used as received without further purification. Solutions were prepared by dissolving requisite quantity of the dye in distilled water. The pH was adjusted to a given value by addition of HCl (1N) or NaOH (1N) (analytical grades) and was measured using a Schott titroline (TE96) pH-meter.
Apparatus and analysis
Photocatalytic experiments were performed in a well stirred, cylindrical photoreactor with a total volume of 1 L (Fig.1). The reactor is made of glass and does not contain any metal parts. The reactor has inlets for feeding reactants, and ports for measuring temperature and withdrawing samples. The reactor was covered inside with (11cm x 25cm) of the photocatalyst and was exposed to a luminous source (a HPK 125W Philips ultraviolet lamp with a wavelength maximum of 365 nm), placed in axial position inside a quartz sleeve. The recirculation flow rate was controlled by a peristaltic pomp. The agitation was assured by means of a magnetic stirrer placed at the reactor base.
The dye aqueous solutions were filtered by Millipore membrane filter type 0.45 µm HA, and the concentrations were determined from UV–vis absorbance characteristic with the calibration curve method sing A Jenway 6405 UV/visible spectrophotometer at 610 nm.
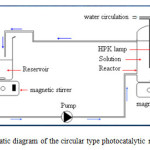 |
Figure 1: Schematic diagram of the circular type photocatalytic reactor system. |
Experimental design
In this study, a 24 full factorial experimental design was employed to fit a second-order polynomial model. The general equation of the second degree polynomial is stated as follows:
(2)
Where Y is the dependent variable (response variable) to be modeled, Xi and Xj are the independent variables (factors), ao, ai, aij are regression coefficients and e is the error.
With four factors, 24 factorial designs require 16 runs. Meanwhile, the number of coefficients of ai,i =0. . .16 to be estimated is 16.
According to preliminary experiments carried out to screen the appropriate parameters and to determine the experimental domain. Initial indigo carmine concentration (X1), pH (X2), Volume of solution (X3) and recirculation flow rate (X4) were foreseen as affecting the dye decolourization. Minimum and maximum levels of each factor are reported in Table 1.
The analysis of results was performed with statistical and graphical analysis software (Design Expert® Software (Version 8.0.4.1) of Stat-Ease Inc., USA).
Table 1: Factors and levels used in the 24 factorial design study.
| Parameter name |
Code |
Low (-1) |
High (+1) |
| initial concentration (mg L-1) |
X1 |
4 |
20 |
| pH |
X2 |
3 |
9 |
| Volume of solution (mL) |
X3 |
2540 |
2940 |
| Recirculation flow rate (mL min-1) |
X4 |
200 |
400 |
Results and discussion
Experimental results and its evaluation
Experimental results obtained in the photocatalytic experiments are presented in Table 2. To analyze the effect of changes in parameters involved, a first-order model with all possible interactions was chosen to fit the experimental:
Y = a0 + a1X1 + a2X2 + a3X3 +a4X4 + a12X12 + a13X13 + a23X23 + a14X14 + a24X24 + a34X34 + a123X123 + a124X124 + a134X134 + a234X234 + a1234X1234 (3)
The adequacy of the model is tested by the method of analysis of variance (ANOVA) to fit the response function (photocatalytic degradation efficiency) with the experimental data. The final regression equation, after putting values of all coefficients, is as follows:
Ycal = 69,11875 – 7,65750 X1 – 20,04875 X2 – 1,78625X3 – 0,94000X4 + 0,19500 X12 – 4,63000 X13 + 0,20625 X23 – 3,50875X14 – 1,73000 X24 – 1,01500 X34 – 4,99250 X123 – 1,31875 X124 + 4,62875 X134 – 4,59500 X234 + 3,40375 X1234 (4)
The fit of the model was further checked by the coefficient of determination R2. The R2 value is always between 0 and 1. The closer its R2 value is to 1, the better the model predicts the response22. In this model, the value of R2 was evaluated as 0.99986 indicating that 99.98 % of the variability in the response could be explained by the model.
Table 2: Experimental design matrix, experimental results and predicted photocatalytic degradation efficiency (%) for indigo carmine.
|
Experiment |
X1 |
X2 |
X3 |
X4 |
Y (Experimental) |
Y (Predicted) |
Residue |
|
1 |
-1 |
-1 |
-1 |
-1 |
98,75 |
98,34875 |
0,40125 |
|
2 |
+1 |
-1 |
-1 |
-1 |
89,15 |
89,13875 |
0,01125 |
|
3 |
-1 |
+1 |
-1 |
-1 |
32,69 |
33,09125 |
-0,40125 |
|
4 |
+1 |
+1 |
-1 |
-1 |
62,73 |
62,74125 |
-0,01125 |
|
5 |
-1 |
-1 |
+1 |
-1 |
89,33 |
89,34125 |
-0,01125 |
|
6 |
+1 |
-1 |
+1 |
-1 |
76,28 |
76,68125 |
-0,40125 |
|
7 |
-1 |
+1 |
+1 |
-1 |
76,06 |
76,04875 |
0,01125 |
|
8 |
+1 |
+1 |
+1 |
-1 |
35,48 |
35,07875 |
0,40125 |
|
9 |
-1 |
-1 |
-1 |
+1 |
100,00 |
99,59875 |
0,40125 |
|
10 |
+1 |
-1 |
-1 |
+1 |
76,74 |
76,72875 |
0,01125 |
|
11 |
-1 |
+1 |
-1 |
+1 |
64,29 |
64,69125 |
-0,40125 |
|
12 |
+1 |
+1 |
-1 |
+1 |
42,89 |
42,90125 |
-0,01125 |
|
13 |
-1 |
-1 |
+1 |
+1 |
100,00 |
100,01125 |
-0,01125 |
|
14 |
+1 |
-1 |
+1 |
+1 |
83,09 |
83,49125 |
-0,40125 |
|
15 |
-1 |
+1 |
+1 |
+1 |
53,09 |
53,07875 |
0,01125 |
|
16 |
+1 |
+1 |
+1 |
+1 |
25,33 |
24,92875 |
0,40125 |
A graph of the actual response values versus the predicted response values are shown in Fig.3. Actual values are the experimental response data for a particular run, and the predicted values were evaluated from the model and generated by using the approximating function. As can be seen in the Fig.3, the experimental results are in good agreement with the values calculated by the first-order polynomial equation.
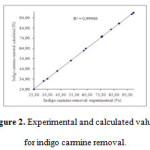 |
Figure 2: Experimental and calculated values for indigo carmine removal. |
Fig.4 shows the residual value and the order of the corresponding observations. This plot can be helpful to a designed experiment in which the runs are not randomized. For residual activity data, the residuals appear to be randomly scattered about zero. No evidence exists that the regression terms are correlated with one another.
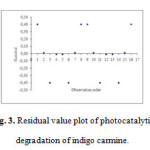 |
Figure 3: Residual value plot of photocatalytic degradation of indigo carmine. Click here to View figure |
Analysis of RSM
To investigate the individual and interactive effect of these four factors on the indigo carmine removal efficiency, three dimensional and contour plots were drawn and the inferences thus obtained are discussed. The response surface graphs of indigo carmine removal are shown in Fig.5-8. It can be shown the figures that a strong interaction exists among indigo carmine concentration, pH, volume of solution and the recirculation flow rate.
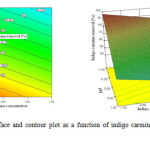 |
Figure 4: Response surface and contour plot as a function of indigo carmine concentration and pH. Click here to View figure |
Fig. 5 shows the effect of indigo carmine concentration and pH value on indigo carmine removal efficiency. The response surface of indigo carmine removal efficiency gradually increased with decreasing indigo carmine concentration from 20mg L-1 to 4mg L-1. The maximum value of photocatalytic degradation determined was 98 % at an indigo carmine concentration of 4mg L-1 and pH of 3.
It is evident that the photocatalytic degradation rate depends on the initial concentration of the dye. At high dye concentration, the adsorbed dye molecules may occupy all the active sites of TiO2 surface and this leads to decrease in degradation efficiency. Since the lifetime of hydroxyl radicals is very short (only a few nanoseconds), they can only react at or near the location where they are formed23. A high dye concentration logically enhances the probability of collision between organic mater and oxidizing species, leading to an increase in the decolorization efficiency.
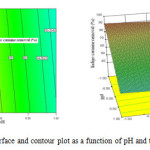 |
Figure 5: Response surface and contour plot as a function of pH and the volume of solution. Click here to View figure |
Fig. 6 shows the effect of pH value and volume of solution on indigo carmine removal efficiency. The response surface of indigo carmine removal efficiency gradually increased with decreasing volume of solution from 2940 mL to 2540 mL. The maximum value of photocatalytic degradation determined was 90 % at pH value of 3 and 2540mL in the volume of solution.
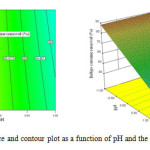 |
Figure 6: Response surface and contour plot as a function of pH and the recirculation flow rate. Click here to View figure |
Fig. 7 shows the effect of pH and the recirculation flow rate on indigo carmine removal efficiency. The response surface of indigo carmine removal efficiency gradually increased with decreasing pH value from 9 to 3. The maximum value of photocatalytic degradation determined was 90 % at pH value of 3 and 400 mL min-1 in recirculation flow rate. The figure indicates that the decolorization efficiency of dye is higher in acidic medium and decrease with increasing pH. This result may be due to the influence of the solution pH on both the surface state of TiO2 and the ionization state of dye molecules.
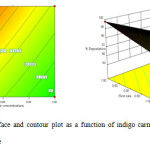 |
Figure 7: Response surface and contour plot as a function of indigo carmine concentration and recirculation flow rate. Click here to View figure |
Fig. 8 shows the effect of indigo carmine concentration and the recirculation flow on indigo carmine removal efficiency. The response surface of indigo carmine removal efficiency gradually increased with increasing recirculation flow rate from 200 mL min-1 to 400 mL min-1. The maximum value of photocatalytic degradation determined was 98 % at 4mg L-1 in indigo carmine concentration and 400 mL min-1 in recirculation flow rate.
These results indicate that, pH and indigo carmine concentration the most significant factors affecting the decolorization efficiency of indigo carmine. The maximum photocatalytic degradation efficiency of indigo carmine obtained in this study was found to be 100 %, corresponding to the operating conditions of 4 mg L-1, 3, 2540 mL and 400 mL min-1, respectively, for the indigo carmine concentration, pH, volume of the solution and recirculation flow rate.
Conclusions
This study showed that factorial experimental design approach could successfully be used to develop empirical equation for the prediction and understanding of indigo carmine photocatalytic degradation efficiency. As observed, the most effective parameters in the photocatalytic degradation efficiency were indigo carmine concentration and pH value. Maximal indigo carmine removal efficiency of 100 % was obtained at the optimum conditions as follows: indigo carmine concentration (4 mg L-1), pH value (3), volume of solution (2540 mL) and recirculation flow rate (400 mL min-1). These results implicate that the optimization using a response surface methodology based on the full factorial design can save the time and effort by the estimation of the optimum conditions of the maximum removal of dye.
References
- EPA, Best management practices for pollution prevention in the textile industry, EPA625R96004, Ohio, (1996).
- EPA, EPA Office of Compliance Sector Notebook Project: Profile of the textile industry, EPA310R97009, Washington, (1997).
- Mittal A., Mittal J. and Kurup L., J. Hazard. Mater., B137, 591 (2006).
- Barka N., Assabbane A., Nounah A. and Ait-Ichou Y., J. Hazard. Mater., 152, 1054 (2008).
- Jenkins C.L., Arch. Environ. Health 40 (1978) 7.
- Costa L.L. and Prado A.G.S., J. Photochem. Photobiol. A: Chem., 201, 45 (2009).
- Barka N., Qourzal S., Assabbane A., Nounah A. and Ait-Ichou Y., J. Saudi Chem. Soc., 15, 263 (2011).
- Barka N., Qourzal S., Assabbane A., Nounah A., Lachheb H., Houas A. and Ait-Ichou Y., Arab. J. Sci. Eng., 35(2A), 131 (2010).
- Aber S., Salari D. and Parsa M.R., Chem. Eng. J., 162, 127 (2010).
- Barka N., Abdennouri M. and EL Makhfouk M., J. Taiwan Inst. Chem. Eng., 42, 320 (2011).
- Lau W-J. and Ismail A.F., Desalination, 245 321 (2009).
- Barka N., Qourzal S., Assabbane A., Nounah A. and Ait-Ichou Y., Chem. Eng. com. 198, 1233 (2011).
- Barka N., Qourzal S., Assabbane A., Nounah A. and Aît-Ichou Y., J. Environ. Sci., 20(9), 1268.
- Dabrowski A., Adv. Colloid. Int. Sci. 93, 135 (2001).
- Antony J. and Roy R.K., Quality Assurance, 6, 87 (1999).
- MontgomeryD.C., Design and Analysis of Experiments: Response Surface Method and Design, : John Wiley and Sons, New Jersey (2005).
- Liu H-L. and Chiou Y-R., Chem. Eng. J., 112, 173 (2005).
- Zhang J., Fu D., Xu Y. and Liu C., J. Environ. Sci., 22, 1281 (2010).
- Rauf M.A., Marzouki N. and Kbahti B.K., J. Hazard. Mater., 159, 602 (2008).
- Barka, N., Abdennouri M., Boussaoud A., Galadi A., Baâlala M., Bensitel M., Sahibed-Dine A., Nohair K. and Sadiq M., Arab. J. Chem., doi:10.1016/j.arabjc.2010.12.015.
- Cho I.H. and Zoh K.D., Dyes Pigm., 75, 533 (2007).
- Fu J.F., Zhao Y.Q. and Wu Q.L., J. Hazard. Mater., 144, 499 (2007).
- Barka N., Qourzal S., Assabbane A., Nounah A. and Ait-Ichou Y., Arab. J. Chem. 3, 279 (2010).

This work is licensed under a Creative Commons Attribution 4.0 International License.
![]()
A New Edition of Web of Science
Journal Impact Factor
2022: 0.5
Five Year: 0.8
Journal is Indexed in

Cabells Whitelist
![]()


