Determination of Ultra Trace Amounts of Silver by Gfaas After Dllme Method In Water, Plasma and Urine
Sajjd Heidary Fathabad and Siavash Hasanvandi*
Department of Chemistry, Lorestan University, Lorestan, Iran.
This paper is devoted to an investigation carried out on a simple, rapid and sensitive method, which is proposed for selective determination of ultra trace amounts of silver from water and biological samples. The method is based on highly efficient separation and pre-concentration of silver by dispersive liquid-liquid microextraction (DLLME) and determination with graphite furnace atomic absorption spectrometry (GFAAS). 1-(2-pyridylazo)-2-naphtol (PAN) was used as a silver chelating agent prior to extraction. Parameters such as type and volume of extraction solvent, type and volume of dispersive solvent, pH, extraction time and concentration of the chelating agent have been optimized. Liner range of calibration curve, detection limit and relative standard deviation were 0.2-6.0 ng mL-1, 0.02 ng mL-1 and 4.4 C/o, respectively. Silver determined successfully with this method in real samples.
KEYWORDS:Silver; 1-(2-pyridylazo)-2-naphtol (PAN); water and biological samples analysis
Download this article as:| Copy the following to cite this article: Fathabad S. H, Hasanvandi S. Determination of Ultra Trace Amounts of Silver by Gfaas After Dllme Method In Water, Plasma and Urine. Orient J Chem 2012;28(3). |
| Copy the following to cite this URL: Fathabad S. H, Hasanvandi S. Determination of Ultra Trace Amounts of Silver by Gfaas After Dllme Method In Water, Plasma and Urine. Available from: http://www.orientjchem.org/?p=22973 |
Introduction
In the recent years, pollution of the environment by heavy metals has received considerable attention. These elements accumulate in living organisms and are of high toxic potential 1. For determination of the trace amount of silver, a separation and a pre- concentration step are usually required before their analysis. This is due to their frequent low concentrations and the matrix effects in the environmental samples 2. However, liquid–liquid extraction (LLE), as the oldest pre-concentration and separation technique in analytical chemistry, is time-consuming and requires large amount of organic solvents 3. Thus, single drop microextraction (SDME) was developed as an inexpensive alternative, in which sub-mL amounts of organic solvents are used so that there is minimal exposure to toxic organic solvents and has a good enrichment factor 4. In order to break up the organic drop and air bubbled formation as the result of fast stirring, the method needs a long time to reach equilibrium and complete extraction. Graphite furnace atomic absorption spectrometry (GFAAS) is a very attractive option for the determination of trace amounts of silver in water and biological samples. However, the direct determination of trace amounts of silver in real samples with GFAAS is usually difficult due to its low level in samples. It was first reported in 2006 by Assadi and co-workers developed a novel microextraction technique, termed DLLME, which is based on a ternary component solvent system like Liquid-liquid extraction 5-7. This method uses an extracting solvent dissolved in a dispersive solvent, which is miscible with both extraction solvent and water. Methanol, acetone, acetonitrile, etc, have been used as dispersive solvents 8 .In this method, the appropriate mixture of extraction solvent and dispersive solvent is injected into the Fine droplets of extraction solvent. After extraction, phase separation is performed by centrifugation and the enriched analyte, in the sediment phase is determined by spectrometry methods. The advantages of the DLLME method are simplicity of operation, rapidity, low cost, high recover, protect the environment against additional Quantities of solvents, and enrichment factors. This method has been applied for the determination of trace organic pollutants and metal ions in the environmental and in biological samples 9.The aim of this work is to combine DLLME with GFAAS and develop a new method for the determination of trace Ag in water and biological samples. In this method, PAN, which forms complexes with metal ions and has found numerous applications in trace element separation and pre–concentration by LLE 10, SPE 11, CPE 12 and LPME 13 methods, was selected as chelating reagent. The factors influencing the efficiency of DLLME extraction and GFAAS
Experimental
Reagents and standards
Used all chemicals in this work, were of analytical reagent grade. Reagent grade cholorobenzene (C6H5Cl), carbon tetrachloride (CCl4) and chloroform (CHCl3), as extraction solvents and methanol, acetone, and acetonitrile, as disperser solvents, and PAN were purchased form Merck chemical company. Doubly distilled deionized water was used throughout. Silver nitrate and nitrate salts of other cations (all from Merck) were of the highest purity available and used without any further purification except for vacuum drying. The stock solution of AgNo3 (1000 mg L-1) were prepared by dissolving appropriate amounts of AgNo3. The chelating agent, 4×10⁻⁶ mol L-1 PAN solution, was prepared daily by dissolving the appropriate amount of PAN in methanol.
Instrumentation
Shimadzu model AA6300G atomic absorption spectrometer (Kyoto, Japan) with graphite furnace (GFA-EX7i), a silver hallow cathode lamp as radiation source (Hamamatsu photon photonics, Japan) at the 328.1 nm wavelength with a slit width of 0.5 nm, 4 mA current and deuterium background corrector, was used for measurement. An L΄vov total pyrolitic graphite platform tube (shimadzu) was used. The pyrolitic graphite platform was modified according to the procedure described in the Liang and Cao work 14. Such pre-treatment was found to be effective for at least 200 atomization to cycles of silver determination under the temperature program given in Table 1. The instrumental parameters and temperature program used for graphite atomizer are listed in Table 1. The sample injection volume was 10 µL in all experiments, and calibration solution was pipetted directly into the graphite furnace 25 s after starting the drying step in all experiments. Argon gas with 99.95℅ purity was purchased from Roham Gas Co. (Isfahan, Iran) was used as protected and purge gas. A Behdad Universal Centrifuge (Isfahan, Iran) was used for centrifugation. 2.0 mL syringe (gastight, Hamilton, Reno, NV, USA). Micropipette (Biohit, Finland).
Table. 1. The graphite furnace temperature program for silver determination
|
Argon flow rate (mL min-1) |
Hold time (s) |
Ramp time (s) |
Temperature (◦C) |
Step |
|
200 |
10 |
10 |
120 |
Drying |
|
200 |
25 |
10 |
400 |
Pyrolysis |
|
0 |
3 |
0 |
2000 |
Atomization |
|
1000 |
3 |
1 |
2300 |
Cleaning |
Sample preparation
15 ml aliquot of the plasma sample was added to a flask followed by the addition of 30 ml of acetonitrile and shaken for few second. Then 30 ml of this mixture was transferred into screw cap falcon test tube and then centrifuged at 5000 rpm for 10 min. 12 ml of upper solution used for next step. 15 ml aliquot of the urine sample was added to a flask followed by dilution with 30 ml of deionized water- acetonitrile (50:50 v/v) and shaken for few seconds. Then 30 ml of this mixture was transferred into screw cap falcon test tube and then centrifuged at 5000 rpm for 10 min. 12 ml of upper solution used for next step. Well and river were collected from the Isfahan of Iran and were analyzed by DLLME combined with GFAAS for determination of silver.
Dispersive liquid-liquid microextraction procedure
The extraction of the ultra trace silver amounts from water and biological samples into a micro-volume of the chlorobenzene (extraction solvent) was made by complexation with PAN. All 15 mL screw cap falcon test tubes with conical bottom (extraction vessel) were maintained into 0.1 mol L-1 HNO3 for cleaning of any inorganic compounds and washed with doubly distilled deionized water and then with chlorobenzene for proper sedimentation of fine droplets of the extraction solvent in the centrifuging step. 12 mL of doubly distilled deionized water at pH 9.5 were placed in a 15 mL screw cap glass test tube with a conical bottom and were spiked at the silver concentration of 1ng mL-1. 1.0 mL of methanol (dispersive solvent), containing 40 µL of chlorobenzene and 4×10⁻⁶ mol L-1 (chelating agent), were injected rapidly into a sample solution with a 2.0 mL syringe A cloudy solution (water, methanol and chlorobenzene) was formed in the test tube. In this step, the silver ions reacted with PAN and were extracted into the fine droplets of chlorobenzene. The mixture was then centrifuged for 2 min at 4000 rpm. After this process, the dispersed fine droplets of chlorobenzene were sedimented at the bottom of the conical test tube (25±1µL). 10µL of this sedimented phase were removed using a micropipette manually injected into the electrothermal atomic absorption spectrometer and submitted to the temperature, program of Table. 1.
Results and Discussions
In order to reach the optimized experimental conditions for high enrichment factor and quantitative extraction of silver ions by PAN via DLLME method, influence of different parameters such as type of extraction solvent, volume of extraction solvent, type of dispersive solvent, volume of dispersive solvent, the effect of extraction time, concentration of the chelating agent, effect of centrifugation time and effect of pH were investigated. The enrichment factor (EF) was defined as the ratio of the curve slope of pre-concentration sample to that obtained from extraction with the proposed method 15. The extraction recovery was defined as the percentage of the total amount of analyte, which was extracted into the sedimented phase.
![]()
![]()
Where Vsed, Vaq, Co and Csed are the volume of sedimented phase, volume of sample solution, initial concentration of analyte in water sample and concentration of analyte in sedimented phase, respectively.
Selection of extraction solvent
The type of extraction solvent used in DLLME is an essential consideration for efficient extraction. It should be higher density than water and have high extraction efficiency. 40 µL of Chlorobenzene (C6H5Cl), dichloromethane (CH2Cl2), chloroform (CHCl3), and carbon tetrachloride (CCl4) were studied as extraction solvents using 1.0 mL methanol containing 4×10⁻⁶ mol L-1 PAN to achieve 25 µL volume of the sediment phase at the bottom of the test tube, After centrifugation (2 min at 4000 rpm). The followed by 10 µL of sediment phase were pipette into the auto-sampler and the content is injected into the graphite tube of GFAAS respectively. The enrichment factors were 250, 195, 186, and 155 for C6H5Cl, CHCl3, CH2Cl2, and CCl4, respectively, as can be seen in Fig. 1, the results indicated there was a significant statistical difference (t- test) between the different extraction solvents. On the other hand, CHCl3 and CCl4 formed an unstable cloudy solution, and the sediment phase of CH2Cl2 was difficult to be removed by micro-syringe. Therefore, C6H5Cl was chosen as the extraction solvent in the experiment.
 |
Figure.1: Effect of type of extraction solvent on the enrichment factor of Ag in DLLME Extraction conditions: sample volume, 12.00 mL; concentration of Ag, 1.0 ng mL−1, dispersive solvent (methanol), 1.00 ml, concentration of PAN (4×10⁻⁶mol L-1). Click here to View figure |
Effect of volume of extraction solvent
In order to investigate the effect of the extraction solvent volume, solutions containing different volume of C6H5Cl (40, 45, 50, 55, 60 and 65 µL) were subjected to the same DLLME procedure. By increasing the volume of C6H5Cl from 40 to 60 µL, the enrichment factor decreased from 255 to 145, because the volume of the sediment phase increased from 25 to 40 µL. therefore, 40 µL of C6H5Cl was used as extraction solvent volume in the subsequent experiments. The results illustrated in Fig. 2.
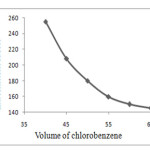 |
Figure.2: Effect of volume of chlorobenzene on the on the enrichment factor of Ag in DLLMEExtraction conditions: sample volume, 12.00 mL; concentration of Ag, 1.0 ng mL−1, extraction solvent (C6H5Cl) volume, 40 μL, dispersive solvent (methanol), 1.00 ml, concentration of PAN (4×10⁻⁶mol L-1). |
Selection of dispersive solvent
The disperser solvent most is miscible with both extraction solvent and water sample solution phases. In recent work, different solvents such as, methanol, acetone, and acetonitrile were tested. Several sample solutions were studied using 1 mL of each disperser solvent, which contains 40 µl of chlorobezene and 4×10⁻⁶ mol L-1 PAN. The obtained enrichment factors form methanol, acetone and acetonitrile, were 253, 215 and 158, respectively. It was found the enrichment factors slightly higher by using methanol, in comparison with the other disperser solvents. Therefore, methanol was used as disperser solvent in all of the subsequent experiments. Results were shown in Fig. 3.
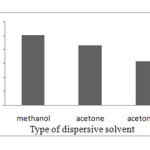 |
Figure. 3. Type of Dispersive solvent. Click here to View figure |
Effect of dispersive solvent volume
To acquire the optimized methanol volume, various experiments were conducted using different methanol volumes (0.7, 0.8, 0.9, 1.0, 1.1 and 1.2 mL). These different volumes were subjected to the same DLLME procedure. By increasing the methanol volume to 1.0 mL, the enrichment factors increased. Furthermore, the increase of the methanol volume from 0.7 to 1.2 mL did not considerably affect on the enrichment factors, as shown in Fig. 4. Therefore, an optimal volume of 1.0 ml of methanol was chosen to achieve a better and more stable cloudy solution. The obtained results illustrated in Fig .4.
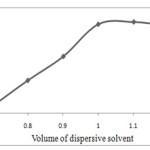 |
Figure. 4. Effect of Dispersive solvent volume Click here to View figure |
Extraction time effect
Extraction time is one of the most important factors in extraction procedures. The dependence of extraction efficiency upon extraction time was studied within a range of 0-8 min in the constant experimental conditions. In DLLME, extraction times defined as the time that the cloudy solution forms until the start of centrifugation. Fig. 5 shows the enrichment factor of silver versus extraction time. The results show that the extraction time has on significant effect on extraction efficiency. It is revealed that after formation of the cloudy solution, the surface area between extraction solvent and aqueous phase (water sample) is infinitely large. Thereby, complex formation of silver and its transition from aqueous phase (water sample) to extraction solvent is fast. Subsequently, equilibrium state is achieved quickly, so the extraction time is very short. This is the advantage of DLLME technique, low extraction time. In this method, the most time-consuming step is the centrifuging of sample solution in extraction procedure, which is about three min 16.
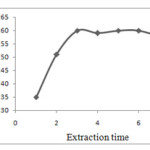 |
Figure. 5. Effect of the extraction time on the enrichment factor of silver Obtained from DLLME Click here to View figure |
Effect of PAN concentration
The effect of concentration of PAN in the range of 4×10⁻³– 4×10⁻⁸ mol L-1 on analytical signal were investigated. The influence of PAN concentration was carried out in which the other experimental variables remained constant. The results show that by increasing the concentration of PAN the absorbance increases, as shown in Fig. 6. It seems that slight reduction of extraction in high concentration of PAN is due to the extraction of PAN itself, which can easily saturate the small volume of extraction solvent. Also at high concentration of PAN (4×10⁻⁶mol L-1) the background absorbance increases. Therefore the amount of considerably PAN was selected to prevent background absorbance and diverse ion interferences.
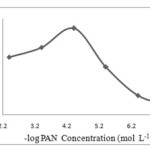 |
Figure. 6. Effect of the amount of PAN on the enrichment factor of silver obtained from DLLME Click here to View figure |
Effect of centrifugation time
Effect of centrifugation time in the range of 2- 5 were investigated. The obtained results show the peak areas gradually constant after 2 min the prolongation of centrifugation time. Thus, 2 min was selected as optimum time of centrifugation.
Effect of pH
pH can play an important role in the producing extractable species from ionic analytes prior to extraction by DLLME. In this study 1-(2-pyridylazo)-2-naphtol (PAN) was used as a complexing agent for Ag ions to produce a neutral oxinate chelate, which is extractable into chlorobenzene. Because the production of oxinate chelate is pH dependent, DLLME was performed at different pH values in the range 2-12. The obtained results show that the pH does not influence the sedimented phase volume, as shown in Fig. 7. The production of oxinate chelate and its extraction is PH independent between PH 8 and 12. In this range, the highest EF and recovery are obtained. Therefore, PH 9.5 was selected for the following studies 17.
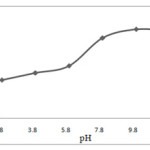 |
Figure 7. Effect of PH on the absorbance of silver obtained from DLLME Click here to View figure |
Effect of foreign ions
In order to study the effect of various cations and anions on the determination of Ag, a fixed amount of silver (1 ng mL-1), was taken with different amounts of those foreign ions, which are reported to be usually present in different silver real samples 18-20 and the recommended procedure was followed. A relative error of 5% was considered tolerable. The results are summarized in Table. 2. The results showed that none of the ions examined interfere in extraction and determination of silver, even at an interfering ion to silver ratio of 1000 and higher.
Table. 2. Effect of foreign ions on the pre-concentration and determination of silver (1 ng mL−1)
|
Extraction recovery, % |
Ion/Ag ratio |
Ion |
|
95.4 |
1000 |
Hg+2 |
|
99.8 |
5000 |
Mg+2 |
|
101.4 |
10000 |
Co+2 |
|
99.6 |
5000 |
Cr+2 |
|
97.9 |
1000 |
Ni+2 |
|
97.8 |
1000 |
Na+ |
|
94.2 |
1000 |
Cu+2 |
|
100.3 |
10000 |
Zn+2 |
|
98.6 |
5000 |
Po4-3 |
|
95.7 |
1000 |
Mn+2 |
|
102.2 |
10000 |
Fe+3 |
Analytical figures of merit
Table 3 summarizes the analytical characteristics of the optimized, including the linear range (L.R), the limit of detection (D.L) that calculated as three times the standard deviation of 10 blank measurements, divided by the slope of the calibration curve, the reproducibility and the enrichment factor. The calibration graph was linear in the silver concentration range of 0.2-6.0 ngL-1. The detection limit for the silver cation was found to be 0.02 ngL-1.Concerning the reproducibility of the method; it was evaluated with 12.00mL from the solution, containing the analyte ions in the Ag concentration of 1ng mL-1. The relative standard deviation (R.S.D.) for 6 replicate measurements was 4.4%. Finally, the high-enrichment factor of 255 was obtained for only a 12.0 mL water sample.
Table. 3. Analytical characteristics of DLLME-GFAAS for determination of Ag
|
Analytical feature |
Parameters |
|
0.2–6.0 |
Linear range (ng mL−1) |
|
0.999 |
r2 |
|
0.02 |
Limit of detection (ng mL−1) (3σ, n = 6) |
|
4.4 |
Repeatability (R.S.D.a, %) (n = 6) |
|
255 |
Enrichment factor |
|
12.0 |
Sample volume (mL) |
|
<3 |
Sample preparation time (min) |
a for which R.S.D. was obtained, Ag concentration was 1 ng mL-1
The proposed DLLME-GF AAS methodology was applied to the determination of silver in water and biological samples. The concentration of silver in the river, well, plasma and urine samples were determined to be 3.2 ngL-1, 2.1 ngL-1, 1.3 and 1.1 ngL-1, respectively (Table 4). River, well, plasma and urine samples were spiked with silver. The relative recoveries of silver from river, well, plasma and urine at spiking level of 3 ng mL-1 were 98.4, 98.0, 95.3 and 95.1%, respectively (Table 4). These results demonstrated that the matrices of the river, well and biological samples had little effect on the DLLME method for determination of silver.
Table 4. Determination of Ag in river water, well water, plasma and urine samples and
relative recovery of spiked silver in real samples.
|
Relative recovery |
Found (ng mL-1) |
Added Ag (ng mL-1) |
Concentration of Ag (ng mL-1) |
samples |
|
98.4 |
6.1 |
3 |
3.2 |
River watera |
|
98.0 |
5.0 |
3 |
2.1 |
Well waterb |
|
95.3 |
4.1 |
3 |
1.3 |
Plasma |
|
95.1 |
3.9 |
3 |
1.1 |
urine |
a Zayanderood river water, Isfahan of Iran.
b From Isfahan
Dispersive liquid-liquid microextraction combined with graphite furnace atomic absorption spectrometry allows performing the determination of silver in natural water and biological samples in a simple way. The method is simple, rapid and inexpensive. High pre-concentration factor was obtained easily through this method and a detection limit at sub µL-1 level was achieved with only 12.0 mL of sample. In this method sample preparation time as well as consumption of toxic organic solvents was minimized without affecting the sensitivity of the method. Although the obtained results in this work are related to silver determination, the system could be readily applied to the determination of other metals using various ligands, extractable by other organic solvents. Additional work is in progress on evaluating the per-formance of proposed method for the determination of other trace metal ions with spectrometric instruments.
Acknowledgment
The authors thank Dr. N. Tavakoli and Dr. M.H Meshkat for their great contributions.
REFRENCES
1.Carsek,E., Tonjes, J. W. and Scharf, M., Talanta, 56, 185 (2002).
2. Camel, V., Spectrochim. Acta. Part B., 58, 1177 (2003).
3. Hanghui, L. and Dasgupta, P.K., Anal. Chem., 68, 1817 (1996).
4. Jeannot, M.A. and Cantwell, F.F., Anal. Chem., 69, 235 (1997).
5. Berijani, S., Assadi, Y., Anbia, M., Milani-Hosseini, M. R. and Aghaee, E., J. Choromatgr. A., 1123, 1 (2006).
6. Rezaee, M., Assadi, Y., Milani Hosseini, M. R., Aghaee, E., Ahmadi, F. and Berijani, S., J. Choromatgr. A.,1116, 1 (2006).
7. Liu, P., Qiaosheng, P., Qiaoyu, S. and Zhixing, S., J. AOAC. Int., 86, 839 (2003).
8. Farajzadeh, M. A., Bahram, M. and Jönsson, J.Å., Anal. Chim. Acta., 591, 69 (2007).
9. Nagaraju, D. and Huang, S.D., J. Chromatogr. A., 1161, 89 (2007).
10. Jiang, H., Qin,Y. and Hu, B., Talanta, 74, 1160 (2008).
11. Umetani, S., Kihara, S. and Matsui, M., Anal. Chim. Acta., 232, 293 (1990).
12. Liang, P. and Fa,W., Microchim. Acta., 150, 15 (2005).
13. Liang, P., Sang, H. and Sun, Z., J. Colloid Interface Sci., 304, 486 (2006).
14. Liang, P. and Cao, J., At. Spectrosc., 28, 178 (2007).
15. Yan, X.P., Sperling, M. and Welz, B., Anal. Chem., 71, 4353 (1999).
16. Ahmadi, F., Assadi, Y., Milani Hosseini, S. M. R. and Rezaee, M., J. Chromatogr. A., 1101, 307 (2006).

This work is licensed under a Creative Commons Attribution 4.0 International License.
![]()
A New Edition of Web of Science
Journal Impact Factor
2022: 0.5
Five Year: 0.8
Journal is Indexed in

Cabells Whitelist
![]()


