Determination of Trace Amounts of Bismuth In Pharmaceutical and Water by Adsorptive Cathodic Stripping Voltammetry in the Presence of Xylenol Orange
Ateesa Yazdanipour, Ali Niazi*, Samira Kamel Foladi and Roya Tajik
Department of Chemistry, Faculty of Sciences, Islamic Azad University, Arak, Iran.
Bismuth forms the complexes with xylenol orange in the weak acidic solution. An adsorptive differential pulse stripping method for the determination of bismuth is proposed. The procedure involves an adsorptive accumulation of bismuth on a hanging mercury drop electrode (HMDE) in the presence of xylenol orange, followed by reduction of adsorbed bismuth by voltammetric scan using differential pulse modulation. The optimum experimental conditions are: xylenol orange concentration of 0.20 µg mL-1, pH 5.0, accumulation potential of -600 mV versus Ag/AgCl, accumulation time of 100 s, scan rate of 20 mV s-1 and pulse height of 100 mV. The peak current is proportional to the concentration of bismuth over range of 0.004-0.170 µg mL-1, and the detection limit is 2.0 ng mL-1. The relative standard deviations (n=3) for 0.08 µg mL-1 bismuth is 0.67%, respectively. The proposed method was applied to the determination of bismuth in pharmaceutical formulations and tap water with satisfactory results.
KEYWORDS:Bismuth; Determination; Water; Pharmaceutical; Voltammetry
Download this article as:| Copy the following to cite this article: Yazdanipour A, Niazi A, Foladi S. K, Tajik R. Determination of Trace Amounts of Bismuth In Pharmaceutical and Water by Adsorptive Cathodic Stripping Voltammetry in the Presence of Xylenol Orange. Orient J Chem 2012;28(3). |
| Copy the following to cite this URL: Yazdanipour A, Niazi A, Foladi S. K, Tajik R. Determination of Trace Amounts of Bismuth In Pharmaceutical and Water by Adsorptive Cathodic Stripping Voltammetry in the Presence of Xylenol Orange. Available from: http://www.orientjchem.org/?p=22983 |
Introduction
Bismuth is environmentally important,1 and is of biological interest due to their possible binding to thiolate ligands to form metal-thiolate clusters.2 Many electroanalytical stripping procedures have been proposed for the determination of bismuth3,4 on the bases including anodic stripping voltammetry and adsorptive cathodic stripping voltammetry. Although these procedures offer the desired sensitivity, they suffer from some practical difficulties such as formation of the intermetallic compound and the overlapping of the anodic stripping voltammograms of this metal with other ions. Sensitive methods for the determination of trace amount of bismuth have received much attention and many techniques have been employed for the determination of bismuth.
The most commonly used methods for determination of various metal ions are atomic absorption spectrometry (AAS), atomic emission spectrometry (AES) and mass spectrometry (MS).5-7 However, these techniques have some disadvantages, such as complicated operation, high cost of maintenance, expensive apparatus and requiring well-controlled experiment conditions.
In recent years, stripping voltammetry techniques, particularly anodic and adsorptive cathodic stripping voltammetry, have shown numerous advantages, including speed of analysis, good selectivity and sensitivity, and low costs of instrumentation compared with other techniques.8-14 The present investigation was prompted by a desire to develop an alternative method for determination of bismuth based on adsorptive accumulation stripping voltammetry. The present scheme, based on the accumulation and reduction of bismuth-XO complex, offers both sensitivity and selectivity, and represents an attractive alternative to conventional stripping measurements of bismuth. In particular, the present method is free from most interference of common interfering ions. The effect of various parameters including concentration of xylenol orange, pH, accumulation potential, accumulation time, scan rate and pulse amplitude in the standard solution on the sensitivity and accuracy of method were investigated. The propose methodology is fast, simple and does not generate hazardous chemical wastes, thus makes it easily possible to be used in control analysis of bismuth in pharmaceutical samples.
Experimental
Reagents and Solutions
All chemical were reagent grade chemicals, doubly distilled water was used in preparation of all solutions. Stock standard solution of bismuth, 1000 mg mL-1, was prepared by dissolving appropriate amounts of bismuth nitrate in water. More dilute solutions were prepared by diluting this solution with water. Britton-Robinson (B-R) buffer15 was prepared by dissolving appropriate amounts of boric acid, orthophosphoric acid and glacial acetic acid in water and adjusting to the desired pH value with sodium hydroxide and hydrochloric acid solutions.
Instrumentation and Software
Voltammograms were obtained by using an Autolab instrument (Eco Chemie, The Netherlands), Model PGSTAT12 processor, and a three electrodes system consisting of a HMDE (drop size of 3) as working electrode, an Ag/AgCl (3.0 M KCl) reference electrode and a carbon counter auxiliary electrode. All pH measurements were performed with a Horiba M-12 pH meter using a combined glass electrode. Solutions were deoxygenated with high-purity nitrogen for 5 min prior to each experiment.
General Procedure
The general procedure used to obtain cathodic adsorptive stripping voltammograms was as follows. All experiments were performed at room temperature. A 5 mL aliquot of buffer (B-R) solution (pH 5.0) and appropriate volumes of the xylenol orange and sample solutions were pipetted into a 25 mL volumetric flask, diluted to the mark, and transferred to the electrochemical cell. The solution was purged with nitrogen first for 5 min and then for 50 s before each adsorptive stripping step. Then an accumulation potential of -600 mV versus Ag/AgCl was applied to a fresh HMDE during stirring the solution for a period of 100 s. Following this preconcentration stirrer was stopped and after equilibrium of 10 s, the differential pulse voltammograms was recorded from 350 to 200 mV with a potential scan rate of 20 mV s-1 and pulse amplitude of 100 mV. The current was measured and recorded for the sample solution. Peak heights were evaluated as the difference between each voltammograms and the background electrolyte voltammograms. Between experiments, the cell was treated with concentrated HNO3 and then washed with acetone and distilled water. All these determinations were performed in triplicate.
Results and Discussion
Preliminary investigation
Preliminary experiments were carried out to identify the general features, which characterize the behavior of the bismuth-XO systems on hanging mercury drop electrode. Fig. 1 displays the stripping voltammograms of 0.08 mg mL-1 of bismuth in presence of xylenol orange at pH 5.0 after 100 s accumulation at -600 mV. As can be seen in Fig. 1, in the absence of xylenol orange the reduction current is rather small. Addition of 0.20 mg mL-1 xylenol orange causes an increases of the bismuth reduction current in comparison to the bismuth current (Fig. 1d).
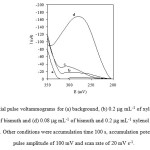 |
Figure 1: Differential pulse voltammograms for (a) background, (b) 0.2 mg mL-1 of xylenol orange, (c) 0.08 mg mL-1 of bismuth and (d) 0.08 mg mL-1 of bismuth and 0.2 mg mL-1 xylenol orange in B-R buffer (pH 5.0). Other conditions were accumulation time 100 s, accumulation potential -600 mV, pulse amplitude of 100 mV and scan rate of 20 mV s-1. Click here to View figure |
Effect of Operational Parameters
Taking into account that the differential pulse voltammetry technique was used to develop the method for quantitative determination of bismuth, and in order to choose the optimum conditions, some analytical and instrumental parameters were studied.
Effect of Chemical Variables
Fig. 2 illustrates the dependence of the peak currents on the pH of solution. The peak currents increase with increasing pH up to 5.0. However, at higher pH, the peak currents decreased with increasing pH probably due to diminished complexation ability of xylenol orange at such pH 5.0 medium. Thus, a pH of 5.0 was adopted for further studies. In order to keep the composition of the buffer constant when studying the effect of the pH, Britton-Robinson buffers were used. The concentration of xylenol orange has a significant effect on peak current. It can be seen from Fig. 3 that the peak current increases with an increase in the xylenol orange concentration up to 0.20 mg mL-1, above which it starts to decline. Therefore, 0.20 mg mL-1 xylenol orange was selected.
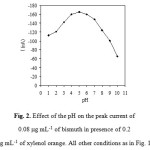 |
Figure 2: Effect of the pH on the peak current of 0.08 mg mL-1 of bismuth in presence of 0.2 mg mL-1 of xylenol orange. All other conditions as in Fig. 1. Click here to View figure |
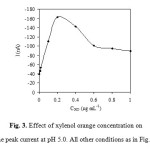 |
Figure 3: Effect of xylenol orange concentration on the peak current at pH 5.0. All other conditions as in Fig. 1. Click here to View figure |
Effect of Variation of Accumulation Potential and Accumulation Time
The accumulation potential was varied between 0.0 and -1.0 V during a constant accumulation time of 100 s. The cathodic voltammetric scan was started after an equilibrium time of 10 s without stirring to allow the electrode to equilibrate before performing the measurement process. Maximum peak currents were observed at accumulation potentials of -0.6 to -1.0 V for bismuth (Fig. 4).
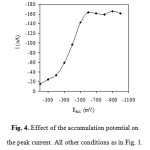 |
Figure 4: Effect of the accumulation potential on the peak current. All other conditions as in Fig. 1. Click here to View figure |
Generally, an accumulation potential of -600 mV vs. Ag/AgCl was used for further investigation. Variation of the accumulation time between 0 and 150 s at an accumulation potential of -600 mV was investigated. The influence of accumulation time on the stripping peaks of bismuth was investigated. The time required for accumulation of the bismuth complex onto the electrode depends on the concentration of the complex, less time required for higher concentrations. As mentioned before ligand concentrations that are higher than required may cause inhibition of the chelate adsorption by competitive coverage by the free ligand. An increase in the stripping peaks current with accumulation time was observed for bismuth-XO complex. As is expected for adsorption processes, the dependence of the peak current on the accumulation time is limited by the saturation of the electrode, resulting in the current reaching a plateau at high accumulation time, as shown in Fig. 5. Thus, deposition time of 100 s was used throughout, as it combines good sensitivity and relatively short analysis time. Fig5
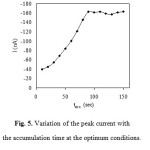 |
Figure 5: Variation of the peak current with the accumulation time at the optimum conditions. Click here to View figure |
Effect of Pulse Height and Scan Rate
The effect of pulse height on the sensitivity of the reduction current peak was also checked using different pulse heights in the range of 10 and 150 mV with the optimum conditions. The results showed that the peaks current were increased by increasing pulse height to 100 mV, and then leveled off. This is due to the fact, after 100 mV, the peak current broadened. Thus, 100 mV pulse height was selected. The influence of potential scan rate on the peak current of bismuth was studied in the range of 10-100 mV s-1 with the optimum conditions. The results showed that by increasing scan rate from 10 to 20 mV s-1, the peak currents increased linearly, whereas for higher scan rate the rate of increasing in peaks current decreased. This is due to the fact that at lower scan rate (20 mV s-1) the adsorption processes is the main of phenomena at the electrode surface, whereas at higher scan rate diffusion of the bismuth from solution to the electrode surface added to the adsorption phenomena. Therefore, a scan rate of 20 mV s-1 was selected for study.
Effect of Stirring Speed, Drop Size and Equilibrium Time
Fig. 6 shows the influence of stirring rate on the voltammetric response and also on R.S.D. It was found that peak current increased with stirring rate in the range of 500 to 2000 rpm, and levels off at higher stirring rates. The R.S.D. value decreases rapidly from 500 to 2000 rpm and then rises after 2000 rpm. This is because at lower stirring rates the solution was stirred heterogeneously and at higher speed, the solution was stirred turbulently. A stirring rate of 2000 rpm, which gave the best reproducibility, was selected. The effects of drop size and equilibrium time on the voltammetric response were examined in developing a suitable analytical procedure for the determination of bismuth. The chosen working conditions were: drop size of 3 and equilibrium time of 10 s.
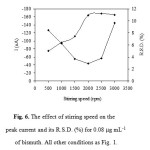 |
Figure 6: The effect of stirring speed on the peak current and its R.S.D. (%) for 0.08 mg mL-1 of bismuth. All other conditions as Fig. 1. Click here to View figure |
Reproducibility, Linear Range and Detection of the Method
The reproducibility of repeating the determination of low concentration of bismuth was found under the optimum conditions. The R.S.D. for three determinations was calculated as 0.67% for bismuth concentrations of 0.08 µg mL-1, respectively. Typical adsorptive cathodic differential pulse voltammetry and calibration graph are shown in Fig. 7. Under the optimized conditions the peak current of bismuth was found to be proportional to its concentration over the range 0.004–0.170 µg mL-1 and its equation was [current]nA = -1531.9 × [bismuth] + 3.3187. The correlation coefficient (r) was 0.9979. The detection limit16 , (where is the signal for detection limit, is the mean of blank signal, and is the standard deviation of blank signal) was obtained as 2.0 ng mL-1.
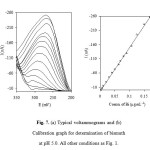 |
Figure 7: (a) Typical voltammograms and (b) Calibration graph for determination of bismuth at pH 5.0. All other conditions as Fig. 1. Click here to View figure |
 
Interferences Studies
To check the selectivity of the proposed stripping voltammetric method for determination of bismuth, various cationic and ionic ions, as potential interferents, were tested. Interference was taken as the level causing an error in excess of 5%. The results show that less than 500-fold excess of alkaline and alkaline earth metal, Cr6+, Mo6+, Th4+, Sn4+, Al3+, Ga3+, As3+, Cr3+, Fe3+, Hg2+, Mn2+, Co2+, Ni2+, Zn2+, SO42-, SO32-, NO2–, Br–, Cl–, CO32-, CN–, ClO3–, ClO4–, C2O42-; 100-fold excess of Pb2+, Cd2+, Fe2+, and 10-fold excess of Cu2+ did not interfere the determination of 0.05 mg mL-1 of bismuth. Thus, the method is highly selective and therefore, has been successfully applied to trace determinations of bismuth in various synthetic and real samples without any prior separation.
Pharmaceutical and Tap Water Samples Analysis
The proposed method was applied to the analysis of bismuth in pharmaceutical products and tap water samples. Pharmaceutical tablet solutions were prepared by dissolving each tablet in 10 mL of 0.1 mol L-1 nitric acid, heating it in a water bath to completely dissolve. Then, an aliquot of the solution was diluted to 100 mL with water, and bismuth contents were measured by the proposed method. The method was also applied to the determination of bismuth in tap water samples. The good recovery indicates the successful applicability of the proposed method for the determination of bismuth.
Table 1: Determination of bismuth in pharmaceutical and tap water samples
| Samples | Added (ng mL-1) | Determined b | S.D. c | Recovery (%) |
| Tablet 1 a | -50.0 | 48.999.1 | 0.450.61 | -100.4 |
| Tablet 2Tap waterTap Water | –20.0-50.0 | 49.38.528.312.463.1 | 0.420.140.230.130.37 | –99.0-101.4 |
a Bismuth subsalicylate tablet (50 ng mL-1 certified)
b determination according standard addition method
c standard deviation (n = 3)
Conclusuion
The present study demonstrated that the use of a HMDE for determination of trace amount of bismuth by cathodic stripping voltammetry based on adsorptive accumulation and electrochemical reduction of bismuth-XO complex on the electrode surface is feasible. Therefore the presented system offers a practical method for determination of bismuth in pharmaceutical samples, which has advantages of high sensitivity, high selectivity, simplicity and speed.
References
- M. Nimmo, G. Fones, Anal. Chim. Acta,291: 321 (1997).
- M.J. Stillman, Coord. Chem. Rev., 144: 461 (1995).
- C.M.G. van den Berg, J. Electroanal. Chem., 215: 111 (1986).
- A. Babaei, E. Shams, A. Samadzadeh, Anal. Sci., 22: 955 (2006).
- H. Matusiewicz, M. Krawczyk, Chemia Analityczna, 52: 565 (2007).
- M. Grotti, C. Lagomarsino, R. Frache, J. Anal. Atomic Spec., 20: 1365 (2005).
- F. Shemirani, M. Baghdadi, M. Ramezani, M.R. Jamali, Anal. Chim. Acta, 534: 163 (2005).
- A. Niazi, J. Ghasemi, M. Zendehdel, Talanta, 74: 247 (2007).
- J. Ghasemi, A. Niazi, R. Ghorbani, Anal. Lett., 39: 1159 (2006).
- A. Niazi, J. Chin. Chem. Soc., 54: 1195 (2007).
- T.H. Li, Q.L. Zhao, M.H. Huang, Microchim. Acta, 157: 245 (2007).
- K. Zarei, M. Atabati, H. Ilkhani, Talanta, 69: 816 (2006).
- R. Pirch, W.W. Kubiak, J. Electroanal. Chem., 599: 59 (2007).
- A. Mohadesi, M.A. Taher, Talanta, 72: 95 (2007).
- J.J. Lurie, Handbook of Analytical Chemistry, Mir Publishers, Moscow (1987).
- J.C. Miller and J.N. Millefor Analytical Chemistry, Ellis Harwood Ltd., Chichester (19

This work is licensed under a Creative Commons Attribution 4.0 International License.
![]()
A New Edition of Web of Science
Journal Impact Factor
2022: 0.5
Five Year: 0.8
Journal is Indexed in

Cabells Whitelist
![]()


