Chelating Efficacy and Corrosion Inhibition Capacity of Schiff Base Derived from 3-Formylindole
Aby Paul, K. Joby Thomas*, Vinod P. Raphael and K. S. Shaju
Associate Professor, Research Division, Department of Chemistry St. Thomas’ College (University of Calicut), Thrissur, Kerala
A novel Schiff base derived from 3-formylindole and 2-aminobenzoic acid and it’s Mn(II), Ni(II) and Cu(II) transition metal complexes were synthesized. Structure of the ligand and complexes were derived on the basis of various analytical techniques such as 1Hnmr, 13Cnmr, infrared, mass and electronic spectroscopy, elemental, magnetic and electrical studies. The corrosion inhibition capacity of the Schiff base on mild steel was screened by Electronic Impedance Spectroscopy (EIS). Investigations showed that the Schiff base act as a good corrosion inhibitor even at low concentrations. The adsorption of inhibitor on the surfaces of mild steel obeys Langmiur isotherm. Thermodynamic parameters (KADS, and DELTA;G0ADS) were calculated using Langmiur adsorption isotherm.
KEYWORDS:3-formylindole; 2-amino benzoic acid; transition metal complexes; EIS
Download this article as:| Copy the following to cite this article: Paul A, Thomas K. J, Raphael V. P, Shaju K. S. Chelating Efficacy and Corrosion Inhibition Capacity of Schiff Base Derived from 3-Formylindole. Orient J Chem 2012;28(3). |
| Copy the following to cite this URL: Paul A, Thomas K. J, Raphael V. P, Shaju K. S. Chelating Efficacy and Corrosion Inhibition Capacity of Schiff Base Derived from 3-Formylindole. Available from: http://www.orientjchem.org/?p=23193 |
Introduction
Schiff bases, are organic molecules possessing azomethine linkage (C=N), have innumerable advantages, right from pharmaceutical applications to the corrosion inhibitions, in the various fields of science. Metal complexes of Schiff bases play vital role in the development of coordination chemistry. The studies on coordination compounds of Schiff bases derived from indole carboxaldehydes are seldom reported. But in recent days scientists are more interested in these types of Schiff bases and their metal complexes1-2. The Schiff base complexes derived from 2-aminobenzoic acid are of great importance since they have potential applications in biological systems and chemical fields3-4. In the present course of investigation, a novel potential Schiff base 3-formylindole–2-aminobenzoic acid (3FI2ABA) and its transition metal complexes were synthesized and characterized using various analytical tools and physicochemical studies. The corrosion inhibition capacity of the Schiff base on mild steel in 1M HCl was screened by Electronic Impedance Spectroscopy (EIS).
Experimental
Synthesis of Ligand and Complexes
1mmol solution of 3-formylindole was dissolved in minimum amount of ethanol (R.S) and boiled. To this hot refluxing solution, equimolar solution of 2-aminobenzoic acid in ethanol was added, refluxed for 2 hours and cooled in ice. The precipitated ligand was filtered, washed with dil. alcohol (1:1) and dried over P2O5. 3-formylindole (5mmol) and 2-amino benzoic acid (5mmol) were dissolved separately in ethanol and mixed. It is then refluxed for 2 hours in a hot water bath. To this solution added an alcoholic solution of metal acetate (2.5mmol) and further refluxed for 30 minutes, concentrated by evaporation and cooled in ice. The complex precipitated was filtered, washed with water and dil. alcohol (1:1) and dried over P2O5.
Electrochemical Impedance Spectroscopy (EIS)
The EIS measurements of Schiff base were performed in a three electrode assembly. Saturated calomel electrode (SCE) was used as the reference electrode. Platinum electrode having 1cm2 area was taken as counter electrode. Mild steel (MS) specimens with an exposed area of 1cm2 were used as the working electrode. The EIS experiments were carried out on a Ivium compactstat-e electrochemical system. 1M HCl acid (no deaereation, no stirring) was taken as the electrolyte and the working area of the metal specimens were exposed to the electrolyte for 1 h prior to the measurement. EIS measurements were performed at constant potential (OCP) in the frequency range from 1 KHz to 100 mHz with amplitude of 10 mV as excitation signal. The percentage of inhibitions from impedance measurements were calculated using charge transfer resistance values by the following expression5
where Rct and R’ct are the charge transfer resistances of working electrode with and without inhibitor respectively.
Results and Discussion
Characterization of the Ligand (3FI2ABA)
The proton magnetic resonance spectrum of the ligand exhibited twelve characteristic peaks due to twelve different types of protons present in the ligand. A peak of singlet nature at 12.14δ can be assigned to the carboxylic acid proton. Proton of NH moiety present in the indole ring showed its own peak at 6.25δ as a broad singlet. Signals observed in the range 6.74-8.28 δ are due to aromatic protons of both indole and benzenoid rings. 1Hnmr data : 12.14δ, 9.94δ, 6.52δ, 6.74-8.28δ. The proton decoupled 13Cnmr spectrum of 3FI2ABA was recorded using DMSO as the solvent and the solvent peak was found at 39.43δ as septet. The sixteen carbon atoms present in the ligand are of different environment and hence showed their own characteristic signals in the spectrum. As expected, the carboxylate carbon of the Schiff base gave its characteristic signal at 185.57ppm. The azomethine carbon exhibited a sharp peak at 131.71ppm. The non equivalent carbon atoms on both aromatic rings showed their typical peaks between 110-170ppm.13Cnmr data (δvalues) : 185.57δ, 131.71δ, 110-170δ.
The molecular ion peak in the mass spectrum of the ligand, 3FI2ABA was appeared at m/z value 264. This gives a good correlation with the molecular weight of the compound. Base peak was recorded at m/z value 219 which may be due to [C15H11N2]+. radical ion. The other significant peaks exhibited in spectrum can be explained by the usual fragmentation pattern of carboxylic acids and imines. A strong band appeared in the infrared spectrum of the ligand at 1570cm-1 can be assigned to stretching frequency of azomethine group. The peaks at 1660cm-1 and 1535cm-1 may be attributed to asymmetric and symmetric stretching frequency of the carboxylate group.
The characteristic bands due to n→π* , π → π* and n→σ* transitions are exhibited by the ligand in its electronic spectrum at 26525 cm-1 28653cm-1 and 40000cm-1 respectively. The spectral studies listed above and the CHN data (C-67.88%, H-4.82%, N-9.75% ) suggest the following structure for the ligand 3FI2ABA (Fig. 1).
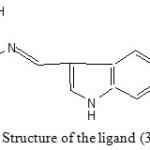 |
Figure 1: Structure of the ligand (3FI2ABA) |
Characterization of Complexes
All complexes are found to be air and light stable, non-hygroscopic, amorphous powder. The complexes are coloured and sparingly soluble in common organic solvents but appreciably soluble in more polar aprotic solvents such as dimethyl sulphoxide and dimethyl formamide. The elemental analysis, molar conductance and magnetic moment data of the complexes of the ligand (3FI2ABA) are presented in Table 1. The analytical data of the complexes show that there is 1:1 stoichiometry between metal ion and ligand. The very low value of molar conductance data (below 30ohm-1cm2mol-1) exhibited by the complexes of the Schiff base 3FI2ABA in DMSO at a concentration of 10-3 molL-1 at 28± 2 oC , indicates their non-electrolytic behavior.
Table 1: Elemental analysis, molar conductance and magnetic moment studies on Mn(II), Ni(II), Cu(II) complexes of 3FI2ABA .
|
Complex |
% C |
% H |
% N |
% Metal |
Colour |
M.P. (0C) |
Molar conductance (ohm-1 cm2mol-1) |
Magnetic moment (µeff BM) |
| [MnL (Ac)(H2O)3] |
49.2 (50.1) |
5.01 (4.60) |
6.58 (6.50) |
13.01 (12.76) |
Brown |
309 |
29 |
6.79 |
| [NiLAc(H2O)3] |
51.16 (49.60) |
4.01 (4.60) |
6.69 (6.44) |
12.36 (13.56) |
Ivory |
342 |
3 |
4.5 |
| [CuLAc(H2O)3] |
48.48 (49.09) |
3.81 (3.11) |
6.74 (6.36) |
13.98 (14.54) |
Green |
218 |
21 |
2.06 |
Magnetic moment value showed by of Mn(II) complex is 6.79BM, establishes it’s octahedral geometry. The Cu(II) complex exhibited slightly higher magnetic moment value (2.06BM) than expected for one unpaired electron of the d9 electronic configuration (1.8BM) . This accounts for a slight orbital contribution to the spin only value and absence of spin- spin interactions in the complex. Therefore an octahedral geometry is assigned to the copper complex. Complex of Ni(II) exhibited a slightly higher magnetic moment of 4.5BM, which may due to the orbital contribution6.
Electronic spectra of Mn(II) chelate showed three weak bands at 15500, 19200 and 25600cm-1 which have been assigned to transition 6A1g → 4T1g(G), 6A1g → 4T2g(G) and 6A1g → 4Eg(G) respectively of an octahedral field of Mn(II). The electronic spectra of Ni(II) chelate exhibited three bands with 12700, 14300 and 25100 cm-1 which can be assigned to the transitions 3A2g (F)→ 3T2g(F), 3A2g(F) → 3T1g(F) and 3A2g (F) → 3T1g(P) respectively. The electronic spectrum of Cu(II) contained two bands at 14100 and 15500cm-1 respectively. The first band can be assigned to transition 2Ag → 2Tg . The secondband can be attributed to the CT band.
Characteristic infrared absorption frequencies of the ligand and the complexes are represented in Table 2.
Table 2: Characteristic infrared absorption frequencies (cm-1).
|
Substance |
γH2O |
γCOO (asy) |
γC=N |
γCOO (sym) |
γC-O |
In plane bending |
Out of plane bending |
γM-N |
γ M-O |
|
LH |
– |
1660 |
1570 |
1535 |
1294 |
1116 |
900
775 |
– |
– |
| [MnL(Ac)(H2O)3] |
3305 |
1597 |
1593 |
1450 |
1238 |
1159 |
862 752 |
524 |
632 |
|
[NiL(Ac)(H2O)3 ] |
3304 |
1593 |
1535 |
1454 |
1240 |
1153 |
869 756 |
528 |
663 |
|
[CuL(Ac)(H2O)3] |
3275 |
1600 |
1554 |
1456 |
1234 |
1112 |
871 758 |
513 |
669 |
*Calculated values are in parenthesis
Comparison of the IR spectra of the complexes with that of the ligand shows significant changes in two areas. Firstly, a band of medium intensity at about 1660cm-1 for the ligand, which may be attributed to the carbonyl stretching frequency of the carboxylate group, shows a shift to lower frequencies in the spectra of the complexes indicating the chelation of the ligand to metal through the carboxylate oxygen. The second region showing important changes upon ligand complexation is the 1600-1500cm-1 range. Compounds containing >C=N– group have υC=N in the range 1650-1490cm-1. In this ligand, this band occurred at 1570 cm-1 as a strong band and has shifted to lower frequencies in the complexes indicating a reduction of electron density in the azomethine linkage at the nitrogen atom, coordinated to the metal ion7. In all the complexes the asymmetric and symmetric stretching vibrations of the carboxylate groups occur at 1540-1600cm-1 and1450-1460cm-1 respectively, showing a Δυ of about 140cm-1. Therefore monodentate nature of the carboxylate groups is indicated in the present chelates. However conclusive evidence regarding the bonding of nitrogen and oxygen are provided by the occurrence of υM-O and υM-N absorptions in the range 630-670cm-1 and 510-530cm-1respectively in the metal complexes. The existence of a strong band at about 3300cm-1 in the infrared spectra of the complexes, strongly supports the presence of coordinated water molecules in these chelates.
1Hnmr spectrum of ligand shows a characteristic peak at 12.14δ corresponding to carboxylic acid proton. In the complexes disappearance of this peak indicates the involvement of the carboxylate group in complexation by the replacement of H-atom. The azomethine proton signal undergoes a down field shift in the case of nmr spectra of the complexes. This can be attributed due to the coordination through azomethine nitrogen atom to the metal which may decrease the electron density around the CH=N group proton. Significant shift in the signals at carboxylic carbon and azomethine carbon in the cmr spectrum of the complexes compared to that of ligand, establishes the involvement of these two groups in coordination. Based upon the above physico-chemical studies, octahedral geometry is suggested for Mn(II), Ni(II) and Cu(II) complexes of the ligand 3FI2ABA. Fig. 2 shows the structure of the complexes.
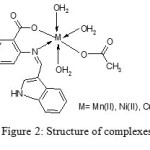 |
Figure 2: Structure of complexes |
Electronic Impedance spectroscopy (EIS)
The corrosion response of mild steel (MS) in 1M HCl in the presence and absence of inhibitor has been investigated using Electrochemical Impedance Spectroscopy at 280C. Fig.3 represents the Nyquist plots of MS specimens in 1M HCl. It is evident from the plots that the impedance response of metal specimens showed a marked difference in the presence and absence of the inhibitor 3FI2ABA. The capacitance loop intersects the real axis at higher and lower frequencies. At high frequency end the intercept corresponds to the solution resistance (Rs) and at lower frequency end corresponds to the sum of Rs and charge transfer resistance (Rct). The difference between the two values gives Rct. The value of Rct is a measure of electron transfer across the exposed area of the metal surface and it is inversely proportional to rate of corrosion 8.
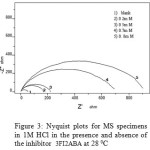 |
Figure 3: Nyquist plots for MS specimens in 1M HCl in the presence and absence of the inhibitor 3FI2ABA at 28 0C |
Impedance behaviour can be well explained by pure electric models that could verify and enable to calculate numerical values corresponding to the physical and chemical properties of electrochemical system under examination 9. The simple equivalent circuit that fit to many electrochemical system composed of a double layer capacitance, Rs and Rct10,11,12. To reduce the effects due to surface irregularities of metal, constant phase element13 (CPE) is introduced into the circuit instead of a pure double layer capacitance which gives more accurate fit as shown in the Fig.4 .
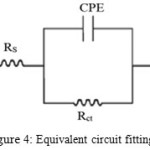 |
Figure 4: Equivalent circuit fitting for EIS Click here to View figure |
The impedance of CPE can be expressed as .
Where Y0 is the magnitude of CPE, n is the exponent (phase shift), ω is the angular frequency and j is the imaginary unit. CPE may be resistance, capacitance and inductance depending upon the values of n10. In all experiments the observed value of n ranges between 0.8 and 1.0, suggesting the capacitive response of CPE. The EIS parameters such as Rct, Rs and CPE and the calculated values of percentage of inhibition (ηEIS%) of MS specimens are listed in Table 3.
From Table 3 it is clear that Rct values are increased with increasing inhibitor concentration. Decrease in capacitance values CPE with inhibitor concentration can be attributed to the decrease in local dielectric constant and /or increase in the thickness of the electrical double layer. This emphasis the action of inhibitor molecules by adsorption at the metal–solution interface 14. The percentage of inhibition (ηEIS%) showed a regular increase with increase in inhibitor concentration. A maximum of 94% inhibition efficiency could be achieved at an inhibitor concentration of 0.8mM.
Table 3: Electrochemical Impedance parameters of MS specimens in 1M HCl at 280C in the absence and presence of 3FI2ABA.
|
c (mM) |
Rs (Ωcm2) |
Rct (Ωcm2) |
CPE (μF cm-2) |
ηEIS% |
|
|
0 |
5.838 |
47.87 |
78.72 |
||
|
0.2 |
10.82 |
153.4 |
60.98 |
68.8 |
|
|
0.5 |
14.66 |
192.6 |
61.57 |
75.1 |
|
|
0.7 |
37.69 |
604.8 |
34.3 |
92.1 |
|
|
0.8 |
41.65 |
803.6 |
33.39 |
94.0 |
Adsorption Isotherm and Free Energy of Adsorption
The mechanism of adsorption and the surface behavior of organic molecules can be easily viewed through adsorption isotherms. Different models of adsorption isotherms considered are Langmiur, Temkin, Frumkin and Freundlich isotherms. For the evaluation of thermodynamic parameters it is necessary to determine the best fit isotherm with the aid of correlation coefficient (R2). Among the isotherms mentioned above, the best description of the adsorption behavior of 3FI2ABA on MS specimens and Copper specimens in 1M HCl was Langmiur adsorption isotherm which can be expressed as where Cis the concentration of the inhibitor, θ is the fractional surface coverage and Kads is the adsorption equilibrium constant15. Fig .5 represents the adsorption plots of 3FI2ABA obtained by EIS measurements on MS steel specimens 1M HCl at 28 0C.
From the adsorption isotherm, Kads= 7194 and it is related to the standard free energy of adsorption ∆G0ads, by
Formula4
Where 55.5 is the molar concentration of water, R is the universal gas constant and T is the temperature in Kelvin 16. ∆G0ads for 3FI2ABA on MS showed negative value indicating the spontaneity of the process. The value of ∆G0ads upto -20kJ mol-1 is an indication of the electrostatic interaction of the charged molecule and the charged surface of the metal (physisorption) while ∆G0ads is more negative than -40kJ implies that inhibitor molecules are adsorbed strongly on the metal surface through co-ordinate type bond(chemisorptions)16-18.In the present investigation, 3FI2ABA molecules showed ∆G0ads -32.3 kJ suggesting that the adsorption of inhibitor involves both electrostatic adsorption and chemisorption.
Conclusions
A novel heterocyclic Schiff base 3FI2ABA was synthesized and it’s chelating ability was exploited by preparing Mn(II), Ni(II) and Cu(II) complexes .
The Schiff base and the complexes were characterized by various analytical techniques.
3FI2ABA is a good inhibitor for MS in 1M HCl. A maximum of 94% of inhibition efficiency could be achieved with this inhibitor by EIS studies.
The inhibition mechanism is explained by adsorption. Adsorption of Schiff base on MS obey Langmiur isotherm.
The thermodynamic parameters of the adsorption are calculated from the adsorption isotherm which revealed that both physisorption and chemisorption are involved in the inhibition process.
References
- Douglas X.West, Coord. Chem Rev., 123, 49 (1993)
- Pandhye S. and Koffman G. B., Coord. Chem. Rev., 63, 127 (1985)
- Joby Thomas K., and Geetha Parameswaran, Asian. J. Chem., 14, 1370 (2002)
- Stanly Jacob K.,.and Geetha Parameswaran, Corro. Sci., 52, 24 (2010)
- Raman A., Reviews on Corrosion Inhibitor Science and Technology vol 1. NACE, Houston, TX, 452 (1986)
- Figgis B.N., Introduction to Ligand Field, Wiely Eastern Ltd., New Delhi, P. 279 (1978)
- Nakamoto K., Infrared and Raman Spectra of Inorganic and Coordination Compounds, 3rd Edn., John Wiley, New York, 235 (1978)
- Rosenfield I.L., Corrosion Inhibitors, McGraw-Hill, New York, 387(1981)
- Priya A.S., Muralidharam V.S., Subramannia A., Corrosion, 64, 541 (2008)
- Ashish Kumar Singh, Sudhish Kumar Shukla, Manjeet Singh, Quraishi M.A., Mater. Chem. Phy., 129, 68 (2011)
- El Azhar M., Mernari B., Traisnel M., Bentiss F., Lagrenée M., Corros. Sci., 43, 2229 (2001)
- Yurt A., Balaban A., Ustün Kandemir S., Bereket G., Erk B., Mater. Chem. Phys., 85,420 (2004)
- Macdonald J.R., Johnson W.B., .Macdonald J.R., Theory in impedance Spectroscopy, John Wiley & Sons, New York (1987)
- Ma Cafferty M., Hackerman N., J. Electrochem. Soc., 119,146 (1972)
- Xianghong Li, Shuduan Deng, Hui Fu, Taohong Li, Electrochim. Acta, 54,4089 (2009)
- Cano E., Polo J.L., La Iglesia A.,and Bastidas J.M., Adsorption, 10,219 (2004)
- Bentiss F., Lebrini M., Lagrenée M., Corros. Sci., 47,2915 (2005)
- Wei-hua Li, Qiao He, Sheng-tao Zhang, Chang-ling Pei and Bao-rong Hou J. Appl. Electrochem., 38,289 (2008)

This work is licensed under a Creative Commons Attribution 4.0 International License.
![]()
A New Edition of Web of Science
Journal Impact Factor
2022: 0.5
Five Year: 0.8
Journal is Indexed in

Cabells Whitelist
![]()


