Synthesis, NMR, Vibrational and Mass Spectroscopy with DFT/HF Studies of 4-(4/-Bromophenyl) -2- Mercaptothiazole Structure
Download this article as:
![]()
Ammonium dithiocarbamate was combined with a compound of phenacylbromide family; 4-(4/-Bromophenyl)-2-mercaptothiazole structure was synthesized. The spectroscopic properties of this structure were studied using 1 H-NMR, 13C-NMR, FT-IR, Mass Spectroscopy and elemental analysis methods. Subsequently, its thermodynamic parameters were examined by density functional theory and Hartree Fock (HF) methods; in this case, 6-311G(d,p) basis set were employed. However, some parameters depending on HOMO and LUMO values were surveyed; chemical potential, chemical hardness, electrophilicity and highest electronic charge transferred were studied. Finally, the electrostatic potential values of this structure were studied. The results indicate a high conformity between the theoretical and experimental values.
KEYWORDS:DFT; FT-IR Spectroscopy; NMR; Synthesis
Introduction
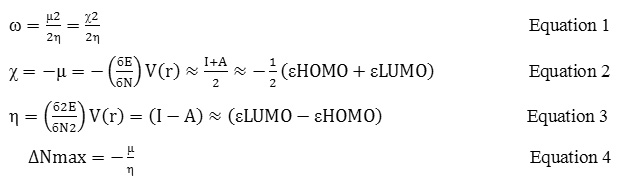
The chemistry of Heterocycle compounds including Thiazoles has spread because of their various biological and pharmaceutical activities. Since these compounds have shown various pharmaceutical, antibacterial and antiviral activities, they have much therapeutic value. Many Thiazoles derivatives compounds have also been synthesized for pharmacy purposes because of their antifungal 1-12. On 18 November 1887, Hantzsch and his colleague, Weber, identified and confirmed the molecular structure of Thiazole. They showed that Carbon between Sulfur and Nitrogen has much activity; for this reason, they suggested prefix “Mezo” for this situation. In 1889, the first derivative of Thiazole was produced by J. Popp. He produced 2-AminoThiazole structure by Diazotisation reaction. This compound is also in the structure of Vitamin B1 13. Thiazoles are compounds which are used as antihyperglycemic compounds 5. For this property, they have many applications in pharmacy and medicine industries 7. For example, this compound has been applied in antituberculosis medicine. These compounds have also been applied in insecticides and antipests in agriculture 8-15. They have tendency to participate in various chemical reactions including alkalisation, oxidation and cycloadditions 16, 17. 4-(4/-Bromophenyl)-2-mercaptothiazole structure is also a compound of Thiazoles family; its pharmaceutical, medical properties and application in the industry may be studied in the future. Electrophilicity is a parameter which is dependant on HOMO and LUMO values; in some references, it is known by proportional compound stability 17. These parameters are calculated by equation (1). In fact, electrophilicity value is proportional to ionization potential and electronic effects. The parameters of chemical potential and chemical hardness can also be calculated by equations (2) and (3). These parameters are correlated to HOMO and LUMO values; thus, their values are different for various compounds. In fact, it is expected that chemical potential changes as electronegative value changes. As electronic potential increases, chemical hardness decreases and we will have a good electrophone species. The highest value for transferred electronic charge can also be calculated by equation (4) 17, 18.
Experimental details
General method
All of chemical materials were purchased from Germany firm Merck. For this study, all of instruments that were used, are as follows: microwave oven model LG-SOLARDOM LF-5901WCR, Japanese weighing with 0.100 g sensivity model ANDGF-300, hitter and stirrer model Heidolphm Rn3004 Safty, Merk thin layer choromatography sheets Art no: 1:0554, Electrothermal melting point measurement apparatus, Memmert (oven) materials and glossy instruments desiccators (oven), vacuum pomp Emerson model: C55-JJXH4205, Rmp: 1425/1725, Heidolph model: Labrota rotary solution. 1H-NMR and 13C-NMR spectra studying done by Bruker Avance 300 spectrometer with the processing software XWINNMR version 3.1 measured. Chemical shifts of TMS. FT-IR by a Perkin Elmer spectrum 1420 spectrometer in the frequency range of 4000–400cm−1 using KBr discs are reported on 1 scale. The IR spectra were recorded at room temperature at the spectral resolution of 1 cm−1. Used Glossy instruments are as follows: one and two ports round-bottom emery-top flasks species, simple, bubble and spiral radiator, Erlenmeyer flask, beakers, three and two ports, links, addition funnel, Buchner funnel, capillary tube and etc.
Synthesis
In a 500 mL flask 5.1 g of 4-bromophenacylbromide solved in Ethanol. Then 36.9 g Ammoniumdithio carbamate added and refluxed for 3 hours. Distiller is used for reaction in constant pressure and control of free gases. With existing solvent by Rotary produced yellow wish solid that Benzenes 125.0 mL, for 15 minutes refluxed (scheme 1). Then it was cooled for producing crystalline sediments, then it was rinsed and dried, the outcome of reaction was 18 g product with melting-point (218˚C). The residue was purified by thin layer chromatography on silica gel (1:2 cyclohexane-acetone) to give (18.0 g, 99%);
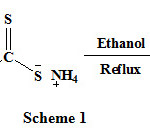 |
Scheme 1
|
A pale yellow; Mp: 216-218; IR (KBr): 3128, 3050, 1628, 1401, 1259, 1180, 746; 13C-NMR (CDC13, 400 MHz) δ(ppm): 121.23, 130.65, 134.88, 136.92, 138.02, 138.84, 151.75, 158.46, 168.35; 1H-NMR (400 MHz, CDCl3) δ 3.46 (s, 1H, SH Aliphatic), 7.37 (s, 1H, H-5), 7.61-7.63 (d, 2H, 2/-H،6/-H), 7.67-7.69 (J=9HZ, d, 2H, 3-H/, 5-H/ ); m/z: 272.91, 270.83 (94.2%), 272.61 (11.3%), 272.01 (9.4%), 273.78 (8.1%), 272.06 (1.7%); Anal. Calcd for C9H6BrNS2: C, 39.71; H, 2.22; Br, 29.36; N, 5.15; S, 23.56; Found: C, 39.53; H, 2.33; Br, 28.98; N, 5.28; S, 22.85.
Computational details
To calculate the thermodynamic parameters for 4-(4/-Bromophenyl)-2-mercaptothiazole structure, at first, this structure was predesigned by Gauss view software 19; its energy was pre-optimized using AM1 semi-experimental method. Then, the energy of structure was finally optimized by DFT and HF methods with 6-311G(d,p) basis sets 20-24. In this case, Gaussion 03w package of program was employed 25. Subsequently, the vibrational frequency parameters for this structure were studied; to approximate the obtained results to the experimental values, 0.909, 0.967 and 0.963 scaled factors were applied for three methods of HF, B3LYP and B3PW91 respectively. The results of vibrational parameters were analyzed by VEDA 4 software 26. NMR parameter values were also calculated by GIAO method 27. All results were reported using TMS reference. Finally, chemical potential, chemical hardness, electrophilicity and highest transferred electronic charge were studied using HOMO and LUMO parameters. The electrostatic potential values were also examined for this structure using Molekel 5.4 software. All calculations have been made in the temperature of 298 °K, the pressure of one atmosphere and gas state. However, all calculations have been made by a Pentium IV, core i7, 1.7 GHz computer processor, 4 GB memory and Windows 7 operating system.
Result and Discussion
When 4-(4/-Bromophenyl)-2-mercaptothiazole structure was synthesized by some experimental methods, the results were compared with the theoretical results (fig 1). The results are interpreted in this section.
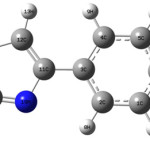 |
Figure 1: Serial number of atom and optimized structure of BPMT structure performed by B3LYP/6-311G(d,p) method.
|
Vibrational assignments
When the structure was optimized by both DFT and HF methods, the values of vibrated parameters were analyzed using VEDA 4 software. 4-(4/-Bromophenyl)-2-mercaptothiazole (BPMT) structure consists of 19 atoms and has totally 51 normal vibrated modes (fig 2 and 3). The results are explained in the following section.
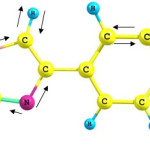 |
Figure 2: Show frequency animation in different bond in BPMT structure. |
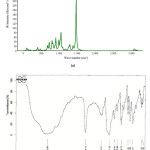 |
Figure 3: (a) FT-IR spectrum obtained by B3LYP/6-311G(d,p) method and FT-IR spectrum obtained by experimental method of BPMT structure. |
C-H vibrations
The type of C-H vibration frequency varies depending on the molecule structure. C-H stretch vibration is usually observed in Heteroaromatic compounds, in the frequency range of 2850-3200 cm-1 28, 29. In N,N-di(p-thiazole)formamidine structure, this type of vibrational has been observed in the regions of 2978, 3112, 3113 and 3071 cm-1; in 2-chloro-N-(diethylcarbamothioyl)benzamide structure, stretch vibration C-H has been observed in 2872-3091 30. In BPMT structure, CH stretch vibration is observed in 3050 and 3128 cm-1 using the experimental results. The results of PEDs analysis also confirm this matter (See table 1). By HF method, this vibration was observed in 3038-3108 cm-1, by B3LYP method, it was observed in 3014-3151 cm-1 and by B3PW91 method, it was observed in 3038-3108 cm-1. It is also expected that CH bending vibration is obtained in 1000-1300 cm-1. Experimental results show that, in BPMT structure, this vibration can be observed in 1066-1259 cm-1. These vibrations have appeared by different tests and the results of PEDs analysis confirm them.
C-S vibrations
In many resources, C-S stretch vibration was reported in 600-750 cm-1 of BPMT 31; in some other resources, it was observed in 680-710 cm-1 and in other resources, it was reported in 609-716 cm-1 32, 33. However, according to the results of experimental tensional vibrations for BPMT, this vibration was obtained in 746 cm-1; using HF, B3LYP and B3PW91 methods, it was obtained in 847, 803 and 847 cm-1. The results of PEDs analysis confirm these results. Of course, this vibration has also appeared below 450 with a lower intensity by a theoretical method which is not so important. CS bending vibration was also appeared in various regions below 700 cm-1. The results of PEDs analysis approve this matter.
C-Br vibrations
The results for C-Br stretch vibrations show that in the experimental method, vibration range is observed below 700 cm-1. In HF method, the theoretical results were 718, 411 cm-1 and even lower than it. In B3LYP method, these vibrations were observed in 648, 406 cm-1 and below it. Using B3LYP method, these vibrations are observed in 648, 406 cm-1 and lower than it. However, using B3PW91 method, this vibration can be observed in 718 and 411cm-1 and even lower than it. PEDs analysis for C-Br bending vibration shows that this vibration is appeared below 350 cm-1. The results for this vibration can be studied in table 1.
Table 1: Vibrational wavenumbers obtained for BPMT structure at HF, B3LYP and B3PW91 methods [harmonic frequency (cm−1), IRint (Kmmol−1)].
|
Mod nos |
Experimental(cm-1) |
Theoretical wavenumber (cm−1) |
PED(%)c |
|||||
|
FT-IR |
HF |
B3LYP |
B3PW91 |
|||||
|
Scaled |
IRintb |
Scaled |
IRintb |
Scaled |
IRintb |
|||
|
1 |
24 |
0.53 |
8 |
0.75 |
24 |
0.53 |
87ГNCCC |
|
|
2 |
48 |
0.45 |
45 |
0.51 |
48 |
0.45 |
13ГCNCC+21ГCCCC+12ГCCCC+12λBrCCC+30λCCCC |
|
|
3 |
78 |
0.43 |
78 |
0.28 |
78 |
0.43 |
34δNCC+32δCCC+10δSCN+11δBrCC |
|
|
4 |
134 |
12.37 |
108 |
11.70 |
134 |
12.37 |
91ГHSCS |
|
|
5 |
147 |
9.25 |
142 |
6.41 |
147 |
9.25 |
42ГCNCC+22λBrCCC |
|
|
6 |
181 |
0.98 |
179 |
0.42 |
181 |
0.98 |
11νBrC+22δSCN+19δBrCC |
|
|
7 |
213 |
1.48 |
211 |
3.30 |
213 |
1.48 |
10ГCNCC+38ГSCCC+41λSSNC |
|
|
8 |
220 |
2.70 |
211 |
0.68 |
220 |
2.70 |
17νBrC+14δSCN+17δBrCC |
|
|
9 |
274 |
0.16 |
274 |
0.06 |
274 |
0.16 |
10δNCC+27δSCN+33δBrCC |
|
|
10 |
319 |
2.08 |
303 |
2.42 |
319 |
2.08 |
13ГCCCC+28ГSCCC+32λBrCCC+14λCCCC |
|
|
11 |
374 |
2.84 |
369 |
3.51 |
374 |
2.84 |
36νSC+15δCNC |
|
|
12 |
409 |
9.66 |
399 |
0.00 |
409 |
9.66 |
14ГHCCC+32ГCCCC+43ГCCCC |
|
|
13 |
411 |
1.56 |
406 |
13.82 |
411 |
1.56 |
17νCC+12νSC+35νBrC |
|
|
14 |
471vw |
474 |
4.91 |
474 |
6.87 |
474 |
4.91 |
17λBrCCC+10λSSNC+11λCCNC+15λCCCC |
|
15 |
506 |
8.39 |
482 |
0.41 |
506 |
8.39 |
19νSC+11δSCC+20δNCC+19δCCC |
|
|
16 |
505w |
548 |
0.91 |
524 |
1.99 |
548 |
0.91 |
28ГCNCC+30ГSSNC |
|
17 |
627 |
0.90 |
607 |
2.80 |
627 |
0.90 |
58δSCC |
|
|
18 |
634 |
1.11 |
623 |
0.23 |
634 |
1.11 |
10νCC+22δCCC+34δCCC |
|
|
19 |
681 |
3.84 |
658 |
0.53 |
681 |
3.84 |
10ГHSCS+10ГCCCC+12ГCCCC+37λCCNC |
|
|
20 |
695 |
2.58 |
676 |
20.21 |
695 |
2.58 |
57ГHCSC+19ГCCCC |
|
|
21 |
718 |
2.42 |
684 |
1.97 |
718 |
2.42 |
12νBrC+16δCCN+22δCCC |
|
|
22 |
773 |
63.24 |
724 |
36.13 |
773 |
63.24 |
11ГHCCC+11ГHCCC+23ГHCSC+11ГCCCC+24λCCNC |
|
|
23 |
812 |
31.21 |
802 |
9.65 |
812 |
31.21 |
34ГHCCC+37ГHCCC |
|
|
24 |
746w |
847 |
10.56 |
803 |
29.92 |
847 |
10.56 |
55νSC |
|
25 |
864 |
25.64 |
827 |
24.56 |
864 |
25.64 |
49ГHCCC+18ГHCCC+12λCCCC |
|
|
26 |
879vw |
883 |
9.64 |
876 |
14.16 |
883 |
9.64 |
13νNC+35δCCN |
|
27 |
940 |
56.57 |
907 |
54.47 |
940 |
56.57 |
62δHSC+18δCNC |
|
|
28 |
978 |
0.04 |
926 |
0.00 |
978 |
0.04 |
36ГHCCC+45ГHCCC+12ГCCCC |
|
|
29 |
998 |
39.11 |
959 |
0.32 |
998 |
39.11 |
25ГHCCC+47ГHCCC+20ГCCCC |
|
|
30 |
1004 |
0.12 |
989 |
41.49 |
1004 |
0.12 |
39δCCC+20δCCC+20δCCC |
|
|
31 |
1040 |
0.52 |
1027 |
32.69 |
1040 |
0.52 |
16νNC+17νSC+10δHSC+17δCNC |
|
|
32 |
1066 |
33.83 |
1048 |
25.93 |
1066 |
33.83 |
16νCC+16νCC+11δHCS |
|
|
33 |
1066m |
1074 |
6.79 |
1051 |
50.12 |
1074 |
6.79 |
11νCC+19δHCS |
|
34 |
1100 |
62.27 |
1096 |
10.21 |
1100 |
62.27 |
11νCC+13νCC+18δHCC+16δHCC+11δHCC+13δHCC |
|
|
35 |
1140 |
10.33 |
1166 |
3.10 |
1140 |
10.33 |
10νCC+16δHCC+18δHCC+20δHCC+21δHCC |
|
|
36 |
1180vw |
1178 |
2.70 |
1180 |
4.72 |
1178 |
2.70 |
14νCC+45δHCS |
|
37 |
1259w |
1205 |
2.88 |
1254 |
12.59 |
1205 |
2.88 |
10νCC+28νCC+17νNC |
|
38 |
1291 |
44.89 |
1276 |
13.14 |
1291 |
44.89 |
12νCC+18νCC+10δHCC+16δHCC+13δHCC |
|
|
39 |
1317 |
28.67 |
1296 |
22.73 |
1317 |
28.67 |
16νNC+10δHCC+19δHCC |
|
|
40 |
1400 |
27.09 |
1382 |
18.87 |
1400 |
27.09 |
15νCC+19νCC+10δHCC+12δHCC |
|
|
41 |
1401s |
1487 |
11.34 |
1442 |
10.49 |
1487 |
11.34 |
31νNC+20νCC |
|
42 |
1521 |
235.65 |
1469 |
236.92 |
1521 |
235.65 |
55νNC |
|
|
43 |
1564 |
36.30 |
1496 |
0.81 |
1564 |
36.30 |
36νCC+16νCC |
|
|
44 |
1599 |
13.96 |
1553 |
1.90 |
1599 |
13.96 |
22νCC+23νCC+14δCCC |
|
|
45 |
1628w |
1627 |
9.12 |
1578 |
3.48 |
1627 |
9.12 |
31νCC+12δCCC |
|
46 |
2064vs |
2617 |
0.57 |
2586 |
1.24 |
2617 |
0.57 |
100νSH |
|
47 |
3038 |
8.86 |
3074 |
7.91 |
3038 |
8.86 |
89νCH+11νCH |
|
|
48 |
3050vw |
3053 |
2.09 |
3092 |
1.02 |
3053 |
2.09 |
74νCH+26νCH |
|
49 |
3060 |
4.89 |
3098 |
3.75 |
3060 |
4.89 |
11νCH+88νCH |
|
|
50 |
3073 |
0.86 |
3106 |
0.87 |
3073 |
0.86 |
25νCH+73νCH |
|
|
51 |
3128br |
3108 |
5.81 |
3151 |
3.67 |
3108 |
5.81 |
99νCH |
C-N and C=N vibrations
In aromatic Amines, the range of C-N stretch variations varies in 1200-1330 cm-1 so that in some compounds such as Benzoxazole, C-N stretch vibration is obtained as (FT-IR), 1315 cm−1 (FT-Raman), 1315 cm−1 (HF) and 1332 cm−1 34. This vibration was observed in 1259 cm-1 by the experimental method; it can be observed in the region lower than 1521 cm-1 by the theoretical method. The PEDs analysis for this vibration in the mode noses of 42, 41 and 39 can be observed with a rather suitable intensity.
S-H vibrations
S-H stretch vibration is observed in 2500-2700 cm-1. Since in DPTF structure, this vibration has not appeared in a desirable region by the experimental method, it may be considered in 2064 cm-1. Using HF, B3LYP and B3PW91 methods, this vibration is observed in 2617, 2586 and 2617cm-1 respectively. As it is shown in table 1 (mode nos 46), this vibration range has been appeared as 100 percent.
C-C and C=C vibrations
C-C vibration will vary in the different sections of the structure. Usually, C-C stretch vibrations will vary in 1430-1625 cm-1. In general, the bands are of variable intensity and are observed at 1625–1590, 1590–1575, 1540–1470, 1465–1430 and 1380–1280 cm−1 from the wave number ranges given 35 for the five bands in the region. C=C tensional vibration in FT-IR spectrum was observed in 1521, 1586 and 1596 cm-1; in FT-Raman spectrum, it was observed in 1600 cm-1. These results are absolutely consistent with the theoretical results. In B3LYP/6-311G(d,p) method, this vibration was observed in 1560, 1566, 1587 and 1589 cm-1. The obtained results were similar to the range of vibrations obtained for C=C in DMFP and N,N-di(p-thiazole)formamidine structures 36, 37. In DMFP structure, C-C-C vibrations were observed in 800, 618, 573 and 483 cm-1 which were absolutely similar and close to the results obtained for TEPE structure 36. Of course, it should be mentioned that the intensity of these peaks is moderate and rather weak. In Benzamide oxim structure, this vibration is observed in 600 and 625 cm-1 38. In BPMT structure, C=C vibration will be in a cycle with 5 members and a cycle with 6 members; C-C stretch vibration will be between two cycles. This vibration may be observed in 1628 cm-1 by the experimental results; this tensional vibration can be observed in 1450 and 1650 cm-1 by the theoretical method. But C-C-C bending vibration is appeared in various regions so that the highest intensity may be in different regions such as mode noises of 18 and 30.
NMR spectra
As it was mentioned in the experimental section, when BPMT was synthesized, this structure was identified by 13C-NMR and 1H-NMR spectroscopy method. To verify the obtained results by GIAO theory method, the chemical movement values for the mentioned compound were studied. In this case, three levels of HF, B3LYP and B3PW91 as well as basis set 6-311G(d,p) mode were employed. The results obtained by both theoretical and experimental methods are reported in table 2. The results indicate that the values of theoretical and experimental methods are absolutely close and similar to each other. To compare the obtained results, the values were put beside each other; the gradient and R2 values were calculated for them. As the results show, R2 in 13C-NMR is higher than R2 in 1H-NMR. The reason may be that 1H-NMR is absolutely dependant on the effects of solvent while 13C-NMR is absolutely independent from the effects of solvent (table 3). Theoretical calculations have been made in gas phase while experimental calculations have been made in the conditions in which the solvent has been effective on the results. It should be mentioned that TMS has been considered as the reference for 1H-NMR and 13C-NMR results.
Table 2: Theoretical and experimental 1H and 13C isotropic chemical shifts (with respect to TMS, all values in ppm) for BPMT structure.
|
|
Atomic number |
Methods |
|||
|
HF |
B3LYP |
B3PW91 |
Exp |
||
|
Chemical Shift |
H8 |
8.52 |
8.39 |
8.42 |
7.69 |
|
H9 |
7.85 |
7.60 |
7.59 |
7.67 |
|
|
H7 |
7.74 |
7.50 |
7.49 |
7.63 |
|
|
H10 |
7.65 |
7.43 |
7.41 |
7.61 |
|
|
H13 |
6.93 |
7.03 |
6.98 |
7.37 |
|
|
H16 |
4.28 |
4.47 |
4.42 |
3.46 |
|
|
C14 |
174.06 |
169.02 |
164.70 |
168.35 |
|
|
C11 |
156.07 |
159.26 |
156.95 |
158.46 |
|
|
C6 |
141.37 |
147.78 |
143.91 |
151.75 |
|
|
C3 |
138.92 |
138.17 |
135.71 |
138.02 |
|
|
C1 |
138.86 |
138.44 |
136.85 |
138.84 |
|
|
C5 |
137.86 |
137.34 |
135.50 |
136.92 |
|
|
C2 |
136.08 |
135.32 |
133.83 |
134.88 |
|
|
C4 |
132.02 |
129.86 |
128.48 |
130.65 |
|
|
C12 |
114.45 |
119.21 |
116.50 |
121.23 |
|
Table 3:Correlation between theoretical and experimental methods for NMR property in BPMT structure.
|
Correlation between |
Kind of NMR |
Equation |
R2 |
|||
|
Experimental |
HF |
13C-NMR |
y = 1.069x – 10.89 |
0.916 |
||
|
1H-NMR |
y = 0.851x + 1.285 |
0.921 |
||||
|
B3LYP |
13C-NMR |
y = 1.022x – 3.740 |
0.989 |
|||
|
1H-NMR |
y = 0.765x + 1.787 |
0.920 |
||||
|
B3PW91 |
13C-NMR |
y = 0.976x + 0.433 |
0.978 |
|||
|
1H-NMR |
y = 0.775x + 1.700 |
0.913 |
||||
Molecular electronic potential maps
The results for molecular electronic potential maps are shown in figure 4. When the structure was optimized by HF, B3LYP and B3PW91 levels of theory methods, molecular electronic potential maps (MESP) calculations were made. In fact, this figure shows us how reactivity map displays; the more this parameter value is negative, the probability of nucleophilic attack to these sections is more. As the figure shows, blue sections are less affected by nucleophilic attack and red sections are more affected by nucleophilic attack 39. For example, the sections containing Nitrogen may be more subjected to the nucleophilic attack because there is a pair of non bonding electrons. The process and results obtained by three different methods are shown in figure 4.
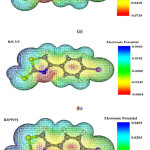 |
Figure 4: (a) HF (b) B3LYP (c) B3PW91 calculated 3D molecular electrostatic potential of BPMT structure (isosurface value 0.01 a.u.). |
Other molecular properties
Using quantum mechanics calculations, some other thermodynamic parameters such as energy levels, entropy values and thermal capacity were studied for BPMT structure by three different methods. Then, some parameters dependant on HOMO and LUMO values like chemical hardness, chemical potential, electrophilicity and highest electronic charge transferred were examined. The results for these calculations have been reported in table 4.
Table 4: Theoretically computed energies (kcal.mol−1), zero-point vibrational energies (kcal.mol−1), rotational constants (GHz), heat capacities (cal.mol-1.K-1), entropies (cal.mol-1.K-1), dipole moment (Debye), molecular orbitals energies (εHOMO and εLUMO, eV), electronic chemical potential, μ (eV), chemical hardness, h (eV), electrophilicity, ω (eV) and maximum amount of electronic charge transfer for BPMT structure.
|
Parameters |
HF |
B3LYP |
B3PW91 |
|
Total energy |
-2363246.606 |
-2366843.172 |
-2366669.646 |
|
ZPVE |
83.973 |
77.939 |
78.337 |
|
Rotational constant |
1.769 |
1.735 |
1.752 |
|
0.147 |
0.145 |
0.146 |
|
|
0.136 |
0.134 |
0.135 |
|
|
Entropy |
|||
|
Total |
110.884 |
116.539 |
115.959 |
|
Translational |
42.689 |
42.689 |
42.689 |
|
Rotational |
33.470 |
33.514 |
33.490 |
|
Vibrational |
34.725 |
40.336 |
39.779 |
|
Heat capacity |
40.971 |
44.019 |
43.846 |
|
Dipole moment(D) |
3.501 |
3.377 |
3.420 |
|
HOMO |
-0.305 |
-0.225 |
-0.227 |
|
LUMO |
0.077 |
-0.058 |
-0.059 |
|
Chemical potential(μ) |
-0.114 |
-0.142 |
-0.143 |
|
Chemical hardness(η) |
0.383 |
0.167 |
0.167 |
|
Electrophilicity(ω) |
0.016 |
0.060 |
0.061 |
|
ΔNmax |
0.297 |
0.851 |
0.855 |
Conclusions
BPMT structure was synthesized by the experimental method; the related structure was identified by FT-IR, 1H-NMR, 13C-NMR, Elemental analysis and Mass Spectroscopy methods. Then, the results were compared with the experimental values using DFT and Hartree Fock methods. The results for vibrated spectra show that R2 value is 0.970, 0.975 and 0.970 for three mentioned methods respectively. It indicates that theoretical and experimental results are close to each other. The comparison between the theoretical and experimental results for 1H-NMR also shows that R2 value is equal to 0.921, 0.920 and 0.913. The results for 13C-NMR indicate that R2 value will be equal to 0.916, 0.989 and 0.978 using three different methods. It means that the results are close to each other. Finally, some thermodynamic parameters for the structure such as electrostatic potential, electrophilicity, chemical hardness, chemical potential and highest transferred electronic charge were studied.
Acknowledgements
The authors are indebted to Mr. Ehsan Fereyduni for their interest in this work and many helpful discussions. However this work was supported by Islamic Azad University Shahre-rey branch and PNU Mashhad branch.
References
- O. Bozdag-Dundar, E.J. Verspohl, N. Das-Evcimen, R.M. Kaup, K. Bauer, M. Sarikaya, B. Evranos, R. Ertan, Bioorg Med Chem, 16: 6747 (2008).
- P.K. Swarnkar, P. Kriplani, G.N. Gupta, K.G. Ojha, E-Journal of Chemistry, 4: 14 (2007).
- K.M. Taghi-Ganji, S.H. Ghodsi, E. Alipour, M. Amini, M. Hosseini, A. Shafiee, Asian Journal of Chemistry, 19: 2521 (2007).
- B. Rajeeva, N. Srinivasulu, S.M. Shantakumar, E-Journal of Chemistry, 6: 775 (2009).
- H.W. Lee, B.Y. Kim, J.B. Ahn, S.W. Kang, J.H. Lee, J.S. Shin, S.K. Ahn, S.J. Lee, S.S. Yoon, Eur J Med Chem, 40: 862 (2005).
- O. Bozdag-Dundar, O. Ozgen, A. Mentese, N. Altanlar, O. Atli, E. Kendib, R. Eetana, Bioorg Med Chem, 15: 6012 (2007).
- A. Ceriello, Diab Met Res Rev, 24: 14 (2008).
- J.S. Eun, K.S. Kim, H.N. Kim, S.A. Park, T. Ma, K.A. Lee, D.K. Kim, H.K. Kim, I.S. Kim, Y.H. Jung, O.P. Zee, D.J. Yoo, Y.G. Kwak, Arch Pharm Res, 30: 155 (2007).
- M. Mori, M. Takagi, C. Noritake, S. Kagabu, J Pestic Sci, 33: 357 (2008).
- S.K. Sahu, M. Banerjee, S.K. Mishra, R.K. Mohanta, Acta Pol Pharm Drug Res, 64: 121 (2007).
- C. Dwivedi, T.K. Gupta, S.S. Parmar, J Med Chem, 15: 553 (1972).
- A. Verma, S.K. Saraf, Eur J Med Chem, 43: 897 (2008).
- I. Nabih, F. El-Hawary, H. Zoorob, Journal of Pharmaceutical Sciences, 8: 1327 (1972).
- P.A. Nelson, G.D. Paulson, V.J. Feil, Xenobiotica, 17: 829 (1987).
- T.S. Young, C.T. Walsh, PNAS, 108: 13053 (2011).
- T. Tejero, A. Dondoni, I. Rojo, F.L. Merchán, P. Merino, Tetrahedron, 53: 3301 (1997).
- R.G. Parr, L.V. Szentpaly, S. Liu, J. Am. Chem. Soc, 121: 1922 (1999).
- E. Chamorro, M. Duque-Norea, P. Perez, J. Mol. Struct. (THEOCHEM), 896: 73 (2009).
- R. Dennington, T. Keith, J. Millam, K. Eppinnett, W.L. Hovell, R. Gilliland, GaussView, Version 3.07, Semichem, Inc., Shawnee Mission, KS, (2003).
- B. Semire, O.A. Odunola, Oriental journal of chemistry, 25: 841 (2009).
- C.Y. Panicker, H.T. Varghese, A. Chandran, Oriental journal of chemistry, 27: 1771 (2011).
- C.Y. Panicker, H.T. Varghese, B. Harikumar, A. Chandran, Oriental journal of chemistry, 27: 1705 (2011).
- Y.J. Beevi, H.T. Varghese, C.Y.Panicker, G. Rajendran, Oriental journal of chemistry, 27: 1109 (2011)
- M.A. Boughdiri, O. Fliss, T. Boubaker, B. Tangour, Oriental journal of chemistry, 22: 39052 (2006).
- M.J. Frisch et al., GAUSSIAN 03w. Gaussian, Inc, Pittsburgh, PA, (2004).
- M.H. Jamroz, Vibrational Energy Distribution Analysis VEDA 4, Warsaw, (2004).
- K. Wolinski, J.F. Hinton, P. Pulay, J. Am. Chem. Soc. 112: 8251 (1990).
- K.R. Ambujakshan, H. Tresavarghese, S. Mathew, S. Ganguli, A. Kumar Nanda, C.Yohannan Panicker, Oriental journal of chemistry, 24: 865 (2008).
- L. Ushakumari, C.Y. Panicher, H. Tresavaraghese, Haseena, A.V. Vaidyan, N. Sudhakaran, K. Raju, Oriental journal of chemistry, 24: 849 (2008).
- H. Arslan, U. Fl¨orke, N. K¨ulc¨u, G. Binzet, Spectrochimica Acta Part A, 68: 1347 (2007).
- S. Durmus, A. Atahan, M. Zengin, Spectrochimica Acta Part A, 84: 1 (2011).
- J. Coates, Interpretation of Infrared Spectra, A Practical Approach, John Wiley and Sons Ltd., Chichester, (2000).
- X. Li, Z. Tang, X. Zhang, Spectrochim. Acta A, 74: 168 (2009).
- R. Saxena, L.D. Kauedpal, G.N. Mathur, J. Polym, Sci. A: Polym. Chem, 40: 3559 (2002).
- T. Shimanouchi, Y. Kakiuti, I. Gamo, J. Chem. Phys. 25: 1245 (1956).
- M.K. Rofouei, N. Sohrabi, M. Shamsipur, E. Fereyduni, S. Ayyappan, N. Sundaraganesan, Spectrochimica Acta Part A, 76: 182 (2010).
- M.K. Rofouei, E. Fereyduni, N. Sohrabi, M. Shamsipur, J.A. Gharamaleki, N. Sundaraganesan, Spectrochimica Acta Part A, 78: 88 (2011).
- V. Arjunan, C.V. Mythili, K. Mageswari, S. Mohanc, Spectrochimica Acta Part A, 79: 245 (2011).
- P. Politzer, D.G. Truhlar, Chemical Application of Atomic and Molecular Electrostatic Potentials, Plenum, New York, (1981).


ISSN Online: 2231-5039

![]()


