Ultrasound-assisted Emulsification Microextraction Method Based on Applying Low Density Organic Solvents as a Sensitive and Efficient Sample Preparation Method for Determination of Abamectin in Fruit Juice Samples
Hossein Ali Mashayekhi¹*, Mohammad Rezaee² and Naser Montazeri¹
¹Department of Chemistry, Tonekabon Branch, Islamic Azad University, Tonekabon (Iran).
²Nuclear Fuel Cycle Research School, Nuclear Science & Technology Research Institute, Atomic Energy Organization of Iran, P.O. Box 14395-836, Tehran (Iran).
The analytical use of ultrasound-generated emulsations has recently found a growing interest to improve efficiency in liquid-liquid microextraction since they increase the mass transfer between the two immiscible phases implied and leads to emulsification. Thus, dispersed droplets can act as efficient liquid-liquid microextraction in continuous phase, and later they can be readily separated by centrifugation. Ultrasound-assisted emulsification microextraction (USAEME) based on applying a low density organic solvent and high-performance liquid chromatography (HPLC)-UV detection was presented for extraction and determination of abamectin in fruit juice samples. Toluene as extraction solvent at microliter volume level was injected slowly into a home-designed centrifuge glass vial that was located inside the ultrasonic water bath. The main advantages of method are high preconcentration factor, high recovery, good repeatability and extraction solvent volume at µL level. The influence of several variables (e.g. type and volume of extraction solvent, ionic strength and extraction temperature, etc.) on the performance of the sample preparation step was carefully evaluated. Under the optimum conditions, the enrichment factors 261 and 217 were obtained for avermectin (B1b) and avermectin (B1a), respectively, and calibration graphs were linear in the range of 5.0-500 µg L-1 and 2.0-500 µg L-1 with detection limits of 1.5 µg L-1 and 0.6 µg L-1 for B1b and B1a, respectively, in fruit juice samples. The relative recoveries of abamectin in fruit juice samples at spiking level of 5.0 µg L-1 are in the range of 90% to 94%. USAEME combined with HPLC-UV is a fast, simple and efficient method for the determination of abamectin in fruit juice samples.
KEYWORDS:Ultrasound-assisted emulsification microextraction; Low density organic solvents; Abamectin; Fruit juice samples
Download this article as:| Copy the following to cite this article: Mashayekhi H. A, Rezaee M, Montazeri N. Ultrasound-assisted Emulsification Microextraction Method Based on Applying Low Density Organic Solvents as a Sensitive and Efficient Sample Preparation Method for Determination of Abamectin in Fruit Juice Samples. Orient J Chem 2012;28(1). |
| Copy the following to cite this URL: Mashayekhi H. A, Rezaee M, Montazeri N. Ultrasound-assisted Emulsification Microextraction Method Based on Applying Low Density Organic Solvents as a Sensitive and Efficient Sample Preparation Method for Determination of Abamectin in Fruit Juice Samples. Orient J Chem 2012;28(1). Available from: http://www.orientjchem.org/?p=23814 |
Introduction
Abamectin belongs in the family of the naturally occurring avermectins that are produced from the fermentation of the soil microorganism streptomyces avermitilis. Abamectin is a mixture of two components, avermectin (B1a) and avermectin (B1b). Abamectin is exceptionally susceptible to photodegradation are the delta 8,9-isomer of avermectin B1a and a polar and a moderately polar fraction, of which only the 8,9-isomer was found to be toxic1,2. Abamectin is the active ingredient found in formulations registered worldwide for control of motile mites and insect larvae on both agricultural and crops.
The high molecular weight of the avermectins (AVMs) (> 800 daltons) leads liquid chromatography as the most suitable chromatographic technique for determination. Liquid chromatographic methods using ultraviolet (UV) detection and fluorescence detection for the AVMs residue in different kind samples were reported3-9. The very low concentrations of AVMs required a very laborious procedure including extraction before final HPLC-UV detection. So the main purpose of this study was to develop a rapid, sensitive and quantitative technique for the determination of abamectin in fruit juice samples. Therefore, this study was mainly focused on the development of an efficient but simple analysis method to detect the residual level of abamectin in fruit juice samples.
USAEME procedure combines micro-extraction system and ultrasonic radiation in one step. Ultrasonic radiation is a powerful means for acceleration of various steps in analytical procedure for both solid and liquid samples10,11. In the USAEME technique, the application of ultrasonic radiation facilitates the emulsification phenomenon and accelerates the mass-transfer process between two immiscible phases. This leads to an increment in the extraction efficiency in a minimum amount of time12,13. In fact, this preconcentration technique has been developed by Regueiro et al14, who successfully applied it to determine synthetic musk fragrances, phthalate esters and lindane in aqueous samples. They demonstrated that USAEME is an efficient, simple, rapid and inexpensive extraction technique for GC analysis. Up to now, it has also been applied to the preconcentration of polybrominated diphenyl ethers from water samples15. Also, saleh et al applied low-density organic solvent (toluene) in USAEME for the determination of PAHs in water samples with high enrichment factors (EFs)16.
The present investigation has centered on the development of a reliable method for the determination of abamectin in fruit juice samples. Chemical structure of abamectins was shown in figure 1. We for the first time use the new preconcentration method of USAEME, which is combined with HPLC for the determination of abamectin in fruit juice samples.
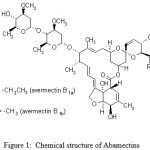 |
Figure 1: Chemical structure of Abamectins |
Experimental
Chemical and Reagents
Pesticides standard of abamectin purchased from Sigma-Aldrich Company was of analytical standard with purity of > 99%. Standard solutions of abamectin were prepared in acetonitrile (1000 mg L-1) and kept in the dark under refrigeration at 4 ºC. Working mixtures of pertinent concentrations were prepared daily by appropriate combination and dilution. All different fruit juice samples (Orange and Kiwi) were prepared by fruits which produced from local garden fruits (Tonekabon, Iran). Toluene, 1-undecanol, 1-dodecanol and 1-octanol as extraction solvents were obtained from Merck Company (Germany). Also, sodium chloride was purchased from Merck. The water used was purified on a youngling ultra pure water purification system (aqua maxTM – ultra, korea).
Instrumentation
Chromatographic separations were carried out on a Waters Breeze with 1525 Binary HPLC pump (Massachusetts, USA) and having a 20 µL sample loop and equipped with a Waters 2487 UV/Vis detector. Separations were carried out on a Waters Spherisorb ODS2 column (250mm × 4.6 mm, with 5.0 µm particle size) from Waters Company (Massachusetts, USA). A mixture of water and methanol (8:92) at a flow rate of 1.5 mL min-1 was used as a mobile phase in isocratic elution mode. The injection volume was 20 µL for all the samples and the detection was performed at the wavelength of 245 nm.
Extraction procedure
Figure 2 shows the schematic procedure of the proposed method. A 10.0 mL of doubly-distilled water was placed in a home-designed centrifuge glass vial which was filled by the aqueous sample up to the middle of the conic head of vial (fig.2, a). The vial was immersed into a ultrasonic water bath. The ultrasonic water bath was switched on and 35 µL of organic solvent (toluene) was slowly injected into the water sample by a 50 µL syringe (fig.2, b). After a thirty second sonication at 40 kHz of ultrasound frequency and 0.138 kW of power at 25 ± 3 °C, the formed emulsion. A cloudy solution was formed in the test tube. In this step, the analytes in water sample were extracted into the fine droplets of toluene. The mixture was then centrifuged for 10 min at 3500 rpm. After separation of the two phases, a few microliters of doubly distilled water were added into the vial through the glass tube fixed on the side of the vial (fig.2, c). The floated organic solvent was rised into the capillary tube attached to the top of the vial (fig.2, d). The separated phase (about 20 µL) was completely transferred to another test tube with conical bottom using 50 µL HPLC syringe and after evaporation of the solvent in a water bath; the residue was dissolved in 20 µL HPLC grade methanol and injected into the separation system.
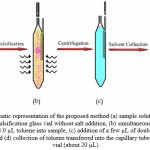 |
Figure 2. Schematic representation of the proposed method (a) sample solution in the home-designed emulsification glass vial without salt addition, (b) simultaneous injection and dispersion of 35.0 µL toluene into sample, (c) addition of a few µL of doubly distilled water into the vial and (d) collection of toluene transferred into the capillary tube at the top of the vial (about 20 µL). |
Results and Discussion
In this research, USAEME combined with HPLC-UV was developed for the determination of abamectin in fruit juice samples. In order to obtain a high recovery and enrichment factor, the effect of different parameters such as kind of extraction solvent and volume of its, centrifugation time, temperature and salt addition were examined and optimal conditions were selected. The study and the optimization of the above mentioned variables were performed one at a time variable method.
Selection of Extraction solvent
For the LPME method, solvent is selected based on the solubility of analytes. Selection of a suitable extraction solvent for USAEME is limited by several characteristics that are necessary for emulsification under ultrasonic radiation. The extraction solvent has to confirm several requirements, extraction ability, lower density than water, low water solubility. Many of the solvents with these characteristics are less dense than water. Therefore, they haven’t been used in emulsification based microextraction techniques. Four prospective extraction solvents, including toluene, 1-undecanol, 1-dodecanol and 1-octanol were selected and examined for the extraction of analytes.
30.0, 32.0, 45.0 and 35.0 microliters of 1-undecanol, 1-dodecanol, 1-octanol and toluene were emulsified (volumes of collected solvents about 20 µL), respectively, into 10 mL of an aqueous sample for the extraction of 100 µg L-1 of analytes under USAEME, as in the conditions described above. Table 1 demonstrates the extraction recovery by using these organic solvents. Visibly, toluene has the highest extraction recovery for analytes compared with the other solvents. Therefore, toluene was used for subsequent experiments.
Table 1: Extraction recovery of different extraction solvents evaluated for the extraction of abamectin (B1b and B1a)a
|
Extraction recovery (%) |
Compounds |
|||
|
1-Dodecanol |
Toluene |
1-Undecanol |
1-Octanol |
|
|
19 |
56 |
24 |
33 |
B1b |
|
11 |
47 |
13 |
26 |
B1a |
Effect of centrifugation time
In USAEME process, centrifugal time affects the size collected phase and concentration of analyte in the extraction phase. Centrifugation was required to break down the emulsion and accelerate the phase-separation process. Centrifugation times were at 3500 rpm and examined in the range of 2-20 min. The volumes of collected toluene on the surface of the samples were measured and used as the response factor. Results showed that the volume of collected solvent was increased as the centrifugation time increased from 2 to 10 min. At higher centrifugation times (>15 min) because of the evaporation, the volume of collected toluene was decreased. Therefore, 10 min was selected as the optimum centrifugal time.
Effect of volume of extraction solvent
From the equilibrium of a solute between two liquid phases in an extraction, the solvent volume directly affected the quantity of extract. The experimental conditions are fixed and include the use of different volumes of toluene (35.0, 45.0, 55.0 and 65.0 µL). Fig 3 show curve of enrichment factor versus volume of extraction solvent. It is clear that by increasing the volume of toluene from 35.0 to 65.0 µL, the volume of collected solvent increases from 20.0 to 53.0 µL. According to Fig.3, by increasing the volume of toluene, enrichment factor decrease, because the volume of collected solvent increases. Hence, high enrichment factors are obtained using the 35.0 µL volume of extraction solvent. In the following studies, 35.0 µL was selected as the optimal volume of extraction solvent.
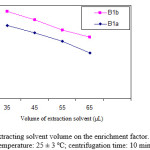 |
Figure 3: Effect of extracting solvent volume on the enrichment factor. Conditions: solution temperature: 25 ± 3 ºC; centrifugation time: 10 min. |
Salt addition
The effect of increasing the ionic strength of the water sample evaluated by adding NaCl (0-8%, W/V) into the water sample spiked with analytes at level of 100.0 µg L-1. USAEME experimental conditions were the same as those described before. Plot of enrichment factor vs. ionic strength have been shown in Figure 4. It is clear that by increasing the NaCl %, the volume of collected phase increases, because of the decrease in solubility of extraction solvent in the presence of salt. Enrichment factor decreases, because of increasing in the volume of collected phase (figure 4). Therefore, further experiments were done without salt addition.
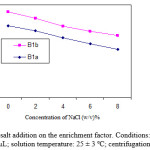 |
Figure 4: Effect of salt addition on the enrichment factor. Conditions: volume of organic solvent: 35.0 µL; solution temperature: 25 ± 3 ºC; centrifugation time: 10 min. |
Effect of emulsification-extraction temperature
Emulsification phenomenon, distribution coefficient and mass transfer of target analyte can be affected by temperature. To determine the effect of sample solution temperature during emulsification-extraction process, 10 mL sample solution containing 100 µg L-1 of analytes was extracted with 35.0 µL toluene at different temperatures ranging from 25 to 50 ºC. The results in the figure 5 show that solution temperature has no significant effect on the extraction efficiency of the analytes. In some of the microextraction methods because of the limiting effect of mass transfer, the influence of temperature on the extraction efficiency is considerable. In the current study, the contact surface between organic solvent and the aqueous sample is very large and there is no limiting any effect caused by slow mass transfer. Therefore, this is clear that emulsification temperature cannot affect the extraction efficiency of analytes. Accordingly, in further experiments emulsification-extractions were conducted at room temperature (25 ± 3 ºC).
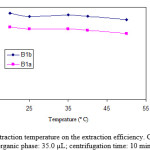 |
Figure 5: Effect of extraction temperature on the extraction efficiency. Conditions: volume of organic phase: 35.0 µL; centrifugation time: 10 min. Click here to View figure |
Analytical Performance
To evaluate the practical applicability of the USAEME method, analytical quality parameters (i.e., linearity, repeatability, and LOD) were investigated. The performance of the method under the optimum conditions is shown in Table 2. The linear dynamic ranges were from 2.0 to 500 µg L-1 for B1a and 5.0-500 µg L-1 for B1b in fruit juice samples. The relative standard deviation (RSD) for extraction and determination of the analytes were in the range of 8.6-9.8% based on 5 replicates in fruit juice samples. Good limit of detections (LODs) in the range of 0.6 and 1.5 µg L−1 were obtained, based on S/N = 3 in fruit juice samples. The EFs were in the ranges of 217 to 261 in fruit juice samples. The broad linear dynamic range combined with the low detection limit suggests a high potential for monitoring abamectin in fruit juice samples by applying the USAEME-HPLC-UV method.
Table 2: Quantitative results of USAEME and HPLC-UV of abamectin (B1b and B1a)a
|
R2d |
R.S.D. (%)c |
EFb |
LODa (µg/L) |
Linear range (µg/L)
|
Sample
|
|||||
|
B1a |
B1b |
B1a |
B1b |
B1a |
B1b |
B1a |
B1b |
B1a |
B1b |
|
|
0.997 |
0.996 |
7.7 |
8.6 |
235 |
280 |
0.1 |
0.7 |
0.5-500 |
2.5-500 |
Water |
|
0.995 |
0.994 |
8.6 |
9.8 |
217 |
261 |
0.6 |
1.5 |
2.0-500 |
5.0-500 |
Fruit juice (orange) |
Extraction of abamectin from fruit juice samples
Due to the importance of the analysis of analytes in fruit juice samples, the proposed method was applied to determine the concentration of analytes in fruit juice samples, the obtained results are summarized in Table 3. In order to reduce the matrix effect; the fruit juice samples were diluted to 1:5, using deionized water. The chromatograms of the fruit juice (orange) sample before and after spiked at a 5.0 µg L-1 concentration level of analytes are shown in Fig. 6. The results (table 3) demonstrated that the fruit juice matrices had little effect on the USAEME method.
Table 3: Determination of abamectin (B1b and B1a) in fruit juice samples and relative recovery of spiked B1b and B1a in fruit juice samples
|
Relative recovery (%) |
Found B1b and B1a ( µg L-1) ± SD , n=3 |
Added of B1b and B1a ( µg L-1) |
Concentration of B1b and B1a ( µg L-1) |
Sample |
|||||
|
B1a |
B1b |
B1a |
B1b |
B1a |
B1b |
B1a |
B1b |
|
|
|
94 |
92 |
4.7 ± 0.3 |
4.6 ± 0.4 |
5.0 |
5.0 |
n.da. |
n.da. |
Fruit juice (Orange) |
|
|
92 |
90 |
4.6 ± 0.4 |
4.5 ± 0.5 |
5.0 |
5.0 |
n.d. |
n.d. |
Fruit juice (Kiwi) |
|
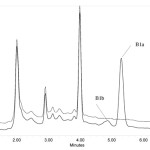 |
Figure 6: HPLC chromatograms of (b) before spiking with analytes in fruit juice (Orange), (a) 5.0 μg L-1 spiked of analytes in fruit juice after extraction via proposed method at optimum conditions. |
Conclusions
A new method for the determination of abamectin residues in fruit juice samples is proposed. USAEME were used as sample pretreatment procedure prior to the HPLC-UV determination. Under optimized working conditions, preconcentration factors in the range of 217-261 were obtained from the target analytes allowing to reach the LODs in the order of µg L-1 of the analytes with an acceptable precision, although the UV detection was used. The proposed method is rapid, simple and sensitive for monitoring the abamectin residues in fruit juice samples. The method was successfully applied to determination abamectin in fruit juice samples; satisfied recoveries and reproducibilty of the method were obtained.
Acknowledgement
Financial support by Tonekabon Branch, Islamic Azad University (Tonekabon, Iran) for the support during the period of this research is gratefully acknowledged.
References
- Grouch, L.S., Feely, W.F., Arison, B.H., Vanden Heuvel W.J.A., Colwell, L.F., Stearns, R.A., Kline, W.F. and Wislock, P.G. J. Agric. Food Chem. 39:1310 (1991).
- Crouch, L.S., Gordon, L.R., Feely, W.F., Maynard, M.S., Wise, L.D. and Wislock, P.G. J. Agric. Food Chem. 40 :88 (1992).
- Johan, V. J. Agric. Food Chem. 39:303 (1991).
- Diserens, H. and Henzelin, M. J. Chromatogr. A 833:13 (1999).
- Roudaut, B. Analyst 123:2541 (1998).
- Lucija, K., Jernej, K. and Nevenka, K.E. Biomed. Chromatogr. 18:117 (2004).
- Sari, P., Sun, J.G. and Razzak, M. J. Liq. Chrom. Relat. Tech. 29:2277 (2006).
- Dusi, G., Faggionato, E., Bertocchi, L., Facchett, I.S. and Baiguera, M. Ind Alment-Italy 40:11 (2001).
- Sherri, B.T., Josze, E.R., Wendy, C.A. and Laura, R.K. Anal. Chim. Acta 529: 159 (2005).
- Ozcan, S., Tor, A. and Aydin, M.E. Anal. Chim. Acta 640:52 (2009).
- López, E.P. and Luque de Castro, M.D. J. Chromatogr. A 1018:1 (2003).
- Capote, F.P. and De Castro, L. Anal. Chem. 25:9 (2006).
- Luque de Castro, M.D. and Priego-Capote, F. Talanta 72:321 (2007).
- Regueiroa, J., Llomparta, M., Garcia-Jaresa, C., Garcia-Monteagudob, J.C. and Celaa, R. J. Chromatogr. A 1190:27 (2008).
- Fontana, A.R., Wuilloud, R.G., Martinez, L.D. and Altamirano, J.C. J. Chromatogr. A 1216:147 (2009).
- Saleh, A., Yamini, Y., Faraji, M., Rezaee, M. and Ghambarian, M. J. Chromatogr. A 1216:6673 (2009).

This work is licensed under a Creative Commons Attribution 4.0 International License.
![]()
A New Edition of Web of Science
Journal Impact Factor
2022: 0.5
Five Year: 0.8
Journal is Indexed in

Cabells Whitelist
![]()


