Sol-gel Synthesis of Lanthanum, Cobalt and Titanium Oxide Composite
Mehran Riazian1 and Ali Ramzannezhad2
1Department of Chemistry, Tonekabon Branch, Islamic Azad University, Tonekabon, Iran. 2Department of Physics, University of Mazandaran, Babolsar, Iran.
We report on the synthesis, morphology, chemically and structurally of composite nanostructure. In the present work, ternary reactive powders in the composite systems have been obtained using the sol-gel method, by the simultaneous gelation of all cations. Composite powders have been characterized by XRD, SEM, EDAX and FTIR. X-ray diffraction showed the formation of nano crystalline anatase, La2 O5, La2O7Ti2 , Co, Co3 O4 and CoO2H phases. The average crystallite size was calculated by using X-ray diffraction analysis. Scanning electron microscopy revealed that particles with spherical shapes decrease by increasing the calcinations temperatures and congestion of particles decreases with increasing the molar ratio of titanium precursor. EDX spectroscopy confirmed the composition of the ternary powders, which are formed during the gelation process. FTIR spectra showed that Co-O, La-O, Ti-O and Ti-O-La bonds are formed. The effects of chemical compositions and the strong process on the surface topography and the crystallization of anatase were studied.
KEYWORDS:Nanostructure; Poly-component; Composite and Sol-Gel method
Download this article as:| Copy the following to cite this article: Riazian M, Ramzannezhad A. Sol-gel Synthesis of Lanthanum, Cobalt and Titanium Oxide Composite. Orient J Chem 2012;28(1). |
| Copy the following to cite this URL: Riazian M, Ramzannezhad A. Sol-gel Synthesis of Lanthanum, Cobalt and Titanium Oxide Composite. Available from: http://www.orientjchem.org/?p=11810 |
Introduction
Titanium dioxide (TiO2) is well known as a photocatalyst and widely applied for air and waste water purification. Titania is known to have three natural polymorphs, i.e. rutile, anatase, and brookite. Only anatase (figure 1) is generally accepted to have significant photocatalytic activity.
The performance of these compounds depends on the characteristic of the TiO2 crystallites, such as the size and surface area. Therefore, modification of its physical and chemical property is of interest to researchers. One of the possible ways to modify the property of TiO2 crystallites is by adding a second semiconductor into the TiO2 matrix. La compounds are easily obtained and it has been proved that modification of TiO2 with La-dopants shows significant improvement on both the photocatalytic activity and the thermal stability [1–4]. Cobalt oxide powder has a wide range of applications in various fields of industry including anode materials for rechargeable Li-ion battery, catalyst, gas sensor and magnetic materials [5–8]. The properties of Co3O4 in above applications are highly related to the particle size.
During the last years many studies dealing with TiO2 doping with different metals have shown the alterations that the dopant may cause on the catalyst surface [9–12]. Also, it has been observed that the dopant effect on the properties of semiconductor surface may vary according to the metal deposition method employed, type of metal used as a dopant and molecule to be degraded, among other variables.
Titania can be synthesized by various techniques, such as precipitation [13], chemical vapor deposition [14], hydrothermal method [15] and glycothermal method [16]. Another common technique that can result titania with extremely high surface area is sol-gel method. The sol-gel process is one of the versatile methods to prepare ceramic materials. Currently, the sol-gel process is employed quite often for synthesis of nanosize catalytic materials. The incorporation of an active metal in the sol during the gelation stage allows the metal to have a direct interaction with support, therefore the material possess special catalytic properties. As is well known, titania is a photoexcited catalyst [17]. Although titania-supported metal catalysts have been extensively studied, the procedure of preparing photocatalytic titania are still of great interest. The design of advanced ceramics depends on the availability of powders with outstanding properties in terms of composition, purity, size, and size distribution. Sol-gel processes allow synthesis powders to have a more elaborate structure. Preparation of nanosized oxide powders by sol-gel method represents, for the time being, an important goal for the scientists working in the field.
The synthesis of inorganic materials such as metal oxides with different morphologies for specific applications has attracted a considerable amount on interest in recent years, and has been a challenging issue for chemists and material researchers. It is well recognized that the properties of materials highly depend on size, morphology, and dimensionality [18], three crucial geometric parameters. Many chemical and physical routes are explored by chemists and material researchers to control those parameters and to obtain various shapes of materials such as tubes, rods, plates, and so on [19], including the template method, laser ablation, chemical vapor deposition, hydrothermal method, etc. Among all metal oxides, TiO2 powders are extensively used as catalysts, adsorbents, composites, ceramics, and catalyst supports because of their high surface area and significant pore volume. In this work we prepare ternary composite by using hydrolysis procedure of Tetra isopropyl ortho titanate, Lanthanum nitrate and Cobalt nitrate. It obviously depends on the preparation procedures and TiO2 content in combination.
Experimental procedures and details
The composition of the starting solution and the experimental conditions used for ternary powders are listed in table (1). The precursors: Cobalt nitrate (Co(NO3)2.6H2O, Merk, ), tetra isopropy ortho titanate (TIOT, Merk ), Lanthanum nitrate (La(NO3)3.6H2O, Fluka, ), HNO3 (Merk,63.01%(, CH3COOH (Fluka, 60.5%) , Ethanol (Merk ) and deionized water were used without further purification. In MR=2, the molar ratio of TIOT in combination is twice of molar ratio of lanthanide nitrate and cobalt nitrate. In MR=1, the molar ratio of TIOT, lanthanide nitrate and cobalt nitrate in precursors combination is equal.
The starting point for the synthesis of a targeted system was a solution prepared by mixing precursors: (Co(NO3)2.6H2O, deionized water, HNO3), (TIOT, deionized water, ethanol, Acetic acid) and (La(NO3)3.6H2O, deionized water, HNO3) separately at room temperature (RT) for 2 hours. After then, above solutions mixed vigorously at RT. After 72 hours gelation was formed. Afterward, the gel was dried for about 24 hours at 50 oC temperature in air and calcined at 10 oC/min to three different temperatures (200, 400 and 600 0C) and held there for 2 h.
Table 1: Composition of starting solutions and experimental conditions for ternary powders preparation.
|
Sol-gel Method used |
Sol-gel Method step |
Precursors and Molar ratio (MR) |
Stirring Time(h) |
PH |
|
|
TIOT / La(NO3)3.6H2O/Co(NO3)2.6H2O =1:1/1. TIOT / La(NO3) 3.6H2O /Co(NO3) 2.6H2O =2:1/1. |
|||||
|
Alkoxide route |
1 |
TIOT |
TIOT/CH3COOH / EtOH/H2O=1:4/50/2 |
2 |
2 |
|
La(NO3)3.6H2O |
La(NO3) 3.6H2O /HNO3/H2O=1:4/20. |
2 |
5 |
||
|
Co(NO3)2.6H2O |
Co(NO3) 2.6H2O /HNO3/H2O=1:4/20. |
2 |
3 |
||
|
2 |
Mixing the precursors |
24 |
3 |
||
Characterization of the composite
X-ray powder diffraction study
X-ray powder diffraction (XRD) patterns were measured on a (GBC-MMA 007 (2000)) X-ray diffractometer. The diffractograms were recorded with 0.02o step size in where the speed was ) radiation over a 2θ range of 10◦–80◦.
Scanning electron microscopy and EDX (Energy dispersive spectrometer)
SEM (XL30 Philips) was routinely used to investigate the morphology of the nanoparticles. Further investigation was confirmed with EDX to determine the chemical composition in the sample. The results showed in Figures 3 and 4.
FT-IR study
FT-IR measurements were performed on a 1730 Infrared Fourier Transform Spectrometer
(Perkin-Elmer) using the potassium bromide as the background.
Results and Discussion
Crystallographic phases of the composite powders were investigated by XRD method figures (3,4) and assignments of the XRD peaks are summarized in table (2). Due to different hydrothermal treatment crystalline phases are formed. Figure (3) shows the XRD patterns of powder obtained from gels after drying and calcinating at 200 oC, 400 oC and 600 oC with gradient and stayed in 2 hours, after then, they cooled in similar temperature gradiant. This figure shows the amorphous structure for 200 oC, 400 oC and 600 oC samples due to the short range ordering of the network [23]. Figures 2 and 3, also show anatase phase that is tetragonal with crystalline system ( a= 3.7850 , c=9.5140 ).
Samples obtained from as-prepared have a high degree of the crystallinity and show mentioned phases. The grain size values were calculated from Scherrer equation:

Where λ = 0.154 nm, and θ is the reflection angle.
Data in Tables (2 and 3) show the influence of hydrothermal treatment (calcination) on the grain size of anatase and other phases. As seen in figures (2 and 3), the crystallization decreases with increasing the calcined temperature and there are not prominence phase that calcined at 200, 400 and 600 oC. This property can be used as gate dielectric in ultrathin insulator in FET gates (Filed Effect Transistor). There are not rutile or brookite phases in composites. Zener pinning could be used to restrict the growth of nanocrystalline metal oxide in sol-gel method during the calcination stage [21 and 22]. This process involves the dopant material, which exist as discrete particles at the nanocrystal interfaces and pins the grain boundaries in place by restricting surface diffusion and reducing the radius of curvature of nanoparticles [23].
 |
Figure 1: Schematic model of anatase. |
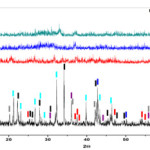 |
Figure 2: .XRD patterns of composite for molar ratio (MR) =1correspond to table (1) obtained from: without hydrothermal treatment (as-prepared), calcined at 200 oC, calcined at 400 oC and calcined at 600 oC. |
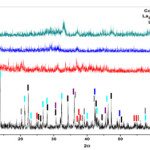 |
Figure 3: XRD patterns of composite for molar ratio (MR) =2 correspond to table (1) obtained from: without hydrothermal treatment (as-prepared), calcined at 200 oC, calcined at 400 oC and calcined at 600 oC. |
SEM images of composite nanoparticles are shown as figures (4 and 5). As shown in figures, for less molar ratio and less calcined temperature, the powder samples possess more particle compression and more granular particles. The SEM images of as-prepared sample with MR=1 and has the most particle compression. It can be indicated that by increasing the calcined temperature in both of MR=1 and MR=2.
Table 2: The 2θ angle, d-space, Miller indexes, grain size of composite for MR=1.
|
Molar ratio TEOS/ATSB/TIOT=1 |
|||
|
size(nm) |
d-space(Ao) |
2Θ |
Phase |
|
33 |
3.52 |
25.22 |
Anatase Tetragonal a=3.8040 Ao c=9.6140 Ao |
|
100 |
2.62 |
34.16 |
La2O5 Orthorhombic a=10.9700 Ao b=11.3700Ao c=3.9300 Ao |
|
146 |
2.77 |
32.26 |
La2O7Ti2 Monoclinic a=7.8000 Ao b=13.0110 Ao c=5.5460 Ao |
|
411 |
2.11 |
42.76 |
Co Cubic a=3.4670 Ao |
|
101 |
2.55 |
35.04 |
Co3O4 Cubic a=8.1975 Ao |
|
125 |
4.39 |
20.22 |
CoO2H Hexagonal a=2.8510 Ao c=13.1500 Ao |
Table 3: The 2θ angle, d-space, Miller indexes, grain size of composite for MR=2
|
Molar ratio TEOS/ATSB/TIOT=0.5 |
|||
|
size(nm) |
d-space(Ao) |
2Θ |
Phase |
|
70 |
3.51 |
25.29 |
Anatase Tetragonal a=3.8040 Ao c=9.6140 Ao |
|
148 |
2.62 |
34.28 |
La2O5 Orthorhombic a=10.9700 Ao b=11.3700Ao c=3.9300 Ao |
|
86 |
2.76 |
32.28 |
La2O7Ti2 Monoclinic a=7.8000 Ao b=13.0110 Ao c=5.5460 Ao |
|
99 |
2.12 |
42.60 |
Co Cubic a=3.4670 Ao
|
|
166 |
2.54 |
35.14 |
Co3O4 Cubic a=8.1975 Ao |
|
108 |
4.37 |
20.28 |
CoO2H Hexagonal a=2.8510 Ao c=13.1500 Ao |
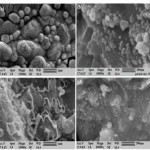 |
Figure 4: SEM images of powder composite for MR=1 (a) as-prepared,(b) 200 oC, (c)400 oC and (d) 600 oC. |
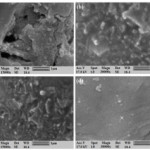 |
Figure 5: SEM images of powder composite for MR=2 (a) as-prepared,(b) 200 oC, (c)400 oC and (d) 600 oC. |
The presence of the participants in two different molar ratios for powders according to table 1 were confirmed by EDX spectra (figures 7 and 8). As can be seen in tables (3 and 4), the results indicated the presence of Ti, La and Co in the powder samples. Samples with MR=2 have more Ti content in composite than samples with MR=1. In all samples, La has the most portion in composite.
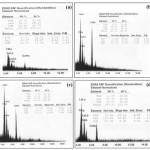 |
Figure 6: EDX results and elemental analysis of powder composite for MR=2, at: (a) as-prepared,(b) 200 oC, (c)400 oC and (d) 600 oC. Click here to View figure |
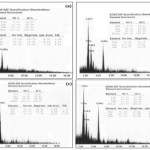 |
Figure 7: EDX results and elemental analysis of powder composite for MR=1, at: (a) as-prepared,(b) 200 oC, (c)400 oC and (d) 600 oC.
|
Table 3: Chemical composition obtained from EDX for powder composite with MR=1.
|
Powder sample with MR=1 As-prepared |
|||
|
Error(%) |
Atomic percent |
Weight percent |
Element |
|
4.75 2.23 3.18 |
13.27 42.90 43.83 |
6.93 64.93 28.14 |
Ti La Co |
|
200 oC |
|||
|
4.25 2.69 3.24 |
16.11 36.06 47.83 |
8.97 58.25 32.78 |
Ti La Co |
|
400 oC |
|||
|
8.64 4.33 4.36 |
12.27 32.65 55.08 |
7.02 54.20 38.78 |
Ti La Co |
|
600 oC |
|||
|
3.61 2.50 2.82 |
17.49 32.59 49.92 |
10.09 54.50 35.42 |
Ti La Co |
Table 4: Chemical composition obtained from EDX for powder composite with MR=2.
|
Powder sample with MR=2 As-prepared |
|||
|
Error(%) |
Atomic percent |
Weight percent |
Element |
|
3.70 4.65 7.35 |
41.08 29.15 29.77 |
25.32 52.10 22.58 |
Ti La Co |
|
200 oC |
|||
|
2.65 1.52 1.42 |
11.64 28.20 60.16 |
6.95 48.84 44.21 |
Ti La Co |
|
400 oC |
|||
|
3.65 2.46 2.86 |
17.52 34.31 48.18 |
9.94 56.44 33.62 |
Ti La Co |
|
600 oC |
|||
|
4.86 3.48 4.31 |
20.24 36.38 43.38 |
11.30 58.90 29.80 |
Ti La Co |
The FTIR spectra of different calcinations temperature of composite powder were recorded in the wave number range of 400-4000 cm-1 (figure (11). The composite of each sample shows the fundamental vibration modes. In the prepared gel, the 3200 cm-1 band has to be attributed to hydroxyl groups (Ti-OH) and to OH from water and ethanol which are occluded in the titania pore. The OH bending band of water in the gel is observed at 1650 cm-1 and the low energy interval the Ti-O band are found at 1061 and below 1000 cm-1. The observed band near 550 cm-l is attributed to the longitudinal optical mode (LO) of CoO. The observed peak near 1450 cm-1 is assigned to dd(CH3). This peak was not observed in MR=2 state. The IR spectrum of LaCoO3 presents an intense band around 605 cm-1 that could be assigned to vibration of Co-O bond in octahedral coordination and a band from 420 cm-1 assigned to vibration of La-O bond in dodecahedral coordination [24]. The absorption peak near 500 cm-1 shown in the figure is caused by Ti-O-La bond formation that makes the absorption peak shift to low wave number, the same to the reported results[25]. The intensity of absorption peaks decrease with increasing the calcined temperature and molar ratio of TiO2 precursor. This may be due to decrease of chemical binding power with increasing calcined temperature composite. When the composite was calcined at 600oC, the high energy stretching band almost fades and the 3200 and 1600 cm-1 bending vibration band intensity decreases due to vaporization of the liquid.
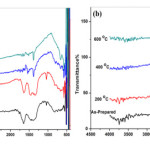 |
Figure 8: FTIR spectra of composite calcined at different temperatures (a) for MR=1 and (b) for MR=2. |
Conclusion
The homogeneous hydrolysis of metal alkoxide provided an excellent technique to prepare nanoparticle material. Experimental results indicated that the homogeneous hydrolysis of tetra isopropy ortho titanate, Lanthanum nitrate and Cobalt nitrate via sol-gel route is a promising technique for preparing uniform nanoparticles. In this study, nanocrystalline particles have been successfully synthesised by chemical method and heat treatment process. Samples calcined at different temperature and degree of crystallization decreased with an increase in calcined temperatures so that samples showed amorphous phase. This property can be used as gate dielectric in ultrathin insulator in FET gates (Filed Effect Transistor). The effect of composite on the structural properties of powders prepared by sol-gel technique has been examined. The powders calcined at 200, 400 and 600 oC. X-ray diffraction spectra showed anatase, La2O5, La2O7Ti2, Co, Co3O4 and CoO2H phases . Scanning electron microscopy measurements showed nanostructure and morphology of powders. Chemical composition of samples were determined with EDX. FTIR spectra of the ternary composite was presented and showed the possible bonds. The intensity of absorption peaks decrease with increasing the calcined temperature and molar ratio of TiO2 precursor.
References
- Jing L. Q., Sun X. J., Xin B. F., Wang B. Q., Cai W. M., Fu H. G., J. Solid State Chem. 177, 3375–3382 (2004).
- Wu X. H., Ding X. B., Qin W, He W. D., Jiang Z. H., Hazard, J. Mater. B. 137, 192–197 (2006).
- Yuan Sh., Sheng Q. R., Zhang J. L., Chen F., Anpo M., Zhang Q. H., Microporous Mesoporous Mater. 79, 93–99 (2005).
- Atribak I., Such-Basanez I., Bueno-Lopez A., Garcia Garcia A., Catal. Commun. 8, 478–482 (2007).
- Koinuma M., Hirae T., Matsumoto Y., J. Mater. Res. 13, 837 (1998).
- Jansson J., Palmqvist A.E.C., Fridell E., J. Catal. 211, 387 (2002).
- Choi S. D., Min B. K., Sens. Actuators B. 77, 330 (2001).
- Makhlouf S. A., Magn, J. Mater. 246, 184 (2002).
- Seok Jeon M., Yoon W. S., Joo H., Lee T. K., Lee H., , Appl. Surf. Sci. 165, (2–3), 209 (2000).
- Gesenhves V., J. Photochem, Photobiol. A: Chem. 139, (2–3) 243, (2001).
- He C., Yu Y., Hu X.and A. Labort, Appl. Surf. Sci. 200 (1–4) 239, (2002).
- Garzella C., Bontempi E., Depero L. E., Vomiero A., Della Mea G. and Sberveglieri G., Sens. Actuators, B: Chem. 93 (1–3) 495, (2003).
- Kim S.J., Park S.D., Jeong Y.H., Park S., J. of the American Ceramic Society. 82 , 927–932 (1999).
- Ding Z., Hu X. J., Lu G. Q., Yue P. L., Greenfield P. F., Langmuir, 16, 6216–6222 (2000).
- Yang J., Mei S., Ferreira J. M. F., J. of the American Ceramic Society, 8,1696–1702 (2001).
- Iwamoto S., Tanakulrungsank W., Inoue M., Kagawa K., Praserthdam P., Synthesis of large-surface area silica-modified titania ultrafine particles by the glycothermal method, Journal of Materials Science Letters, 19, 1439–1443(2001).
- Anpo M., Yamashita H., Ichihashi Y. and Ehara S., J. Electroanalyt. Chem. 396, 21–26 (1995).
- Scott R. W, Maclachlan M. J., Ozin G. A. and Curr O., Solid State Mater Sci. 4:113–21 (2003).
- Li M., Lebeau B. and Mann S. Adv Mater 15, 2032–5 (2003).
- Hochbaum A.I., Fan R., He R. and Yang P., Nano Lett. 5, 457 (2005).
- O’Dell L. A., Savin S. L. P., Chadwick A. V., Smith M. E., Faraday Discuss. 134, 83-102 (2007).
- Chadwick A. V., Savin S. L. P., O’Dell L. A., Smith M. E., J. Phys.: Condens. Matter, 18, 163-170 (2006).
- O’Dell L. A., Savin S. L. P., Chadwick A. V. and Smith M. E., J. Phys. Chem. C. 111, 13740-13746 (2007).
- Ganguly P., Vasanthacharya Y., J. Solid State Chem. 61, 164(1986).
- Sibu C. P.; Kumar S. R.; Mukundan P., Warrier K. G. K. Chem. Mater., 2876–2881 (2002).

This work is licensed under a Creative Commons Attribution 4.0 International License.
![]()
A New Edition of Web of Science
Journal Impact Factor
2022: 0.5
Five Year: 0.8
Journal is Indexed in

Cabells Whitelist
![]()


