RP-HPLC Method for the Simultaneous Estimation of Sitagliptin Phosphate and Metformin Hydrochloride in Combined Ttablet Dosage Forms
Swati D. Bhende1*, Murali Balaram Varanasi2, Konde Abbulu3, M. Divya Swetha1, V. Shravanthi1, J. Karuna Kumari1 and T. Shayamala1
1Department of Pharmaceutical Analysis, Jyothishmathi College of Pharmacy, Turkapally, Shamirpet, R.R. District, Andhra Pradesh – 500078 (India).
2Department of Pharmaceutical Analysis, Sultan-Ul-Uloom College of Pharmacy, Banjara Hills, Hyderabad, Andhra Pradesh - 500034 (India).
3Department of Pharmaceutics, Malla Reddy Institute of Pharmaceutical Sciences, Maisammaguda, Dhulapally, Secunderabad, Andhra Pradesh -500014 (India).
A reverse phase high performance liquid chromatography (RP-HPLC) method for the simultaneous estimation of Sitagliptin phosphate and Metformin hydrochloride in marketed tablet formulations is developed. The determination was carried out on an XTerraC8 (4.6 × 100 mm, 3 µm) column using a mobile phase of pH-9 phosphate buffer solution: acetonitrile: methanol in the ratio of 35:45:20. The flow rate was 0.6 ml/min. The analyte was monitored using UV detector at 260 nm. The retention time for Sitagliptin phosphate was 3.056 mins and for Metformin hydrochloride 2.420 mins. Linearity of Sitagliptin and Metformin were found in the range of 50 ppm to 150 ppm. Percentage recoveries were obtained in the range of for Sitagliptin 99.5% and for Metformin 100.4%. The proposed method is precise, accurate, selective, robust, reproducible and rapid for the simultaneous estimation of Sitagliptin phosphate and Metformin hydrochloride in tablet dosage forms.
KEYWORDS:Sitagliptin phosphate; Metformin HCl; RP-HPLC; UV
Download this article as:| Copy the following to cite this article: Bhende S. D, Varanasi M. B, Abbulu K, Swetha M. D, Shravanthi V, Kumari J. K, Shayamala T. RP-HPLC Method for the Simultaneous Estimation of Sitagliptin Phosphate and Metformin Hydrochloride in Combined Ttablet Dosage Forms. Orient J Chem 2012;28(1). |
| Copy the following to cite this URL: Bhende S. D, Varanasi M. B, Abbulu K, Swetha M. D, Shravanthi V, Kumari J. K, Shayamala T. RP-HPLC Method for the Simultaneous Estimation of Sitagliptin Phosphate and Metformin Hydrochloride in Combined Ttablet Dosage Forms. Orient J Chem 2012;28(1). Available from: http://www.orientjchem.org/?p=23992 |
Introduction
In this experiment, efforts were focused on making the most of all the inherent advantages offered by reversed-phase HPLC to develop a time saving, economical and practical method which would be of immense assistance to quality control laboratories to ensure the identity, purity and performance of the drug product.
Metformin HCl (Met) is 3-(diaminomethylidene)-1, 1-dimethylguanidine, an oral anti-diabetic drug which is the first line drug of choice for the treatment of type 2 diabetes, particularly in obese peoples and those with normal kidney function. Metformin improves hyperglycemia, primarily through its suppressive action on production of hepatic glucose1,2. Sitagliptin (SIT) is (3R) -3-amino-1-[3-(trifluoromethyl)-6,8-dihydro-5h- [1,2,4] triazolo [3,4-c]pyrazin-7-yl]-4-(2, 4, 5-trifluorophenyl) butan-1-one, an oral anti-diabetic agent that blocks dipeptidylpeptidase-4 (DPP-4) activity. Sitagliptin increases incretin levels (GLP-1 and GIP) which inhibit glucagon release and more significantly increases insulin secretion1.
Literature reveals that UV spectrosctroscopy,HPLC,chemometric – assisted spectrophotometric and HPLC method,GC-MS,liquid chromatography tandem mass spectrometry methodshave been reported for the estimation of metformin HCl and Sitagliptin phosphate. But no method is reported so far for the combination of Sitagliptin phosphate and Metformin HCl using given experimental conditions3, 4, 5, 6, 7. A successful attempt is made to estimate the two drugs simultaneously. Therefore it was thought worthwhile to develop an accurate, precise and rapid RP-HPLC method for simultaneous estimation of sitagliptin and metformin from tablet formulations.
Instrumentation
A HPLC Make WATERS with separation module -waters 2695 with double reciprocating pump, dual λ absorbance detector –WATERS 2487 and RP-C8 column (3 µm particle size) was used. The RP-HPLC system was equipped with software EMPOWER-2 for data processing.
Chemicals and reagents
The solvents acetonitrile, methanol, pH-9 Phosphate buffer used were of HPLC grade. API of Sitagliptin phosphate and Metformin HCl are obtained as gift samples from Mylan laboratories Ltd., Bollaram, Hyderabad. Marketed formulation JANUMET was procured from the local market.
Chromatographic conditions
The isocratic mobile phase consisted Acetonitrile: Methanol: Phosphate buffer pH-9 flowing through the column at a constant flow rate of 0.6 ml/min. An XTerra C8 (4.6 × 100 mm, 3 µm) column was used as the stationary phase. Although the SIT and MET have different λmax viz 240 nm and 256 nm respectively, but considering the chromatographic parameter, sensitivity and selectivity of method for two drugs, 260 nm was selected as the detection wavelength for UV‐PDA detector.
Preparation Of Metformin And Sitagliptin Standard And Stock Solutions
Standard solution preparation
Accurately weigh and transfer 25 mg of Metformin and 25 mg of Sitagliptin working standard into a 10 ml clean dry volumetric flask, add about 7 ml of diluent with shaking to dissolve it completely and make volume up to the mark with the same solvent (Stock solution). Further pipette 0.4 ml of the above stock solution into a 10 ml volumetric flask and make up to the mark with diluent.
Sample solution preparation
Accurately weigh and transfer a quantity equivalent to 25 mg of Metformin and 25 mg of Sitagliptin sample into a 10 ml clean dry volumetric flask add about 7 ml of diluent and sonicate to dissolve it completely and make volume up to the mark with the same solvent.
Further pipette 0.4 ml of Metformin and Sitagliptin of the above stock solution into a 10 ml volumetric flask and dilute up to the mark with diluent.
Procedure
Inject 20 mL of the standard, sample into the chromatographic system and measure the areas, retention time and resolution for Metformin and Sitagliptin peaks and calculate the % Assay by using the formula.
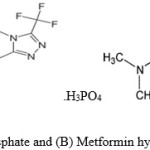 |
Figure 1: (A) Sitagliptin phosphate and (B) Metformin hydrochloride |
Method Validation
Validation of HPLC method
The proposed RP-HPLC method was validated for the following parameters.
System suitability
The system suitability was assessed by replicate analysis of six injections of Metformin and Sitagliptin of concentration 0.1 mg/ml each.
System suitability parameters such as retention time, resolution and peak tailing were determined. The acceptance criteria were that the % RSD should not be more than 2 % and the number of theoretical plates should not be less than 2000 8. The results obtained are shown in Table 1.
Table 1: System suitability parameters
|
S.no. |
Parameters |
Metformin |
Sitagliptin |
|
1 |
Retention time |
2.416 |
3.046 |
|
2 |
Resolution |
– |
2.2 |
|
3 |
Tailing factor |
1.5 |
1.5 |
|
4 |
No. of theoretical plates |
2350 |
2444 |
Specificity
The specificity of the RP-HPLC method was demonstrated by interference check by injecting the diluent blank and placebo solution to determine whether any peaks in the diluent and placebo solution are co-eluting with the peaks of Metformin and Sitagliptin.
Limit of detection (LOD) and Limit of Quantitation (LOQ)
The LOD and LOQ were determined by calculating the signal to noise ratio.
For Limit of detection (LOD)
Accurately weighed 25 mg of Metformin working standard was transferred to a 10 ml volumetric flask and it was dissolved and made up to the mark with the diluent and mixed well. A volume of 0.4 ml of the stock solution was transferred to a 10 ml volumetric flask and diluted up to the mark with the diluent. Further dilutions were made to obtain a concentration of 0.03 μg/ml.
Same procedure was applied to obtain a solution of Sitagliptin of concentration 0.03 μg/ml.
The S/N ratio should be between 3 or 2:18.
The S/N ratio for Metformin is 2.9 and the S/N ratio for Sitagliptin is 3.0.
The LOD for Metformin was found to be 0.03 μg/ml and for Sitagliptin was found to be 0.03 μg/ml.
For Limit of Quantitation (LOQ)
Accurately weighed 25 mg of Metformin working standard was transferred to a 10 ml volumetric flask and it was dissolved and made up to the mark with the diluent and mixed. A volume of 0.4 ml of the stock solution was transferred to a 10 ml volumetric flask and diluted up to the mark with the diluent. Further dilutions were made to obtain a concentration of 0.1 μg/ml.
Same procedure was applied to obtain a solution of Sitagliptin of concentration 0.1 μg/ml.
The S/N ratio should be 10:18.
The S/N ratio for Metformin is 10.03 and the S/N ratio for Sitagliptin is 10.1.
The LOD for Metformin was found to be 0.1 μg/ml and for Sitagliptin was found to be 0.1 μg/ml.
Linearity
Accurately weighed 25 mg of Metformin and 25 mg of Sitagliptin working standard was transferred to a 10 ml volumetric flask and it was dissolved and made up to the mark with the diluent and mixed.
Preparation of Level I solution (50 ppm of Metformin and 50 ppm of Sitagliptin)
A volume of 0.2 ml of the stock solution was taken into a 10 ml volumetric flask and diluted up to the mark with the diluent.
Preparation of Level II solution (75 ppm of Metformin and 75 ppm of Sitagliptin)
A volume of 0.3 ml of the stock solution was taken into a 10 ml volumetric flask and diluted up to the mark with the diluent.
Preparation of Level III solution(100 ppm of Metformin and 100 ppm of Sitagliptin)
A volume of 0.4 ml of the stock solution was taken into a 10 ml volumetric flask and diluted up to the mark with the diluent.
Preparation of Level IV solution(125 ppm of Metformin and 125 ppm of Sitagliptin)
A volume of 0.5 ml of the stock solution was taken into a 10 ml volumetric flask and diluted up to the mark with the diluent.
Preparation of Level V solution (150 ppm of Metformin and 150 ppm of Sitagliptin)
A volume of 0.6 ml of the stock solution was taken into a 10 ml volumetric flask and diluted up to the mark with the diluent.
Accuracy
Accuracy was calculated with respect to 50 %, 100 % and 150 % of the target assay concentration. The accuracy of the method was demonstrated through recovery studies8.
Preparation of Standard stock solution
Accurately weighed 25 mg of Metformin and 25 mg of Sitagliptin working standard was transferred to a 10 ml volumetric flask and it was dissolved and made up to the mark with the diluent and mixed. A volume of 0.4 ml of the stock solution was transferred to a 10 ml volumetric flask and diluted up to the mark with the diluent.
Preparation of Sample solutions
For preparation of 50 % solution (with respect to target assay concentration)
Accurately weighed 11.5 mg of Metformin and 12.1 mg of Sitagliptin working standard was transferred to a 10 ml volumetric flask and it was dissolved and made up to the mark with the diluent and mixed. A volume of 0.4 ml of the stock solution was transferred to a 10 ml volumetric flask and diluted up to the mark with the diluent.
For preparation of 100 % solution (with respect to target assay concentration)
Accurately weighed 17.8 mg of Metformin and 17.9 mg of Sitagliptin working standard was transferred to a 10 ml volumetric flask and it was dissolved and made up to the mark with the diluent and mixed. A volume of 0.4 ml of the stock solution was transferred to a 10 ml volumetric flask and diluted up to the mark with the diluent.
For preparation of 150 % solution (with respect to target assay concentration)
Accurately weighed 37.8 mg of Metformin and 39.3 mg of Sitagliptin working standard was transferred to a 10 ml volumetric flask and it was dissolved and made up to the mark with the diluent and mixed. A volume of 0.4 ml of the stock solution was transferred to a 10 ml volumetric flask and diluted up to the mark with the diluent.
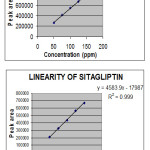 |
Figure 2: Linearity graphs |
The standard solution, Accuracy- 50 %, Accuracy-100 % and Accuracy-150 % solutions were injected. The amount found was calculated and depending on the amount added the individual recovery and the mean recovery values were calculated. The results for accuracy are given in Table 2
Table 2: Accuracy results of Metformin hydrochloride and Sitagliptin phosphate
|
Sample Name |
%Concentration (at specification Level) |
Amount added (mg) |
Amount found (mg) |
% Recovery |
Mean Recovery |
% RSD |
|
Metformin hydrochloride |
50% |
13.1 |
13.06 |
99.7% |
99.7% |
0.32 |
|
100% |
20.6 |
20.24 |
98.6% |
0.79 |
||
|
150% |
41.2 |
41.69 |
101.2% |
0.02 |
||
|
Sitagliptin phosphate
|
50% |
13.5 |
13.28 |
98.3% |
99.5% |
0.10 |
|
100% |
20.6 |
20.27 |
98.4% |
0.59 |
||
|
150% |
43.0 |
43.76 |
101.7% |
0.34 |
Precision
The precision of the method was demonstrated through two parameters which are injection reproducibility (method precision) and intermediate precision8.
For injection reproducibility, a solution of 0.1 mg/ml was injected for 5 times and the peak areas of these 5 injected samples were calculated.
The %RSD should not be more than 2.
For intermediate precision, the above procedure was repeated on a different day by using a different HPLC system and by a different analyst.
The %RSD should not be more than 28.
The results for Method precision and intermediate precision are summarized in Table 3 and Table 4 respectively.
Table 3: Method precision
|
S. no. |
Peak Name |
No. of Injection |
Retention Time |
Peak Area |
Mean Area |
Standard Deviation |
% RSD |
|
1 |
Metformin |
1 |
2.389 |
383400 |
394820 |
6581.2 |
1.67 |
|
2 |
Metformin |
2 |
2.392 |
397452 |
|||
|
3 |
Metformin |
3 |
2.393 |
395218 |
|||
|
4 |
Metformin |
4 |
2.390 |
399527 |
|||
|
5 |
Metformin |
5 |
2.388 |
398504 |
|||
|
6 |
Sitagliptin |
1 |
3.037 |
301668 |
310088 |
5553.5 |
1.79 |
|
7 |
Sitagliptin |
2 |
3.040 |
312863 |
|||
|
8 |
Sitagliptin |
3 |
3.040 |
307253 |
|||
|
9 |
Sitagliptin |
4 |
3.038 |
313711 |
|||
|
10 |
Sitagliptin |
5 |
3.038 |
314947 |
Table 4: Intermediate precision
|
S. no. |
Peak Name |
No. of Injection |
Retention Time |
Peak Area |
Mean Area |
Standard Deviation |
% RSD |
|
1 |
Metformin |
1 |
2.399 |
415817 |
416765 |
1310.9 |
0.31 |
|
2 |
Metformin |
2 |
2.404 |
418734 |
|||
|
3 |
Metformin |
3 |
2.403 |
417081 |
|||
|
4 |
Metformin |
4 |
2.403 |
416839 |
|||
|
5 |
Metformin |
5 |
2.406 |
415353 |
|||
|
6 |
Sitagliptin |
1 |
3.034 |
319396 |
318075 |
2455.3 |
0.77 |
|
7 |
Sitagliptin |
2 |
3.040 |
314106 |
|||
|
8 |
Sitagliptin |
3 |
3.038 |
317270 |
|||
|
9 |
Sitagliptin |
4 |
3.044 |
319846 |
|||
|
10 |
Sitagliptin |
5 |
3.046 |
319757 |
Robustness
The robustness study was done by making small changes in the optimized method8. Variations in the parameters like ±0.1 change in pH, ±1% change in mobile phase ratio, ±1% change in column temperature, change in the flow rate to 0.5 ml/min and 0.7 ml/min were made to evaluate the impact on the method. There was no significant impact on the retention time and tailing factor.
Assay of marketed preparation
Ten tablets were weighed and crushed to fine powder. The tablet powder equivalent to 352.5 mg of Sitagliptin phosphate and 352.55 mg of Metformin hydrochloride was transferred to a 10 ml volumetric flask and dissolved in mobile phase and the content was sonicated for 10 min. Finally, the volume was made up to the mark with mobile phase. This solution was further diluted with mobile phase to obtain mixed sample solution containing 500 mg of Metformin HCl and 50 mg of Sitagliptin phosphate. A 20 µl of sample solution was injected into sample injector for six times under chromatographic conditions as described above. Area of each peak was measured at 260 nm. The amount of each drug present in the sample was determined from peak area of SIT and MET present in the pure mixture and percent label claim and Standard deviation (SD) was calculated.
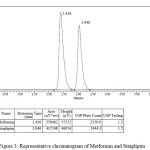 |
Figure 3: Representative chromatogram of Metformin and Sitagliptin |
Calculations
% purity of sample =
![]()
Percentage purity of Metformin hydrochloride = 101.41%
Percentage purity of Sitagliptin phosphate = 101.65%
Conclusion
The present work describes RP-HPLC method for estimation of Sitagliptin phosphate and Metformin hydrochloride in tablets. Both the drugs were resolved on XTerra C8 (100 x 4.6 mm, 3 µm) column using ACN: Methanol: phosphate buffer pH-9 (45:20:35) as mobile phase with a flow rate of 0.6 ml/min, UV detection was performed at 260 nm. Linearity response was found in the concentration range of 50-150 µg/ml for both the drugs. The correlation coefficients (‘ r ‘ value) for Sitagliptin and Metformin are 0.9995 and 0.9994 respectively. The %RSD for the tablet analysis and recovery studies was less than 2 % and the percentage recoveries were obtained within the limit 99 to 102%, indicating high degree of accuracy. The %RSD of Sitagliptin and Metformin for injection reproducibility and inter-day precision was less than 2 % indicating high degree of precision. The results of the robustness study also indicated that the method is robust and is unaffected by small variations in the chromatographic conditions. The result of ruggedness study was found to be satisfactory. Hence, it can be concluded that the developed RP-HPLC method is accurate, precise, and selective and can be employed successfully for the simultaneous estimation of Sitagliptin and Metformin in both bulk and multicomponent formulation.
Acknowledgements
Authors are thankful to the management and principal of the Jyothishmathi College of Pharmacy, Turkapally, Sharmirpet, to Mr. Chandra Shekar Reddy, director of Pharmatrain for his arduous and meticulous guidance throughout the course of this dissertation work and to Mylan Laboratories Ltd. Bollaram, Hyderabad, for the gift sample of Sitagliptin phosphate and Metformin hydrochloride.
References
- http://www.medicinenet.com/metformin_and_sitagliptin/article.htm
- http://www.drugs.com/pro/metformin.html
- K.S. Lakshmi, T. Rajesh and S. Sharma, Int. J. Pharm. and Pharma. Sci., Vol. 1, Issue 2,162-166 (2009).
- RamziaI. El-Bagary, Ehab F. Elkady and Bassam M. Ayoub, Int. J. Biomed. Sci., Vol. 7, Issue 1, 62-69 (2011).
- M. Vasudevan, J. Ravi, S. Ravishankar and B. Suresh., J. Pharm. Biomed. Anal., Vol. 25, Issue 1, 77-84 (2001).
- Bala Sekaran C. and Prameela Rani A., Int. J. Pharm. and Pharma. Sci., Vol. 2, Issue 4, 138-142 (2010).
- John G. Swales, Richard T. Gallagher, Mark Denn and Raimund M. Peter, J. Pharma. and Biomed. Anal., Vol. 55, Issue 3, 544-551 (2011).
- http://www.emea.europa.eu/docs/en_GB/document_library/Scientific_guideline/2009/09/WC500002662.pdf

This work is licensed under a Creative Commons Attribution 4.0 International License.
![]()
A New Edition of Web of Science
Journal Impact Factor
2022: 0.5
Five Year: 0.8
Journal is Indexed in

Cabells Whitelist
![]()


