Neutron Activation Analysis of Some Nigerian Bitumen Samples and their Components
H.O. Ogunsuyi1, O. O. Ajayi1, K. O. Ipinmoroti1 and M.O.A. Oladipo2
¹Chemistry Department, The Federal University of Technology, P. M. B. 704, Akure, Nigeria. ²Centre for Energy Research and Training, Ahmadu Bello University, Zaria, Nigeria.
Preliminary examination of the elemental contents of bitumen samples from three deposits in Odigbo Local Government Area of Ondo State, Nigeria and their respective major components (maltene and asphaltene) was undertaken using neutron activation analysis technique. Samples were obtained from tar sand outcrop, near-surface and borehole deposits in Ilubirin and Agbabu mines of the Afowo Formation in the Benin Basin of Southwestern Nigeria. 30 Elements were detected in measurable quantities in these samples with variation in the elemental distribution reflecting the chemical composition of the source. Notable among the elements were Al, Na, K, V, La, Sm, Ni and Pa to mention a few. For instance, 21 elements were detected at measureable concentration in the borehole sample compared with 18 from the tar sand and 20 from near surface bitumen sample. It is noteworthy that the highest concentration level of most elements was encountered in the tar sand sample compared with the other two sources. Maximum concentrations of Al (2624 µg/g), Ti (856.4 µg/g) and V (142.6 µg/g) were recorded for the tar sand sample. Generally, the concentrations of these elements in the samples were significantly different from each other (P£0.05). The result showed strong positive correlation among the 3 bitumen samples indicating that they are geologically and genetically related. The findings were also complemented with the x-ray diffraction of the sand residue; which was largely characterized by silica (SiO2).
KEYWORDS:bore-hole bitumen; near-surface bitumen; tar sand; asphaltene; maltene; NAA
Download this article as:| Copy the following to cite this article: Ogunsuyi H. O, Ajayi O. O, Ipinmoroti K. O, Oladipo M. O. A. Neutron Activation Analysis of Some Nigerian Bitumen Samples and their Components. Orient J Chem 2012;28(1). |
| Copy the following to cite this URL: Ogunsuyi H. O, Ajayi O. O, Ipinmoroti K. O, Oladipo M. O. A. Neutron Activation Analysis of Some Nigerian Bitumen Samples and their Components. Orient J Chem 2012;28(1). Available from: http://www.orientjchem.org/?p=23938 |
Introduction
Bitumen is a mixture of organic liquids that are viscous, black, sticky and soluble in most organic solvents. The composition of bitumen has been variously reported to consist of highly condensed polycyclic aromatic hydrocarbons (PAH), heterocyclic compounds and heavy metals such as nickel, vanadium, lead, chromium, mercury, arsenic, selenium, manganese and other toxic elements [1]. As one of the fossil minerals, it is believed to have been formed from the remains of the ancient microscopic algae and other once living organisms. These organisms on their demise were deposited in the bottoms of the prehistoric lakes and oceans where heat and pressure transformed them into petroleum or bitumen, peat or coal [1].
The coastal plain of Ondo State is rich in tar sands and bitumen. This area is dotted with bitumen deposit from Agbabu in Odigbo Local Government Areas to Ilaje Ese Odo and Okitipupa Local Government Areas by the sea – shore. The locality is within the belt of bitumen impregnated sandstone that runs east- west within the Benin Basin. The Basin runs parallel to the coastal margin of the Gulf of Guinea covering the Southwestern Nigeria and Republic of Benin, (Fig 1.0).
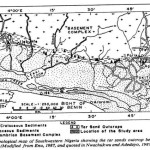 |
Figure 1 |
Hitherto, the exploitation of the mineral is localised and on a small scale. To expose this mineral to interested investors, it is pertinent to undertake a comprehensive chemical characterization that will provide necessary chemical information of interest. To acccomplish this, the characterisation of the organic components has been undertaken and reported in another paper [2]. The elemental composition with respect to the heavy metal constituents is also necessary and this requires multi-element technique that provides the much needed comprehensive data. The technique of choice is neutron activation analysis. Neutron activation is a versatile multi-element technique that provides both qualitative and quantitative information for a number of samples. Applications abound in chemical literature world wide. Notable applications include the analysis of Nigerian coal [3]. Solvent extraction of Athabasca oil sand for trace metals determination [4]. Analysis of some Nigerian iron ore samples [5], determination of the minor and trace elements in Biriniwa’s tin pyrite an galena [6], determination of impurities in Nigerian gypsum samples [7] and trace element analysis of some shaving powders commonly marketed in Nigeria using INAA [8] to mention a few. However, the chemical information of Nigerian tar sand is relatively scanty hence, the need to complement the available information through the presesnt study.
Materials and Method
Sample Collection and Preparation
Bitumen and tar sand samples were collected from three different locations; Agbabu, Mile 2 at Isaiah camp and Ilubirin all in Odigbo Local Government Area of Ondo State, Nigeria The tar sand sample was collected from IIubirin outcrop by grab method and packed inside a plastic container, while the bitumen samples: near – surface and borehole sources were drawn respectively from Mile 2 Isaiah camp and Agbabu bitumen deposits. The samples were obtained in 4 replicates and thoroughly homogenized. The tar sand was ground in a carbide ball mill to homogenize it.
Extraction of Samples
The samples were subjected to soxhlet extraction using toluene as the extractant. 80.0 g each of the sample was weighed into soxhlet thimble (Whatmann 33mm x 94mm) fitted into a round bottom flask containing 250ml of toluene. The set-up was subjected to heating in an electrical heating mantle regulated at a temperature of 1250C. The whole extraction process lasted 12h and was considered complete upon obtaining clear liquid solvent siphoning into the flask. The sand residue in the thimble was carefully recovered and transferred into a weighed plastic container and allowed to dry. The extract was initially centrifuged at 3000 rpm to remove the particulate matters. These particulate matters was washed with toluene and oven- dried at 1100C for 180mins. The centrifuged extract was vacuum evaporated using Rotary evaporator (Buchi, Rotavapor, RE, 218336) with moderate vacuum pressure and water bath regulated to 350C. The sand residue thus obtained was subjected to neutron activation analysis.
Separation of Asphaltene from the Extract
The maltene (deasphaltened) and asphaltened components of the extracted samples were obtained as follows:
Ten grams of the extract were weighed inside a 250ml conical flask and 100mls pentane was added into the flask. The mixture was thoroughly mixed with a glass rod to ensure thorough mixing and left to stand for 10mins. The asphaltene precipitated out of the saturated hydrocarbon solvent and was recovered by centrifuging the mixture for 3 minutes after which the deasphaltened oil (maltene) was decanted using a Pasteur pipette. The asphaltene was rinsed with small portion of the solvent thrice and allowed to dry; while the maltene was carefully filtered to ensure it was rid off asphaltene.
Neutron Activation Analysis
Concentration of the trace elements of the samples and their components were quantified using neutron activation analysis. The reactor used for the analysis was a Miniature Neutron Source Reactor (MNSR), installed at the Centre for Energy Research and Training (CERT), Ahmadu Bello University Zaria, Nigeria
Sample Irradiation and Radioactivity Measurement
Certified Reference Material, Coal fly ash-1633b was used as analytical quality control material to validate the procedure for elements of interest in the sample.
Unextracted sample (120-150mg), maltene (120-150mg), asphaltene (120-150mg) and sand residue (120-150mg) were irradiated along with the reference material. Two irradiation schemes were adopted based on the half-life of the product radionuclide. Samples were irradiated for 6h in any of the small inner irradiation channels to take the advantage of the maximum value of thermal neutron flux (5 x 10¹² n cm-2sec) in the inner channels. The neutron flux variability over irradiation volume was determined experimentally to be less than 2% through measured specific activities of irradiated Cu wire arranged axially and radially inside the vial. The stability of neutron flux throughout the period of irradiation, especially for long irradiation was checked by monitoring the neutron flux reading of a fission chamber connected to the microcomputer control system.
Radioactivity measurement of the induced radionuclides was performed by the PC-based gamma –ray spectrometry set–up. Identification of gamma rays of product radionuclides through their energies and quantitative analysis of their concentrations were accomplished using the gamma-ray spectrum analysis software, WINSPAN (2004).
Results and Discussion
Table 1 shows the comparison between the certified values and those of the quality control material (coal fly ash, 1633b). The results showed that concentrations of most of the elements determined agreed closely with the certified values within an accepted range of 0-16% deviations from the certified values. Concentration of elements such as Na, Fe, Sb, Sc, and Ta were found to be very close to those of the certified values with % deviation within the range of 2-5%, while elements like Al, Ti, K, Mn, La, Sm, Cr, Ni, Co, Cs, Hf, and Th are within the range of 7-16% deviation from the certified values. In most cases, the concentration of each element from the NAA analysis was close to the value indicated for the certified material, except for few elements such as Dy, Rb, Ba, Eu, and Yb that showed very high deviation from the certified values. Generally, the result showed that over 70% of the total elements detected in the reference material were obtained at measurable quantities. However, few elements like Zn, Br, Ca, and V were found to occur at concentrations below the detection limit of the instrument; while others such as Mg and Cl were not detected. Nevertheless, this technique could still be appreciably relied upon for relatively accurate reproducible and precise analysis of sample with complex matrix.
Table 1: Comparison of certified values with those of the reference material.
| Element | Certified value | Concentration from NAA analysis | Deviation % | |||||
| Al
Ca Ti V Na K Mn Dy La Sm Sc Cr Fe Co Zn
|
15.05*
1.51* 0.79 295.7 0.201* 1.95* 131.8 17) 94) 20) 41) 198.2 7.78* (50) (210) |
13.59
BDL< 0.96 0.7 BDL< 39.59 0.194 2.25 109.4 22.27 79.88 18.31 39.92 177.4 7.46 53.5 BDL<215
|
9.7
– 11.13 – 3.48 15.38 16.99 33.52 15.02 8.45 2.63 10.49 4.11 7 – |
|||||
| Rb
Sb Cs Ba Eu Br Yb Lu Ni Hf Ta Ce Th Mg Cl |
(140)
(6) (11) 709 4.1) (2.9) (7.6) (1.2) 120.6 6.8) (1.8) (190) 25.7 .482* ND |
85.72
5.82 9.94 430.1 6.8 BDL<1.76 9.6 1.11 109.8 7.59 1.89 BDL< 22.74 ND BDL |
38.77
3 9.64 39.33 65.85 – 26.32 8.33 8.96 11.6 5 – 11.52 – – |
|||||
Concentrations are in µg/g except otherwise stated. * in % w.w.
The concentrations of the elements determined in the unextracted samples of the three bitumen deposits and in their respective maltene and asphaltene components are as presented in Table 2- 4. Thirty (30) elements were determined in each of the deposits.
Table 2 shows the variation in the concentrations of these elements in the unextracted sample, asphaltene and maltene components of the borehole bitumen. The concentrations recorded for the following elements: Al, Ti, V, Na, K, Mn, La, Sm, Sc, Cr, Fe, Rb, Lu, Ni, Hf, Ce and Th in the unextracted sample were comparatively higher than their respective concentrations in asphaltene and maltene portions of the sample. However, some elements such as Ca, Dy, Zn, Sb, Ba, Eu, Ta, Mg, and Cl were found to fall below their detection limits
The mean concentrations of Fe and V (9.2% and 92.84 µg/g respectively) in the deposit were comparably higher than what were obtained by Ipinmoroti and Aiyesanmi [9] and Mokobia et al., [10]. However, the concentration of Ni (59.4 µg/g) in the unextracted sample was comparable with the value reported by Mokobia et al., [10]
The asphaltene portion of the sample showed tremendous reduction in the concentrations of its constituting elements (Table 2) compared to their corresponding values in the unextracted sample. In most cases, above 90% reduction was observed, particularly, in the following elements: V (95%), La (96%), Sm (95%), Sc (98%), Fe (95%), Th (98%), while elements like Al and Mn showed about 40-60% reduction compared with their corresponding values in the unextracted sample. Some other elements like Ca, Ti, K, Dy, Cr, Zn, Rb, Sb, Cs, Ba, Yb, Lu, Hf and Ce occurred in the asphaltene below the detection limit of the equipment. However, few elements such as Co and Br showed about 42-48% enrichment respectively compared with their corresponding values in the unextracted sample. Conversely, the concentrations of the elemental constituents of the maltene portion of the sample were relatively lower than those recorded in its asphaltene counterpart. Generally, about 77% of the total elements in the maltene portion of the sample were found to fall below the detection limit of the instrument, while 16% of the elements ( Al, Na, Br, La, Sm) showed lower concentations than their corresponding values in the asphaltene portion of the sample. However, the concentrations of V(40.26 ±0.09µg/g) and Ni (36.80 ± 0.60 µg/g) were exceptionally higher in the maltene.
Generally, Fe, K, Al, and Ti were the most abundant elements within the deposit. Next in predominance were Cr, V, Na, Ce, Lu, Rb, while others like Mn, Sm, Sc, Rb, Yb, Hf and Th were the least abundant metals. The relatively high concentration of Fe (19.2%) coupled with that of Ti (285.3 µg/g) suggested the possible occurrence of Titanium rich ore ilmenite (FeTiO3), within the deposit. This observation is consistent with the findings from the previous work conducted on Ondo State bituminous sand [9, 11]
Table 3 shows the concentration of the elements present in the unextracted sample, maltene and asphaltene of the near- surface bitumen. 60% of the total elements determined in the unextracted sample were present at measurable quantities while about 40% occurred below the detection limit of the equipment. Fe recorded the highest concentration followed by Ti, Cl, Al, V and Na. Other elements such as Mn, La, Sm, Sc, Co, Cs, Eu, Br, Yb, Lu, Hf Th were also present within the matrix in appreciable concentrations. Nonetheless, Ca, K, Dy, Zn, Rb, Sb, Ba, Ta, Ce, and Mg occurred below the detection limit of the equipment.
Over 70% of the element determined in the near- surface were below the detection limit of the equipment. However, the concentrations of vanadium and nickel were exceptionally high compared with their corresponding values in the asphaltene portion of the oil. This observation is very similar to that of borehole bitumen.
The various elements determined in the tar sand and their respective concentrations are given in Table 4. From the Table, concentrations of over 60% of the total elements determined were present in measurable quantities; these included Al, Ti, V, Na, La, Sm, Sc, Cr, Fe, Co, Sb, Br, Lu, Ni, Hf, Th and Cl. While others like Ca, Dy, Zn, Rb, Cs, Ba, Eu, Yb, Ta and Mg occurred below detection limit. Fe shows the highest concentration (25.4%) followed by Al (2625µg/g) and Ti (346.4µg/g). The high concentration of Fe and that of Ti also suggest possible occurrence of ilmenite (FeTiO3) within the tar sand.
Furthermore, the high concentrations of Al and K in the unextracted sample and the sand residue indicated presence of clay mineral in the tar sand. The relatively high concentration of Al in the tar sand may be attributed to its association with kaolinite & mica. Also, the predominance of quartz in the tar sand as identified by the X-ray diffraction (Fig. 2.0) coupled with high concentration of aluminum also suggests the presence of aluminosilicates minerals within the deposit. This observation is quite consistent with the report made on Ilubirin tar sand bitumen [11].
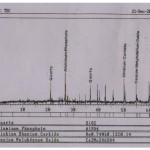 |
Figure 2.0: Diffractogram of unextracted sample of tar sand. |
Table 5 shows the comparison of the elemental composition of the three bitumen deposits examined. Borehole bitumen had the highest number of these elements at detectable levels, followed by near–surface bitumen and tar sand which indicated twenty and eighteen elements at detectable levels respectively. However, tar sand had the highest concentration values of most of these elements in relation to the other two deposits. For instance, concentration of elements like Al, Ti, V, Mn, Na, K, Br, and Fe were higher than their corresponding values in the other two bitumen deposits. This observation implies that refining of the tar sand may pose more problems at the refinery due to its relatively high concentration of these metals, which could possibly poison the catalysts use for refining. The concentrations of the elements determined in the samples are significantly different (P≤ 0.05). Ten elements (Al, K, V, Co, Sm, Ti, Ni, Na, Mn, and Fe.) were determined with reasonable precision in the three bitumen samples using correlation analysis (Table 6).
Table 2: Elemental composition of borehole bitumen
| Element Mean concentration (µg/g)
Unextracted sample Maltene Asphaltene |
||||
| Al | 722.55 ± 0.13 257.90 ±0.03 | 308 80 ± 0.03 | ||
| Ti | 285.33 ± 0.34 BDL<57.9 | BDL<46.8 | ||
| V | 92.84 ± 0.02 40.26 ±0.09 | 4.26±0.04 | ||
| Mn | 6.56 ± 0.07 BDL<0.31 | 3.37 ±0.17 | ||
| Na | 178.80 ± 0.02 135.60 ± 0.50 | 102.10 ±0.01 | ||
| K | 1893.0 ± 0.07 BDL<1183 | 134.80± 0.50 | ||
| Br | 4.74 ± 0.09 1.50 ± 0.88 | 6.92 ±0.02 | ||
| La | 20.90 ± 0.01 0.49 ± 0.15 | 0.96 ±0.01 | ||
| Sc | 7.50 ± 0.01 BDL<0.34 | 0.16 ±0.01 | ||
| Cr | 51.58 ± 0.04 BDL<7.62 | 16.22 ± 0.13 | ||
| Fe | 19230 ± 0.02 BDL< 671.95 | 780.2 ± 0.5 | ||
| Co | 3.40 ± 0.98 BDL< 2.73 | 4.81 ±0.11 | ||
| Cs | 1.44 ±0.39 BDL1.35 | BDL<0.53 | ||
| Sm | 4.59 ± 0.02 0.11 ± 0.02 | 0.24 ±0.20 | ||
| Ce | 44.12 ± 0.04 BDL< 6.89 | BDL<5.01 | ||
| Yb | 1.80 ± 0.15 BDL< 0.53 | BDL<0.57 | ||
| Lu | 24.27 ± 0.07 BDL< 0.06 | BDL<0.06 | ||
| Hf | 5.13 ± 0.05 BDL<0.81 | BDL<0.64 | ||
| Th | 5.81 ± 0.03 BDL< 0.25 | 0.40 ±.01 | ||
| Rb | 29.97 ± 0.02 BDL< 21.04 | BDL<16.25 | ||
| Ni | 59.54 ± 0.15 36.80 ± 0.60 | BDL<0.30 | ||
| Ca | BDL< 0.60* BDL<3.91 | BDL<0.36% | ||
| Dy | BDL< 2.02 BDL<2.05 | BDL<2.09 | ||
| Zn | BDL< 101.21 BDL< 50.74 | BDL<30.72 | ||
| Sb | BDL< 0.61 BDL<0.31 | BDL<0.31 | ||
| Ba | BDL< 144.2 BDL<248 | BDL<73.57 | ||
| Eu | BDL< 1.48 BDL<1.01 | BDL<0.93 | ||
| Ta | BDL< 1.41 BDL< 0.60 | BDL<0.98 | ||
| Mg | BDL< 0.34% BDL<0.24 | BDL<0.20% | ||
| Cl | BDL< 0.04% BDL <0.04 | BDL< 0.06 | ||
Table 3: Elemental composition of near- surface bitumen
| Element Mean Concentration(µg/g)
Unextracted Sample Maltene Asphaltene |
|||
| Al | 527.60 ± 0.03 | 257.90 ± 0.03 | 394.90 ±0.04 |
| Ti | BDL<57.85 | BDL< 40.15 | BDL<25.72 |
| V | 101.20 ± 0.02 | 33.39 ±0.05 | 4.26 ±0.09 |
| Mn | 7.80 ± 0.06 | BDL<3.57 | 3.37 ±0.17 |
| Na | 161.23 ± 0.09 | 161.30 ±2.50 | 410.4 ±0.02 |
| K | 3525.0 ± 0.05 | 79.90 ± 0.4 | BDL<11.83 |
| Br | 1.65 ± 0.09 | 1.29 ± 0.05 | 4.11 ±0.03 |
| La | 40.47 ± 0.06 | 0.19 ± 0.02 | 2.30 ±0.03 |
| Sc | 16.51 ± 0.06 | BDL < 0.27 | 0.79±0.01 |
| Cr | 90.74 ± 0.33 | BDL< 7.62 | 14.55 ± 0.20 |
| Fe | 33450 ± 0.12 | BDL < 780.20 | 968.78 ± 008 |
| Co | 8.62 ± 0.07 | BDL< 2.32 | 5.81 ±0.06 |
| Cs | 2.23 ± 0.98 | BDL< 1.22 | BDL<0.53 |
| Sm | 12.35 ± 0.02 | 0.20 ± 0.01 | 0.24 ±0.02 |
| Ce | 4.61 ± 0.10 | BDL< 0.93 | 2.71 ±0.10 |
| Yb | 6.51 ± 0.10 | BDL < 1.28 | 4.71± 0.08 |
| Lu | 0.58 ± 0.05 | BDL< 0.15 | 0.25 ±0.08 |
| Hf | 11.07 ± 0.05 | BDL < 7.81 | 8.50 ± 0.03 |
| Th | 9.18 ± 0.02 | BDL < 0.60 | 2.41 ± 0.01 |
| Rb | 37.73 ± 0.05 | BDL < 15.07 | BDL<18.66 |
| Ni | 69.12 ± 0.31 | 43.15 ± 0.03 | BDL< 0.30 |
| Ca | BDL< 0.59 | BDL <2.19 | BDL< 0.36 |
| Dy | BDL< 2.02 | BDL < 1.05 | BDL<2.09 |
| Zn | BDL< 144.14 | BDL < 48.19 | BDL<30.72 |
| Sb | BDL< 0.83 | BDL < 0.28 | BDL<0.31 |
| Ba | BDL< 193.84 | BDL < 232.60 | BDL<73.57 |
| Eu | 3.11 ± 0.09 | BDL < 0.91 | BDL< 0.99 |
| Ta | BDL< 1.70s | BDL < 0.54 | BDL<0.98 |
| Mg
Cl |
BDL< 0.34
BDL<448.62 |
BDL< 2.96
BDL < 245 |
BDL<0.30
BDL<282.69 |
BDL: Below Detection Limit
Table 4: Elemental composition of the tar sand
| Element Mean concentration (µg/g)
Unextracted sample Maltene Asphaltene Sand residue |
|||
| Al | 2624 ± 0.20 117.50 ±0.05 | 387 ± 0.35 | 15460 ±12.6 |
| Ti | 856.38 ± 0.23 280.56 ± 0.08 | 134.5 ±0.26 | 1324.2 ±0.96 |
| V | 142.60 ± 0.02 27.09 ± 0.28 | 4.26 ±0.09 | 28.55 ±0.03 |
| Mn | 57.75 ± 0.03 3.37 ±0.17 | 14.50 ± 0.50 | 23.08 ± 0.36 |
| Na | 321.8 ± 1.8 81.31 ± 0.15 | 455.26 ±0.66 | 73.86 ± 0.60 |
| K | 4623.4 ± 9.93 75.90 ± 0.43 | BDL<1183 | 1822.60 ±0.09 |
| Br | 7.59 ± 0.04 1.29 ± 0.08 | 8.01 ±0.01 | 1.10 ±0.03 |
| La | 3.30 ± 0.04 BDL < 0.17 | 2.97 ±0.06 | 14.05 ±0.65 |
| Sc | 1.54 ± 0.03 BDL < 0.25 | 1.38 ±0.03 | 3.80 ±0.05 |
| Cr | 14.82 ± 0.12 BDL< 6.05 | BDL<7.62 | 20.90 ±0.50 |
| Fe | 25370 ± 17.6 12808 ± 0.85 | 22139 ±10.68 | 11550 ± 0.95 |
| Co | 8.03 ± 0.01 2.31 ± 0.02 | 7.39 ±0.06 | 1.86 ± 0.03 |
| Sm | 1.10 ± 0.03 BDL< 0.02 | 0.97 ±0.01 | 2.66 ±0.03 |
| Cs | BDL< 0.83 BDL<1.19 | BDL<0.81 | BDL<0.83 |
| Ce | BDL< 7.10 BDL< 6.49 | BDL<5.01 | 27.64 ±0.06 |
| Yb | BDL< 0.83 BDL< 0.49 | BDL<0.83 | 1.02 ± 0.03 |
| Lu | 0.40 ± 0.01 BDL< 0.05 | BDL<0.04 | 0.12 ± 0.03 |
| Hf | 0.99 ± 0.05 BDL< 0.05 | BDL<0.97 | 2.15 ±0.30 |
| Th | 1.28 ± 0.09 BDL<0.58 | 1.38 ±.01 | 3.25 ± 0.05 |
| Rb | 28.64 ± 0.12 27.6 9± 0.22 | BDL<16.25 | BDL<25.42 |
| Ni | 49.42 ± 0.30 35.56 ± 0.55 | BDL<0.30 | BDL<0.60 |
| Ca | BDL< 0.33 BDL< 0.65 | BDL<0.27 | BDL< 0.36 |
| Dy | BDL< 2.39 BDL<4.65 | BDL<2.09 | BDL<12.26 |
| Zn | BDL< 59.23 BDL<26.45 | BDL<30.72 | BDL<38.30 |
| Sb | BDL< 0.51 BDL<0.42 | BDL<0.31 | BDL<0.25 |
| Ba | BDL< 116.42 BDL<110.55 | BDL<109.46 | BDL<119.75 |
| Eu | BDL< 1.20 BDL< 0.88 | BDL<1.12 | BDL<1.32 |
| Ta | BDL< 1.49 BDL<1.24 | BDL<1.27 | BDL<1.23 |
| Mg | BDL< 0. 43 BDL<0.14 | BDL<0. 16 | BDL<0.70 |
| Cl | BDL<1085 BDL<495.30 | BDL< 352.76 | BDL<1339 |
Table 5: Comparison of elemental composition of the three deposits within the study area.
|
Element Mean concentration ( µg/g) Borehole Near -surface Tar sand |
|||||
| Al | 722.55 r ± 0.13 | 527.60 q ± 0.03 | 2624j ± 0.2l | ||
| Ti | 285.33q ± 0.34 | BDL<57.85 | 856.38 h ± 9.23 | ||
| V | 92.84 o ± 0.02 | 101.20 o ± 0.02 | 142.60 f ± 0.02 | ||
| Mn | 6.56 g ± 0.07 | 7.80 f ± 0.06 | 57.75 e ± 0.03 | ||
| Na | 178.80 p ± 0.02 | 161.23 p ± 0.09 | 321.8 g ± 1.8 | ||
| K | 1893.0 s ± 0.07 | 3525.0 r ± 0.05 | 4623.4k ± 9.93 | ||
| Br | 4.74 d ± 0.09 | 1.65 b ± 0.09 | 7.59 ab ± 0.04 | ||
| La | 20.90 i ± 0.01 | 40.47 l ± 0.06 | 3.30 a ± 0.04 | ||
| Sc | 7.50 h ± 0.01 | 16.51k ± 0.06 | 1.54 a ± 0.03 | ||
| Cr | 51.58 m ± 0.04 | 90.74 n ± 0.33 | 14.82 c ± 0.12 | ||
| Fe | 19230t ± 0.02 | 33450s + ± 0.12 | 25370l ± 17.6 | ||
| Co | 3.40 c ± 0.98 | 8.62 g ± 0.07 | 8.03 ab ± 0.01 | ||
| Cs | 1.44 a ±0.39 | 2.23 c ±0.98 | 1.10 a ± 0.03 | ||
| Sm
Ce |
4.59 d ± 0.02
44.12 1± 0.04 |
12.35j ± 0.02
BDL<1.93 |
BDL<0.83
BDL < 7.10 |
||
| Yb | 1.80 b ± 0.15 | 4.61 e ± 0.10 | BDL< 0.83 | ||
| Lu | 24.27 j ± 0.07 | 0.58 a ± 0.05 | 0.40 a ± 0.01 | ||
| Hf | 5.13 e ± 0.05 | 11.07 i ± 0.05 | 0.99 j ± 0.05 | ||
| Th | 5.81 f ± 0.03 | 9.18 h ± 0.015 | 1.28 a ± 0.09 | ||
| Rb | 29.97 k ± 0.02 | 37.73 a ± 0.33 | 28.64 i± 0.12 | ||
| Ni | 59.54 n ± 0.15 | 69.12 m ± 0.31 | 49.42 d ± 0.30 | ||
| Ca | BDL< 0.60 | BDL< 0.59 | BDL< 0.33 | ||
| Dy | BDL< 2.02 | BDL< 2.02 | BDL< 2.39 | ||
| Zn | BDL< 101.21 | BDL< 144.14 | BDL< 59.23 | ||
| Sb | BDL< 0.61 | BDL< 0.83 | BDL< 0.51 | ||
| Ba | BDL< 144.2 | BDL< 193.84 | BDL< 116.42 | ||
| Eu | BDL<1.48 | 3.11 d ± 0.09 | BDL< 1.20 | ||
| Ta | BDL< 1.41 | BDL< 1.70 | BDL< 1.49 | ||
| Mg | BDL< 0.34 | BDL< 0.34 | BDL< 0. 43 | ||
| Cl | BDL< 0.04 | BDL<448.62 | BDL1085.96 | ||
Table 6. Correlation coefficients of elemental concentrations of the deposit samples
|
Bore hole/Tar sand |
Bore/near surface |
Near Surface /Tar sand |
|
| Al |
0.8703 |
1 |
0.8703 |
| K |
0.9326 |
0.9177 |
0.9991 |
| V |
1 |
1 |
1 |
| Sm |
1 |
1 |
1 |
| Ni |
1 |
1 |
1 |
| Na |
0.9995 |
1 |
0.9995 |
| Mn |
1 |
1 |
1 |
| Fe |
0.9998 |
1 |
0.9998 |
| Co |
1 |
0 |
0 |
| Ti |
0.9951 |
1 |
1 |
Conclusion
Borehole bitumen had the highest number of elements at detectable levels, followed by near –surface bitumen and tar sand which indicated twenty and eighteen elements at detectable levels respectively. However, tar sand had the highest concentrations of most of these elements compared with the other two deposits. This implies that tar sand may require intensive demetalation process during refining process in order to reduce the concentration levels of these metals that could constitute threats to catalysts.
The high concentrations of Fe and Ti both in the tar sand and borehole bitumen samples, suggests the likely occurrence of ilmenite (FeTiO3) a titanium rich ore within the two deposits. Also the high concentration of aluminum in the tar sand coupled with the presence of quartz as shown by X-ray diffractogram suggest the presence of aluminosilicate minerals within the deposit. Moreover, the presence of nickel and vanadium within the three deposits marked them potential sources of these valuable metals.
Generally, the maltene portion of the three deposits showed tremedious reduction in their elemental contents proportionate to what were detected in their respective unextracted samples. This shows that extraction of bitumen prior to refining would help reduce the concentration of those metals that can cause catalyst poison.
Furthermore, the strong positive correlation (Table 6) follow the expected geochemical relationships between the three deposits , i.e they are genetically related.
References
- Wikipedia free encyclopedia, (2007). Canada’s oil sands- opportunities and challenges. National Energy Board.
- H.O. Ogunsuyi, O.O. Ajayi and T.G. Abayomi, (2009). Chemical analysis of Agbabu bitumen exudates as potential refinery feedstock (in press). Journal of Applied Science and Technology. Acrra.
- L.O.B Ewa, Elegba, S.B, and Adetunji, J. Rare earth element patterns in Nigerian coals Journal of Radioanalytical and Nuclaer Chemistry. Letters 213(3)..
- Jacobs, F.S and Filby, R.H. (1983); Solvent extraction of oil-sand components for determination of trace elements by neutron activation analysis. Anal. Chem. 55, PP. 74.77
- L. A. Dim, O. O. Ajayi, M. O. A. Oladipo, A. S. Agbaji, D. A. Adesida and I. I. Funtua, (2003), ‘Analysis of some Nigerian iron ore samples using short-lived nuclides of neutron activation analysis (NAA)’, J. Sci. Engr. Tech. 10(1), 4690 – 4698. (Enugu).
- O. O. Ajayi, M. O. A. Oladipo, H. O. Ogunsuyi and A. O. Adebayo, (2002),Determination of the minor and trace elements in Biriniwa’s tin pyrite and ornamental lead/zinc ore using neutron activation analysis’ Bulletin of the Chemical Society of Ethiopia, 16(2), 207 – 211. (Ethiopian Chemical Society)
- O. O. Ajayi, L. Dim and M. O. A. Oladipo, (2003), Determination of impurities in Nigerian gypsum samples using neutron activation analysis. J. Sci. Engr. Tech., 10(1), 4637 – 4643. (Published in Enugu)
- Oladipo, M. O. A, Lori, J. A., Bonire, J. J. and Ajayi, O. O., (1997), ‘Trace element analysis of some shaving powders commonly marketed in Nigeria using INAA’ Journal of Radio analytical and Nuclear Chemistry, 224(1-2), 167 – 170. (Hungarian Publication)
- Ipinmoroti, K.O. and Aiyesanmi, A.F.(2001). Trace metals in the bituminous sands of Ondo State, Nigeria. Nig. J. SCi. Vol.35, pp 63-68.
- Mokobia, C.E., Adebiyi, F.M., Akpan.I. Olise, F.S. and Tchokossa, P. (2006); Radioassay of prominent Nigerian fossil fuels using gamma and TXRF spectroscopy. Fuel. Vol. 85, pp. 1811- 1814.
- Adewakun, F.O. (1998). Physico-chemical characteristics of tar sand deposits and the associated bitumen in parts of South- Western Nigeria; M.Tech thesis. Federal University Akure, pp.85- 99.
- Nwachukwu, J. I and Adedayo, A. (1987). Source –rock Potential of cretaceous shales associated with Nigerian Tar sands. NAPE Bull, Vol 87: 62 – 65.

This work is licensed under a Creative Commons Attribution 4.0 International License.
![]()
A New Edition of Web of Science
Journal Impact Factor
2022: 0.5
Five Year: 0.8
Journal is Indexed in

Cabells Whitelist
![]()


