Extraction of Copper(II) and Lead(II) using by Nano and Micron size Sorbents Poly (Dimethylsiloxane) Microchannels
Ali Moghimi1* and Mohamad Javad Poursharifi2
¹Department of Chemistry, Varamin (Pishva)Branch Islamic Azad University, Varamin (Iran).
²Department of Chemistry, Saveh Branch Islamic Azad University, Saveh (Iran).
*Corresponding Author E-mail: alimoghimi@iauvaramin.ac.ir
A novel and selective method for the fast determination of trace amounts of copper(II) and lead(II)ions in water samples has been developed. Sorbent particles consisting of nano and micro silica, and micron size octadecylsilica (ODS) were immobilized using sol–gel chemistry onto poly(dimethylsiloxane) (PDMS) microfluidic channels to serve as µ-chip solid phase extraction (SPE) devices. Extraction, preconcentration and purification of biological and chemical analytes were carried out using these. Micro and nano scale silica-immobilized µ-SPE were used for the extraction/purification of of trace copper and lead ions as their 4,4’-Dimethoxybenzil bisthiosemicarbazone (DBTS) chelates in environmental samples and lead determinations by atomic absorption spectrometry. The influences of pH of the model solutions, amounts of DBTS, eluent type and volume etc. were investigated. Also the effects of the matrix constituents of the samples were also examined. Separation of Copper and lead from real samples was achieved quantitatively. The procedure presented was checked with the analysis of standard reference materials (IAEA-336 Lichen and SRM 1515 Apple leaves). The preconcentration procedure was applied for the lead and copper contents of the natural water samples, some salts with satisfactory results (recoveries >96%, RSD <5%). LOD of the proposed method is 5ng per 1000mL.The method was applied to the extraction and recovery of copper in different water samples.
KEYWORDS:Preconcentration; Solid phase extraction; 4,4’-Dimethoxybenzil bisthiosemicarbazone (DBTS) ; Sol–gel; Poly(dimethylsiloxane) (PDMS)
Download this article as:| Copy the following to cite this article: Moghimi A, Poursharifi J. M. Extraction of Copper(II) and Lead(II) using by Nano and Micron size Sorbents Poly (Dimethylsiloxane) Microchannels. Orient J Chem 2012;28(1). |
| Copy the following to cite this URL: Moghimi A, Poursharifi J. M. Extraction of Copper(II) and Lead(II) using by Nano and Micron size Sorbents Poly (Dimethylsiloxane) Microchannels. Orient J Chem 2012;28(1). Available from: http://www.orientjchem.org/?p=23788 |
Introduction
The determination of metal ions in natural samples such as waters, soils and biological fluids is very important part of environmental and public health studies. However, the direct determination of metal ions at trace level is limited due to their low level of concentration and matrix interferences. Flame atomic absorption spectrometry (FAAS) which has been continuously used for the determination of trace metal ions suffers from insufficient sensitivity for direct determination of metal ions in environmental samples. Therefore a preconcentration or separation step is frequently necessary to improve the detection limit and sensitivity. For this purpose several separation and preconcentration procedures have been developed for trace metal ion determination involving different analytical strategies. These methods include ion exchange 1liquid extraction 2, anodic stripping voltammetry 3, cloud point 4, coprecipitation 5 and solid-phase extractions 6–10,24. Among the various methods, solid-phase extraction has received more acceptances due to its simplicity, rapidity and attainability of large preconcentration factor.
Avariety of solid materials such as modified ion exchange resins 11–13, functionalized resins with chelating reagents14, activated carbon 15, zeolites 16, cellulose 17 and immobilized microorganisms on sepiolite 18 have been used for preconcentration of trace metals. Microcrystalline naphthalene 19–21 and benzophenone 22 have also been used as solid-phase for adsorptive extraction of metal ion complexes.
In this work a simultaneous solid-phase preconcentration method for the determination of copper, iron and lead by atomic absorption is described.Although, disadvantages such as significant chemical additives, solvent losses, complex equipment, large secondary wastes, unsatisfactory enrichment factors and high time consumption, limit the application of these techniques. These problems could be addressed by the development of modular and compact processes that provide adequate separation and preconcentration without complex processes. The solvent microextraction technique effectively overcomes these difficulties by reducing the amount of organic solvent as well as allowing sample extraction and preconcentration to be done in a single step. The technique is faster and simpler than conventional methods. It is also inexpensive, sensitive and effective for the removal of interfering matrices. Solvent microextraction is a form of solvent extraction with phase ratio values higher than 100. Compared with the conventional solvent extraction, microextraction may provide poorer analyte recovery, instead the concentration in the organic phase greatly enhances. In addition, the amount of the used organic solvent is highly reduced and only one step of manipulation is necessary, therefore, problems of contamination and loss of analytes vanishes.
Cloud point extraction (CPE)26–31, homogeneous liquid–liquid extraction (HLLE)32,33 and single drop microextraction (SDME)34–38 are fairly new methods of sample preparation which are used in separation and preconcentration of metals and can solve some of the problems encountered with the conventional pretreatment techniques.
In the previous researches, we demonstrated a novel microextraction technique, named dispersive liquid–liquid microextraction (DLLME), which was successfully used, for the extraction and determination of polycyclic aromatic hydrocarbons (PAHs), organphosphorus pesticides (OPPs) and chlorobenzenes in water samples39–41. DLLME is a modi- fied solvent extraction method and its acceptor-to-donor phase ratio is greatly reduced comparing with the other methods. In DLLME, the appropriate mixture of the extraction and disperser solvents is rapidly injected by syringe into aqueous samples containing analytes. Thereby, cloudy solution forms. In fact, the cloudy state results from the formation of fine droplets of the extraction solvent, which disperse in the sample solution. Then, this cloudy solution shall be centrifuged and the fine droplets sediment at the bottom of the conical test tube. The determination of anlaytes in sedimented phase can be performed by instrumental analysis. In this extraction method any component in the solution, directly or indirectly after previous (or simultaneous) derivatization reaction, interacts with the fine droplets of the extraction solvent and consequently gets extracted from the initial solution and concentrates in the small volume of the sedimented phase. Simplicity of the operation, rapidity, low sample volume, low cost, high recovery and high enrichment factor are some advantages of DLLME.
DLLME is a miniaturized sample pre-treatment technique. On the other hand, graphite furnace atomic absorption spectrometry (GF AAS) is a microamount sample analysis technique. Therefore, it makes it perfect when a combination of both DLLME and GF AAS is used. The applicability of the approach has been demonstrated for the determination of copper in water samples. This element was selected for evaluation of the procedure because copper is one of the principal heavy metals of analytical interest due to its extreme toxicity even at relatively low concentrations42,43.
In our knowledge, SPE and preconcentration by Cu(II)-imprinted diazoaminobenzene–vinylpyridine copolymer packed-bed columns have not been employed for the separation and preconcentration of Cu(II) from aqueous solution. This paper reports the synthesis of Cu(II) imprinted and non-imprinted copolymers by copolymerizing copper chloride (or without it), diazoaminobenzene (DAAB) and vinylpyridine (VP) using ethyleneglycol dimethacrylate (EGDMA) as cross-linker in presence of 2,2′- azobisisobutryonitrile as initiator and its analytical applications for column preconcentrative separation of Cu(II) from natural water.
The objective of this research was to fabricate PDMS based microfluidic SPE channels, with the sorbent particles immobilized by sol–gel also This paper describes a preconcentration/separation procedure based on solid phase extraction of lead and Copper in some natural water samples and some salts. The analytical parameters relevant quantitative retentions of lead and copper on poly(dimethylsiloxane) (PDMS) as DBTS chelates were investigated.
Experimental
Apparatus
A Varian SpectrAA model 200 atomic absorption spectrometer with deuterium background corrector was used in this study. A 10 cm long slot-burner head, a lamp and an airacetylene flame were used. The operating conditions given in Table 1, adjusted in the spectrometer were carried out according to the standard guidelines of the manufacturers. The atomic absorption signal was measured as a peak height mode against an analytical curve. A pH meter, Metrohm model 691 digital pH meter was employed for measuring pH values in the aqueous phase.
Table 1
Conditions for flame atomic absorption spectrometric determinations
|
Flow rate of oxidant and fuel |
Lamp current (mA) |
Slit (nm) |
Wavelength (nm) |
Element |
|
Air (L/min) Acetylene(L/min) |
||||
|
2.0 17.0 |
30 |
0.7 |
283.3 |
Pb |
|
2.0 17.0 |
4 |
0.7 |
253.3 |
Cu |
The SEM images of the sorbent bed were obtained using a Leo 1530 VP (Carl Zeiss SMT AG Company, Oberkochen, Germany). Prior to SEM imaging the PDMS cross sections containing the immobilized particles were sputter coated with about 2 nm carbon film using a BALTEC MED 020 HR sputtering coater from Techno trade International Inc. Typhoon TM settings consisted of 488 nm excitation, with a 520BP 40 nm emission filter, high sensitivity mode detection at a PMT voltage of 520V.
Analytical reagent-grade chemicals from Merck, Darmstadt were employed for the preparation of all solutions and 4,4’-Dimethoxybenzil bisthiosemicarbazone (DBTS). All aqueous solutions were prepared from distilled water (Milli- Q Millipore 18.2MΩcm−1 resistivity). All the plastic and glassware were cleaned by soaking in dilute HNO3 (1+9) and were rinsed with distilled water prior to use. Stock metal ion solutions, 1000 mg/L (Merck, Darmstadt) were diluted daily for obtaining reference and working solutions. Stock solutions of diverse elements supplied by Sigma Chem. Co., St. Louis, were prepared from high purity compounds.
The calibration curves for analyte ions were established using the standard solutions prepared in 1M HNO3 by dilution from stock solutions. The calibration standards were not submitted to the preconcentration procedure. The range of the calibration standards for Copper and lead on flame atomic absorption spectrometric determinations were 0.02–2.0, and 1.0–10.0 mg/L, respectively. The correlation coefficient of the calibration curves were generally 0.998.
The poly(dimethylsiloxane) (PDMS) prepolymer, Sylgard 184 was obtained from Dow Corning (Midland, MI). Silica particles, microsorb, 3µm were purchased from Varian Instruments (Walnut creek, CA), 5 µm ODS particles were stripped open from a HPLC column, hypersil, from Agilent (Palo Alto, CA). Tetraethylorthosilica (TEOS), propyltrimethoxysilane (PTMS), ethyltrimethoxysilane (MTMS), trifluoroacetic acid (TFA), fumed silica, 12 nm size.
The ligand; 4,4’-Dimethoxybenzil bisthiosemicarbazone (DBTS)was dissolved in a water/ethanol (75/25, v/v) mixture. Ammonium acetate buffer solutions (0.1 M) were prepared by adding an appropriate amount of acetic acid (Merck, Darmstadt) to ammonium acetate (Merck, Darmstadt) solutions for pH 3–6 and ammonium chloride buffer solutions (0.1 M) were prepared by adding an appropriate amount of ammonia (Merck, Darmstadt) to ammonium chloride solutions for pH 8–10.
poly(dimethylsiloxane) (PDMS) was washed successively with methanol, water, 1M HNO3 in acetone, water, 1M NaOH and water, sequentially, in order to eliminate trace metal ions and other inorganic and organic contaminants in the prepolymer.
The glass column, having a stopcock and a porous disk, was 10 cmlong, and 1.0 cm in diameter. The column contains about 600 mgresin (ca 2.0 cm bed). The column was prepared by aspirating water slurry of poly(dimethylsiloxane) (PDMS) into the glass column. It was conditioned with 10–15mL of pH 9 buffer.
Fabrication of PDMS channels
Microchips were fabricated from PDMS via soft lithography. This method has been reported in the literature by Duffy et al.56The polymer was also cast against steel capillary in a circular flat-bottomed polystyrene petri dish to form microchannels. They were later cured at 70 ◦C for 1 h and then peeled off the master (or the steel capillary). Typical microchannels were around 2 cm long, 425 µm wide and about 350µm deep. The sorbent bed ran across the whole length of the channel enclosing about 10 mg of the sorbent material. A flat PDMS strip was used to enclose the channel. This was obtained by casting the polymer mixture on the flat surface of a petri dish. The prepolymer and the crosslinking mixture were used as glue for sealing the PDMS channel to the flat strip. Though this is not a common practice of sealing the channels, this method was used since the channels were wide enough and would not be clogged when the prepolymer and crosslinking mixture would cure. The sealed device was placed in an oven at 65 ◦C for 1 h in order to obtain a tight seal.
Immobilization procedures
Immobilization of micro particles
The PDMS microchannels were tightly packed with either 3µm microsorb silica particles or 5 µm octadecylsilica (ODS) particles. The sorbent particles were packed through one end of the channel with the other end closed. Tight packing of the particles was ensured using a vibrator to provide gentle tapping. After this, the ends of the channel was sealed using the PDMS prepolymer and the crosslinking mixture. The sol solutions were prepared by mixing 1ml of propyltrimethoxysilane (PTMS), 1ml of ethyl trimethoxy silane (MTMS), 1.5 ml of99%trifluoroacetic acid (TFA) and 100 µL of water in a vial. The mixture was thoroughly vortexed for 5 min and any resulting precipitate was filtered off. It was then injected into the packed channel with the other end pierced by a needle to allow the venting of the trapped air. Once the sorbent particles were covered with the sol solution, the devices were cured at room temperature for 12 h to facilitate gelling, and then placed in an oven at 110 ◦C for another 24 h to remove residual solvents and to promote further gelling. The polymerization of sol–gel formed an immobilized, continuous sorbent bed where the particles were bonded to one another and to the PDMS surface without any voids and cracks.
Immobilization of nano scale silica particles
The sol–gel precursor solutions were prepared by mixing 1.5 ml of tetraethylorthosilicate (TEOS), 0.3 ml of TFA, 0.1 ml methanol, and 0.1 ml of water. About 100 mg of fumed silica (nano silica particles) was added to this sol solution. The mixture was sonicated for about 30 min forming a viscous colloidal solution of the silica particles in the sol–gel precursor media. This solution was injected into the PDMS channels. The channels were then heated on a hot plate at about 80 ◦C for about 20 min causing the solution to gel. The colloidal sol solution was injected repeatedly into the channels and later heated until a dense and tight bed was obtained. The devices were subjected to the curing procedure mentioned above. A 25 guage syringe needle was pierced into the sorbent bed to serve as the sample injection inlet, and a 250 µm, o.d. 1 cm long steel capillary served as the outlet. The inlet and the outlet were then sealed using the PDMS prepolymer/ crosslinking mixture to prevent leakage.
Preconcentration procedure
The column method was tested with model solutions. Model solutions (containing 5 µg of Copper and 20 µg of lead in 40–60 mL) were adjusted to the desired pH. Then 4,4’-Dimethoxybenzil bisthiosemicarbazone (DBTS)was added to form the metal–DBTSchelates. After 5–10 min, the solutionwas loaded into the column. The flow of sample solution through the column was gravitationally performed. After passage of the solution finished, the column was washed with a chelating agent solution adjusted to the working pH. The metals were recovered with the aid of 8–10mL of 1M HNO3 in acetone at 5.0 mL/min of flow rate. The eluent was evaporated over a hot plate to near dryness at 35 ◦C in a hood and was diluted to 2mL or 5mL with 1M HNO3. The metal concentrations in the final solution were determined by AAS.
Procedure for standard reference materials
Lichen (IAEA-336) and apple leaves (SRM 1515) standard reference materials (100 mg) were digested with 6mL of HNO3 (65%), 2mL of H2O2 (30%) in microwave digestion system for 31 min and diluted to 50mL with deionized water. A blank digest was carried out in the same way. Final volume was 2 mL. Then the preconcentration procedure given above was applied to the final solutions.
Analysis of real samples
Analysis of the water samples
To assess the applicability of the method to real samples, it was applied to the extraction and determination of copper from different water samples. Tap water(Tehran, taken after 10 min operation of the tap) and Sea water(taken from Caspian sea, near the Mahmoud-Abad shore) samples were analyzed(Table 3). As can be seen from Table 3 the added Copper and lead ions can be quantitatively recovered from the water samples used.
The water samples analyzed were filtered through a cellulose membrane filter (Millipore) of 0.45 µm pore size. The pH of the samples was adjusted to 9. Then DBTS solution was added. The sample was passed through the column. The DBTS chelates adsorbed on column were eluted with 1M HNO3 in acetone. The effluent was evaporated to near dryness and made up to 2.0mL with 1M HNO3. The levels of the investigated analyte ions in the samples were determined by AAS.
Determination of Copper and lead ions in salt samples
For the determination of analyte ions in alkaline salt samples, 3.0 g of each salt sample was dissolved in 3mL of distilled water and diluted to 100.0mL with distilled water. The procedure given above was applied to these solutions. The analyte ions in the final solution were determined by atomic absorption spectrometry.
Results and discussions
Fabrication of sol–gel immobilized bed
Several immobilization procedures were attempted to fabricate the SPE bed in the PDMS microchannels prior to the successful procedure. A continuous silica network was attempted without the use of sorbent particles. An amount of 30% (v/v) TEOS in water catalyzed by 0.1% (v/v) HNO3 was heated to 80 ◦C with continuous stirring and the hydrolyzed sol solution was injected by a microsyringe into the PDMS microchannel. After curing at 120 ◦C for 12 h, it was found to form a cracked, non-uniform bed. The above procedure was modified by adding 5 µm silica particles to the sol solution before its condensation. This
sol–gel/silica slurry was then filled into the microchannel using positive pressure and cured. This did not form a stable SPE bed either. Later, the already packed bed of the sorbent particles was subjected to immobilization using hydrolyzed TEOS. This procedure has been successfully used on a glass µ-chip55. However, this procedure also failed since it resulted in a loose bed. This could have been due to a combination of reasons, such as, poor adhesion to PDMS, higher hydrophobicity of PDMS relative to glass and high porosity of the resulting bed.
A successful immobilization procedure with 5 µm silica particles was developed using PTMS and MTMS as the sol–gel precursors in the presence of TFA as the catalyst, which promoted hydrolysis in presence of small amounts of water. TFA also helped in modifying the PDMS surface by hydrolyzing the surface siloxane bonds to silanol thus making the surface more hydrophilic and resulted in the formation of silanol groups.
The immobilized bed was uniform, stable, and had adequate porosity for fluid flow. When PTMS alone was used as a sol–gel precursor, the bed was impervious to any flow due to its high density. When MTMS or TEOS was used, the bed had relatively higher wettability and higher porosity, because of which it had low mechanical strength and occasionally crumbled during SPE. The mixture of MTMS and PTMS produced a bed with appropriate robustness, stability
and hydrophilicity to carry out elution.
The presence of alkyl groups in the sol–gel precursors (e.g. PTMS and MTMS) reduces the connectivity degree and therefore materials made with such precursors are expected to have higher porosity when compared to the pure silica (TEOS) matrix. However, it has been reported that the pore size and pore volume of the alkyl based precursors is less than their pure silica counterparts 57–59. Reducing the network connectivity increases the compliance of the gel and allows a better densification during drying. The alkyl groups also make the pore surfaces hydrophobic. An increasing stiffness during densification and the lower capillary tension due to the hydrophobic effect are responsible for the residual porosity after drying. The tendency of the alkyl groups to arrange themselves on the surface of the pores or inside the pores could also lead to the blockage/unavailability of the pore sites to the aqueous eluent. Also it’s a well known fact that the sol–gel obtained from pure silica based precursors due to its lower density allows higher shrinkage of the gels 62 during drying, which would be possible only due to its inherent higher porosity. This is corroborated from literature57–62.
An important factor for the formation of robust and stable SPE bed is hydrophobicity. The presence of alkyl groups in the organically modified precursors result in an increase in the hydrophobicity,61 or a decrease in the wettability of the SPE bed with an aqueous eluent. For a successful elution, in addition to the right porosity, an optimum hydrophilicity/ wettability is also required for µ-SPE bed. If too hydrophilic, the bed has low mechanical strength, and if too hydrophobic, due to increased density, the aqueous eluent does not flow through easily.
The sol–gel precursors undergo hydrolysis in the presence of TFA as a catalyst, where the alkoxy groups were converted into hydroxyl groups. As the reactions proceeded to form a macromolecular network, the hydrolysis products underwent further polycondensation in one of the several ways: (i) between hydrolyzed products of the same original precursor, (ii) between hydrolyzed products of two different precursors or (iii) between the hydrolyzed products of either precursor with the silanol groups on the PDMS surface. A schematic of the complete sol–gel reaction is shown in Fig. 1.
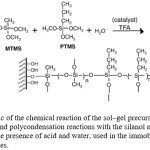 |
Figure 1: Schematic of the chemical reaction of the sol–gel precursors involving hydrolysis and polycondensation reactions with the silanol moieties on PDMS surface in the presence of acid and water, used in the immobilization of micro silica particles. |
The resulting three-dimensional polymeric sol–gel network is chemically bonded to the silanol moieties residing on the PDMS surface. This procedure was used to immobilize ODS (5 µm) and silica (3 µm) particles in the PDMS channels of different dimensions. The sol–gel matrix acted
like a glue, bonding the sorbent particles to each other and to the walls of the channel, however, it may also have the effect of clogging the pores of the porous sorbent particles and may result in decreased surface area, though this was not verified experimentally. This formed a continuous bed as shown in Fig. 2a and b. The SEM images show a small section of the packed channel with the circular, immobilized sorbent particles. A cross section of the packed channel is shown in
Fig. 2c. It was observed that the aqueous acid catalysts (e.g. HCl) or the presence of relatively larger amounts of water during the sol–gel reaction tended to increase the swelling during the drying process. This resulted in the formation of a fragile, unstable bed. This was because the water remained trapped despite the drying/curing. When an organic acid like TFA was used, this problem was not encountered and the mechanical strength of the sol–gel channel improved, and minimized the cracks in the bed.
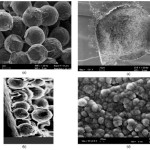 |
Figure 2: SEM images of the (a) sol–gel entrapped micro-silica particles, (b) sol–gel immobilized C-18 particles bound to the channel wall, (c) cross section of the µ-SPE channel containing sol–gel immobilized micro-silica particles, (d) sol–gel immobilized nano-size silica particles |
The silica filled channels were injected twice with the sol solution in order to obtain a uniform bed. The channels were dried for 12 h before making the second injection. Therefore, the SEM images reveal a relatively higher amount of sol–gel matrix in the interstitial spaces between the particles.
Influences of pH of aqueous solutions on the retentions of Copper and lead ions on poly(dimethylsiloxane) (PDMS)
The effects of the pH of the aqueous solution on the recoveries of the DBTS complexes of lead and Copper were investigated in the pH range of 3–10 by using buffered model solutions containing 5 µg of Copper (II) and 20 µg of lead(II).
The results are depicted in Fig. 3. The recovery values for lead and Copper ions were not quantitative at the pH values below 7. The recoveries increase with increasing pH and reach quantitative values at the pH range of 6-7 for both ions. All further studies were performed at pH 6 with acetic acid to ammonium buffer.
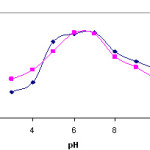 |
Figure 3: Recoveries of copper(II) and lead as a function of pH (eluent: 1MHNO3 in acetone, amount of resin: 600 mg, N= 3). |
Ligand amounts
Prior to adsorption of traces heavy metal ions on a solid phase for preconcentration, generally metal ions were converted to a suitable form including metal chelates or metal inorganic complexes. Because of this point, 4,4’-Dimethoxybenzil bisthiosemicarbazone (DBTS) was selected as chelating agent for lead and Copper ions. Different volumes of 1×10⁻²M of DBTS solutions were added to model solutions containing 5 µg of
Copper (II) and 20 µg of lead(II). Then this solution passed through poly(dimethylsiloxane) (PDMS) polymer column. Quantitative recoveries were obtained for lead and Copper ions in the 2.0–4.0mL of 1×10⁻²MDBTS solution. Because of insufficient ligand amounts in the solutions, the recoveries of analytes were not quantitative when less than 2.0mL DBTS solution was used. After 4.0mL of DBTS solution, the recoveries were below 95%, due to competition on the adsorption between DBTS–metal chelates and excess DBTS in the solution. In all further work, 3.0mL of 1×10⁻²M DBTS solution was added to the solutions.
Eluent type and eluent volume
Various elution solutions at 5 mL/min flow rate were examined to obtain quantitative recovery values for lead–DBTS and Copper–DBTS chelates from poly(dimethylsiloxane) (PDMS) column.
The recoveries of analytes were quantitative only with 1M HNO3 in acetone. The recoveries were not quantitative when 1 and 2M HNO3, 1 and 2M HCl and 1M HCl in acetone were used as eluent. 1M HNO3 in acetone was used as the eluent all further work for quantitative recovery of metal ions from poly(dimethylsiloxane) (PDMS).
The volume of eluent (1M HNO3 in acetone) that can completely strip the retained analytes from the solid phase is an important parameter for obtaining the maximum preconcentration factor. Thus some experiments were carried out in order to choose a proper eluent volume for the retained analyte ions on poly(dimethylsiloxane) (PDMS). The recovery values for lead and copper(II) ions from the poly(dimethylsiloxane) (PDMS) column were greater than 95%, in the eluent volume range of 5.0–10.0 mL. In the eluent volume lower than 5.0 mL, because of insufficient eluent volume, the recoveries of the analyte ions were not quantitative.
Effect of sample volume
The solid phase extraction technique is a common procedure for extraction and separation of metal ions from large sample volumes to obtain high preconcentration factor in the solid phase extraction studies. The recovery values as a function of sample volume were shown in Fig. 4. It was found that the recoveries were constant when up to 500mL of the sample solution was used. At the higher volumes the recoveries for analytes decreased. Therefore a preconcentration factor of 250 can be achieved when using 500mL of the sample and 2.0mL of final volume.
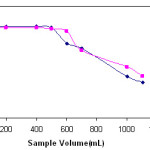 |
Figure 4: Effects of sample volume on the recoveries of lead and copper(II) ions on poly(dimethylsiloxane) (PDMS) (N= 3). |
Amount of poly(dimethylsiloxane) (PDMS)
Due to the amounts of solid phase extractor is the one of the important factor for the quantitative retention of heavy metals at traces levels in the preconcentration studies based on solid phase extraction, the influences of the amount of poly(dimethylsiloxane) (PDMS) on the retention of copper(II) and lead ions were examined by using the model solution containing analytes. The results are depicted in Fig. 5. copper(II) and lead ions were quantitatively retained in the range of 500–700 mg of poly(dimethylsiloxane) (PDMS) resin. The short glass column was filled with 600 mg of poly(dimethylsiloxane) (PDMS) for all further studies.
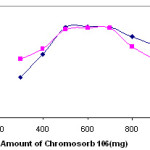 |
Figure 5: Influences of amount of poly(dimethylsiloxane) (PDMS) on the retentions of copper(II) and lead ions (N= 3). |
Influences of flow rates of sample and eluent solutions on the recoveries
The influences of the flow rates of sample and eluent solutions on the recoveries of copper(II) and lead ions were investigated in the range of 1–10 mL/min. In the examination of the effects of sample and eluent solutions, 1M HNO3 in acetone was used as eluent. The quantitative recovery values were obtained in the flow rate range of 1–8 mL/min for sample and eluent solution. After 8 mL/min of eluent solution, the recovery values of copper(II) and lead ions were below 95%. Five milliliter per minute was selected as the flow rate for the all experiments for both flow rates of sample and eluent solutions.
Matrix effects
Because of the determination of the levels of traces metal ions of the highly saline samples were the goal, the influences of possible matrix ions in the environmental samples and some transition metals were also examined. The effect of potential interfering ions on the determination of lead and 4,4’-Dimethoxybenzil bisthiosemicarbazone (DBTS) were investigated by adding known concentrations of each ion in a solution containing analytes and then determining
the latter. The results were summarized in Table 2. The tolerated amounts of each ion were the concentration values tested that caused less than 5% the absorbance alteration.
Table 2
Effect of the matrix ions on the recovery of metal ions (sample volume: 100 mL, N=3)
|
Cu
|
Pb |
Concentration (mg/L) |
Added as |
Ion |
|
98±2 98±2 |
97±5 97±2 |
12,000 30,000 |
NaCl |
Na+ |
|
97±2 96±3 |
95±3 96±2 |
10,000 20,000 |
KCl |
K+ |
|
98±2 97±3 |
98±3 98±2 |
10,000 15,000 |
CaCl2 |
Ca2+ |
|
99±2 97±2 |
98±2 97±3 |
6000 10,000 |
MgCl2 |
Mg2+ |
|
98±2 98±3 |
97±2 97±3 |
10,000 30,000 |
NaCl |
Cl− |
|
96±2 95±3 |
95±2 94±2 |
5000 10,000 |
Na2SO4 |
SO42− |
|
97±2 96±4 |
96±4 95±4 |
1000 2000 |
Na3PO4 |
PO43− |
|
96±2 95±2 |
98±2 96±3 |
1000 3000 |
NaF |
F− |
|
98±3 98±2 |
98±2 97±4 |
5000 10,000 |
KNO3 |
NO3− |
|
96±2 95±3 |
95±2 95±3 |
25 50 |
FeCl3 |
Fe3+ |
|
95±3 94±2 |
97±3 97±3 |
25 50 |
Al2(SO4)3 |
Al3+ |
|
98±2 97±3 |
96±3 94±6 |
25 50 |
MnSO4 |
Mn2+ |
|
97±2 96±2 |
98±2 97±2 |
25 50 |
ZnSO4 |
Zn2+ |
|
98±1 97±3 |
98±2 97±1 |
25 50 |
Cd( NO3)2 |
Cd2+ |
|
96±3 95±4 |
98±2 97±3 |
25 50 |
Cr(NO3)3 |
Cr3+ |
|
98±2 97±3 |
98±2 98±3 |
25 50 |
CoSO4 |
Co2+ |
|
97±4 97±2 |
97±2 96±2 |
25 50 |
NiSO4 |
Ni2+ |
The ions normally present in water do not interfere under the experimental conditions used. Also, some of the transition metals at mg/L levels did not interfere with the recoveries of the analyte ions. This results show that the proposed preconcentration/ separation method could be applied to the highly saline samples and the samples that contains some transition metals including Ni2+, Co2+, Cr3+, Zn2+, Cu2+, Fe3+, Al3+ and Mn2+ at mg/L levels.
Figure of merits
The accuracy of the results was verified by analyzing the concentration after addition of known amounts of copper(II) and lead into seawater, tap water, unrefined table salt and a
refined salt sample. The results were given in Table 3. For all four samples, good agreements were obtained between the recoveries of analyte for spiked and control samples using the experimental procedure for analytes. The recoveries calculated for the additions were quantitative, thus confirming the accuracy of the present procedure and the absence of matrix effects.
The analytical performance of the procedure can be calculated for the results from FAAS measurements. The reproducibility of the preconcentration and separation method was evaluated by passing 50mL of solution containing analyte ions through the column and repeating this procedure ten times. The relative standard deviations (R.S.D.) were below 6%. The detection limits of the investigated elements based on three times the standard deviations of the blank (k=3, N= 20) on a sample volume 500mL for copper(II) and lead were 0.23 and 0.39µg/L, respectively.
Table 3: Analysis of various samples spiked analyte ions (sample volume: 100 mL, final volume: 10 mL, N =4)
|
Analyte |
Added (µg) |
Tap water |
Sea water |
Unrefined table salt (3% (w/V)) |
Refined table salt (3% (w/V)) |
||||
|
Found (µg), |
Recovery |
Found (µg), |
Recovery |
Found (µg), Recovery |
Found (µg) Recovery |
||||
|
x ± S.D.a |
(%) |
x ± S.D.a |
(%) |
x ± S.D.a (%) |
x ± S.D.a (%) |
||||
|
Pb |
0 |
N.D. |
– |
N.D. |
– |
N.D. |
– |
N.D. |
– |
|
10 |
9.8± 0.9 |
98± 3 |
9.8 ± 0.2 |
99 ± 2 |
9.7 ± 0.6 |
97 ± 2 |
9.8 ± 0.5 |
98 ± 3 |
|
|
20 |
19.8 ± 0.8 |
99 ± 2 |
19.8± 0.4 |
97 ±3 |
19.5 ± 0.5 |
98± 2 |
19.7 ± 0.9 |
98 ± 2 |
|
|
40 |
39.8± 0.4 |
98 ±2 |
39.6 ± 0.7 |
99 ± 2 |
39.2 ± 0.7 |
97 ± 3 |
39.5 ± 0.5 |
99 ± 3 |
|
|
Cu |
0 |
N.D. |
– |
N.D. |
– |
N.D. |
– |
N.D. |
– |
|
2.5 |
2.4± 0.8 |
98±2 |
2.4 ± 0.6 |
95 ± 1 |
2.4 ± 0.5 |
95 ± 2 |
2.4 ± 0.8 |
97 ± 3 |
|
|
5 |
4.9± 0.6 |
97± 3 |
4.9 ± 0.5 |
97 ± 2 |
4.8 ± 0.3 |
96 ± 3 |
4.9 ± 0.5 |
99 ± 2 |
|
|
10 |
9.9 ±0.8 |
97±3 |
9.8 ± 0.6 |
98 ± 2 |
9.7 ± 0.6 |
96± 2 |
9.6 ± 0.6 |
96 ± 4 |
|
Adsorption isotherms and adsorption capacity
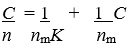
The adsorption behavior of poly(dimethylsiloxane) (PDMS) was determined by studying the amount of adsorbed copper(II) and lead as a function of copper(II) and lead concentrations; 50mL of solutions containing copper(II) and lead at concentrations in the range 0.35–385 and 0.24–350 mg/L, respectively, were maintained under the optimum conditions determined before. The analytes in the eluents was determined by FAAS and the adsorption capacities of resin for copper(II) and lead were calculated from Langmuir plots. The concentration of adsorbed copper(II) and lead(II) in mg/g (n) on to poly(dimethylsiloxane) (PDMS) as a function of its concentration in solution in mg/L (C) was investigated. The adsorption isotherms for copper(II) and lead were shown in Fig. 6. The maximum adsorption capacity were obtained by using a model Langmuir adsorption isotherm40,41, based on following equation:
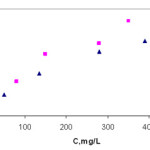 |
Figure 6: Langmuir isotherm adsorption plots of lead(II) and copper(II) ions on poly(dimethylsiloxane) (PDMS). |
The maximum adsorption capacities (nm) of poly(dimethylsiloxane) (PDMS) for copper(II) and lead were found to be 2.70 and 4.56 mg/g, respectively. The binding constants (K) were 0.211 l/mg for copper(II) and 0.12 l/mg for lead.
copper(II) and lead contents of SRM samples
The method presented was checked to two different reference materials (IAEA-336 Lichen and SRM 1515 Apple leaves) for the determination of copper(II) and lead(II)
ions. The certified and observed values for IAEA-336 Lichen and SRM 1515 Apple leaves were given in Table 4. The results found were in good agreement with the certified
values of SRMs. If the concentration levels of the most common matrix constituents of reference standard materials analyzed and the accuracy of the presented method are considered together, it can be concluded that the proposed method is free from interferences of the various constituents.
Table 4: The levels of lead(II) and copper(II) as µg/g in reference standard materials (final volume: 2 mL, N=4)
|
Element |
SRM (IAEA-336 Lichen) |
SRM 1515 Apple leaves |
||
|
Certified Observed |
Certified Observed |
|||
|
value value |
Value value |
|||
|
Pb |
5.0 |
4.8 ± 0.4 |
0.49 |
0.54 ± 0.05 |
|
Cu |
0.114 |
0.118 ± 0.13 |
(0.012)a |
0.015 ± 0.04 |
Application to real samples
The DBTS/ poly(dimethylsiloxane) (PDMS) solid phase extraction procedure for lead and copper(II) ions was applied to various environmental samples. The results for natural water and some salt samples were given in Tables 5 and 6 ,respectively.
Table 5: Concentration of analyte ions in naturalwater samples as µg/L (N= 4, sample volume: 500 mL, final volume: 2 mL)
|
Pb |
Cu |
|
|
Tap water from Tehran |
4.3 ± 1.7 |
1.9 ± 1.5 |
|
Sea water from Caspian sea |
2.2 ± 0.9 |
1.7 ± 1.2 |
Table 6: Application of presented method for the levels of copper and lead in some salt samples (final volume: 2 mL, N=4)
|
Refined table salt 1.7 ± 0.3 0.15 ± 0.12 Unrefined table salt 2.8 ± 0.4 0.24 ± 0.13 Ammonium chloride (technical grade) 7.7± 0.5 0.41 ± 0.08 Sodium chloride (technical grade) 7.7 ± 0.6 0.39 ± 0.08 |
||
|
Mean expressed as 95% tolerance limit. |
||
Comparison with other preconcentration studies used 4,4’-Dimethoxybenzil bisthiosemicarbazone (DBTS)
4,4’-Dimethoxybenzil bisthiosemicarbazone (DBTS)is a reagent for the spectrophotometric determination of lots of transition metal ions40,41. DBTS acts as a terdendate ligand complexing with metals through the hydroxyl oxygen atom, pyridine nitrogen atom and one of the azo group nitrogen atoms. DBTS has been also used for the separation and preconcentration of traces heavy metals as chelating agent from various media. Comparative data from some recent papers on preconcentration studies used 4,4’-Dimethoxybenzil bisthiosemicarbazone (DBTS) for traces metal ions for the figure of the merits are summarized in Table 7. The poly(dimethylsiloxane) (PDMS) /DBTSmethod presented in this study is most promising for the analyte ions as the preconcentration factor is 250. The preconcentration factor achieved with presented procedure is superior to solid phase extraction method given in Table 7 and some preconcentration/separation procedures including cloud point extraction, solid phase extraction, electroanalytical techniques42–53. The detection limits of investigated elements are superior to those of some preconcentration/ separation techniques for analyses42–54. The matrix effects with the method were reasonably tolerable.
Table 7: Comparative data from recent papers on 4,4’-Dimethoxybenzil bisthiosemicarbazone (DBTS) used chelating agent on preconcentration studies
|
Analytes |
Method and instrumental detection |
PF |
Detection |
limit |
R.S.D. (%) |
References |
|
(µg/L) |
||||||
|
In(III) |
SPE on naphthalene/DDP |
25–50 |
200 |
0.96 |
[44] |
|
|
Co(II) |
SPE on surfactant-coated alumina/AAS |
100 |
– |
1.4–4.0 |
[45] |
|
|
Ir(III) |
SPE on naphthalene/spectrophotomety |
40 |
20 |
1.1 |
[46] |
|
|
Ni(II) |
SPE on surfactant-coated alumina/AAS |
300 |
40 |
2.4 |
[47] |
|
|
Cu(II) |
SPE on naphthalene/DDP |
40 |
70 |
0.98 |
[48] |
|
|
Co |
CPE/AAS |
115 |
0.38 |
<10 |
[49] |
|
|
Cu(II), Cd(II), Pb(II) |
SPE on Amberlite XAD-2/AAS |
50 |
0.8–23.2 |
<5 |
[50] |
|
|
Ni(II) |
SPE on aminocarboxylic amphoteric resin/DRS |
– |
50 |
<5 |
[51] |
|
|
Cu(II) |
SPE on surfactant-coated alumina/AAS |
100 |
0.024 |
1.6 |
[52] |
|
|
Cu(II), Co(II) |
CPE/CE |
15.9–16.3 |
0.12–0.26 |
0.74–1.8 |
[53] |
|
|
Pb(II) |
Electroanalytical/voltammetry |
– |
15 |
<10 |
[54] |
|
|
Hg(II) |
SPE on chlorodimethylated polystyrene/AAS |
100 |
0.4 |
2.1–3.0 |
[55] |
|
|
Pb(II), Cu(II) |
SPE on poly(dimethylsiloxane) (PDMS) /AAS |
250 |
0.23–0.39 |
5–6 |
Present work |
|
The elution of the analytes from the poly(dimethylsiloxane) (PDMS) column was easily performed with 1M HNO3 in acetone. The good features of the proposed method showed that its convenient and low cost. Also the method is relatively rapid as compared with previously reported procedures for the enrichment of lead and copper(II) ions. The poly(dimethylsiloxane) (PDMS) in the column can be used at least 200 times.
Conclusion
Nano size silica, and micron size silica and ODS particles were successfully immobilized using sol–gel chemistry onto PDMS microfluidic channels to serve as µ-chip SPE devices. They were used for the preconcentration of lead(II) and copper(II) and chemical samples.The reusability of poly(dimethylsiloxane) (PDMS) was as high as greater than 200 cycles without any loss in its sorption behavior. The system was also successful in preconcentrating metal ions from large sample volumes. In addition to validating the developed method by successfully analyzing standard reference materials (lichen (IAEA-336) and apple leaves (SRM 1515)), lead(II) and copper(II) content was established in natural waters, some salts samples by the developed preconcentration method.
Acknowledgements
We gratefully acknowledge financial of department of chemistry, faculty of science, ImamKhomeiniInternationalUniversity, Qazvin. The authors wish to thank the chemistry department of Varamin(Pishva) branch Islamic Azad University and Faculty of Science, Science & Research Brach , Islamic Azad University Tehran for financial support.
References
- Filik H, Ozturk B.D, Dogutan M, Gumus G, Apak R, Talanta 1997,44 ,877.
- Kokal V, Synek P, Talanta 2002, 58,325.
- Locatelli C, Torsi G, Microchem. J. 2004, 78 ,175.
- Kulichenko S.A, Doroschuk V.O, Lelyushok S.O, Talanta 2003, 59,767.
- Kagaya S, Araki Z.A, Hasegawa Y, Anal. Sci. 2002, 18,923.
- A. Goswami, A.K. Sigh, Talanta 2002, 58, 669.
- Yang G, Huang Zh, Hu Q, Yin J, Talanta 2002, 58,511.
- Abou-El-Sherbini K.S, Kenawy I.M.M, Ahmed M.A, Issa R.M, Elmorsi R, Talanta 2002, 58 ,289.
- Mahmoud M.E, Saadi M.S.M, Anal. Chim. Acta 2001, 450, 239.
- Saracoglu S, Elci L, Anal. Chim. Acta 2002,452, 77.
- Yebra M.C, salgado J, Ouig L, Moreno-Cid A, Anal. Bioanal. Chem. 2002, 374, 530.
- Uzan A, Soylak M, Elc¸i L, Talanta 2001, 54, 197.
- Sarac S¸olu, L. Elc¸i, Anal. Chim. Acta 2002, 452, 77.
- Chang H.J, Sung Y.U.H, Huang D.Sh, Analyst 1999, 124, 1695.
- Cerutti S, Silva M.f, Gasquez J.A, Olsina R.AMartinez, L.D, Spectrochim. Acta Part B 2003, 58, 43.
- Pena Y.P.d , Lopez W, Burguera J.L, Burguera M, Gallignani M, Brunetto R, Carrero P, Rondon C, Imbert F, Anal. Chim. Acta 2000, 403, 249.
- Zih-Perenyi K, Lasztity A, Horvath Zs, Levai A, Talanta 1998, 47, 673.
- Bag H, Rehber T¨urker A, Lale M, Talanta 2000, 51, 1035.
- Thorburn Burns D, Tungkananuruk N, Anal. Chim. Acta 1986, 189,383.
- B.K. Puri, S. Balani, Talanta 42 (1995) 337.
- Pourreza N, Zavvar Mousavi H, Anal. Chim. Acta 2004, 503,279.
- Thorburn Burns D, Tungkananuruk N, Thuwasin S, Anal. Chim. Acta 2000, 419, 41.
- Vogel A, Textbook of Quantitative Inorganic Analysis, 3rd ed., Longman, London, 1975.
- Moghimi A, E-Journal of Chemistry 2011, 8(3), 1052
- Nayebi P, Moghimi A ,Oriental Journal of Chemistry 2006,22(3),507.
- Hinze, W.L.; Pramaur, E.; Rev. Crit. ; Anal. Chem. 1993, 24 ,133.
- Moghimi A, Chinese Journal of Chemistry 2007,25, 640.
- Moghimi A, Chinese Journal of Chemistry 2007,25,10, 1536.
- Moghimi A, Ghammamy S, Environmental chemistry an Indian journal 2007, 2(3).
- Moghimi A, Oriental Journal of Chemistry 2006,22(3),527.
- Zhu X, Zhu X, Wang B, Microchim. Acta 2006,154, 95.
- Ghiasvand A.R, Shadabi S, Mohagheghzadeh E, Hashemi P, Talanta 2005,66,912.
- Igarashi S, Ide N, Takagai Y, Anal. Chim. Acta 2000,424 , 263.
- Fan Z,Zhou W, Spectrochim. Acta Part B 2006, 61 ,870.
- Li L, Hu B, Xia L,Jiang Z,Talanta 2006,70 ,468.
- Chamsaz, M.; Arabab-Zavar, M.H.; Nazari, S.; J. Anal. At. Spectrom. 2003,18 , 1279.
- Fragueiro S,Lavilla I,Bendicho C, Spectrochim. Acta Part B 2004, 59, 851.
- Fragueiro S,Lavilla I, Bendicho C,Talanta 2006,68 ,1096.
- Rezaee M,Assadi Y, Milani Hosseini M.R, Aghaee E, Ahmadi F, Berijani S,J. Chromatogr. A 2005,1116 ,1.
- Berijani S,Assadi Y, Anbia M,Milani Hosseini M.R, Aghaee E,J. Chromatogr. A 2006,1123 ,1.
- Manzoori J.Ls, Sorouradin M.H, Shabani A.M.H,Microchem. J. 1999, 63, 295.
- Shamsipur M, Shokrollahi A, Sharghi H and Eskandari M M, J Hazard Mater, 2005,117(2-3), 129-133.
- Taher M.A, Puri S, Bansal R.K, Puri B.K,Talanta 1997, 45,411.
- Moghimi A, Ghiasi R, Abedin A R and Ghammamy S, African J Pure Appl Chem.,2009, 3(3), 51-59.
- Shemirani F, Abkenar S.D, J. Anal. Chem. 2004, 59 (4),327.
- Taher M.A., Turk. J. Chem. 2003,27,529.
- Manzoori J.L, Karim-Nezhad G, Anal. Sci. 2003, 19 (4) ,579.
- Bermejo-Barrera P, Nancy M.A, Cristina D.L, Adela B.B, Microchim.Acta 2003, 142 (1–2) ,101s.
- Kalyakina O.P, Kononova O.N, Kachin S.V, Kholmogorov A.G, Bull. KoreanChem. Soc. 2003, 24 (2) ,173.
- Shemirani F, Akhavi B.T.S, Anal. Lett. 2001, 34 (12) ,2179.
- Tang A.N, Jiang D.Q, Yan X.P, Anal. Chim. Acta 2004,507,199.
- Honeychurch K.C, Hart J.P, Cowell D.C,Anal. Chim. Acta 2001, 431,89.
- Hafez M.A.H,Kenawy, I.M.M, Akl M.A, Lashein R.R, Talanta 2001, 53,749.
- Suvardhan K, Kumar K.S, Krishnaiah L, Rao S.P, Chiranjeevi P, J. Hazard. Mater. 2004,112, 233.s
- Breadmore M.C, Wolfe, K.A, Arcibal I.G, Leung W.K, Dickson D, Giordano B.C , Power M.E, Ferrance J.P, Feldman S.H, Norris P.M, Landers J.P, Anal. Chem. 2003,75,1880.
- Duffy D.C, McDonald J.C, Schueller O.J.A, Whitesides G.M, Anal. Chem. 1998, 70 ,4974.
- Dong H, Thesis, Drexel University, Philadelphia, March 2002.
- Bambrough C.M, Slade R.C.T, Williams R.T, Burkett S.L, Sims S.D, Mann S, J. Colloid Interf. Sci. 1998, 201,220.
- Soaresa C.M.F, Santosa O.A, Olivoa J.E, Castrob H.F, Moraesa F.F, Zanin G.M, J. Mol. Catal. B: Enzym. 2004, 29,69.
- Gallardo J, Galliano P, Duran A, J. Sol–Gel Sci. Technol. 2000, 19,393.
- Lavin P, Mcdonagh C.M, Maccraith B.D, J. Sol–Gel Sci. Technol. 1998, 13,641.
- Innocenzi P, Abdirashid M.O, Guglielmi M, J. Sol–Gel Sci. Technol.1994, 3, 47.

This work is licensed under a Creative Commons Attribution 4.0 International License.
![]()
A New Edition of Web of Science
Journal Impact Factor
2022: 0.5
Five Year: 0.8
Journal is Indexed in

Cabells Whitelist
![]()


