Equillibrium Modelling of Adsorptive Removal of Methylene Blue Using BGA
N.Renugadevi* and J.Krishnaveni
Department of Chemistry,Avinashilingham Institute for Home Science and Higher Education for Women University, Coimbatore - 641043 (India).
The removal of Methylene Blue dye from aqueous solution using a biowaste, dried Blue Green Algae was investigated in terms of variation of initial concentration of the dye solution, adsorbent dosage and pH. The optimum pH for the removal of dye by adsorption was found to be pH 7. The data obtained in this study fitted with Langmuir and Freundlich adsorption isotherms. The experimental data confirms the monolayer adsorption capacity of the adsorbent.
KEYWORDS:Methylene Blue (MB); Blue Green Algae (BGA)
Download this article as:| Copy the following to cite this article: Renugadevi N, Krishnaveni J. Equillibrium Modelling of Adsorptive Removal of Methylene Blue Using BGA. Orient J Chem 2012;28(1). |
| Copy the following to cite this URL: Renugadevi N, Krishnaveni J. Equillibrium Modelling of Adsorptive Removal of Methylene Blue Using BGA. Orient J Chem 2012;28(1). Available from: http://www.orientjchem.org/?p=24020 |
Introduction
Several biological, physical and chemical methods have been used for the treatment of industrial textile waste water containing dyes. However, many of the methods are cost prohibitive. Consequently, adsorption technique seems to have the most potential for future use in industrial waste water treatment (1) because of its proven efficiency in the removal of dyes & metal pollutants and for economic considerations. The most widely used adsorbent for this purpose is commercial activated carbon but its overlying cost has led to search for cheaper alternative material. Therefore, there is a growing interest in finding low cost, easily available material for the dye removal from industrial waste (2, 3). In this study, a biowaste, the Blue Green Algae has been used to remove Methylene Blue (MB) from aqueous solution by adsorption technique.
Materials And Methods
Adsorbent preparation
The collected biomass of algae was washed with distilled water to remove the impurities. Then, the biomass was dried for 30 days to remove the moisture. The dried algae were grinded, sieved by using 250 – mesh wire sieve and used for adsorption experiments.
Batch adsorption experiments
The stock solution of 1000mg/L of Methylene Blue was prepared. The adsorption experiments were performed at 32˚C by varying the initial concentration (60mg/L, 80mg/L, 100mg/L and 120mg/L) of the dye, adsorbent dosage, contact time and pH.
Results and Discussion
Effect of concentration variation
The effect of initial dye concentration on the percentage removal of Methylene Blue dye for various initial concentrations (60mg/L, 80mg/L, 100mg/L and 120mg/L) of the dye solution were studied at pH 7 and at 32˚C. It was observed that the percentage removal of dye decreases with the increase in the concentration of dye solution (Table: 1). This is because at lower concentration, the ratio of dye to the available surface area is low. Subsequently, the adsorption is high. However, at high concentration the available sites of adsorption becomes fewer and hence the percentage removal of dye is less. Similar results are reported in literature (4,5).
Table 1: Adsorption Potential of Methylene Blue Dye with Variation of Initial Concentration of Methylene Blue Solution.
| Time in minutes
|
Removal of Methylene Blue in percentage |
|||
| 60mg/L
|
80mg/L
|
100mg/L
|
120mg/L
|
|
| 10 | 83.76 | 78.29 | 75.7 | 51.6 |
| 20 | 88.03 | 79.08 | 77.7 | 56.1 |
| 30 | 88.89 | 84.49 | 82.4 | 57.3 |
| 40 | 89.75 | 86.82 | 86.5 | 61.8 |
| 50 | 91.45 | 88.38 | 87.8 | 64.3 |
| 60 | 92.31 | 89.15 | 87.8 | 66.9 |
| 90 | 92.31 | 89.93 | 88.5 | 70.1 |
| 120 | 93.16 | 90.70 | 90.5 | 74.5 |
| 150 | 94.02 | 92.24 | 91.2 | 78.9 |
| 180 | 94.87 | 93.03 | 91.9 | 80.3 |
Effect of contact time
The effect of contact time on the adsorption process was studied at pH 7 by varying the contact time from 10 to 180 minutes at 32˚C using 500mg of the adsorbent and 100ml 0f the dye solution containing 100mg of the Methylene Blue dye. The percentage removal of the dye was found to increase from 75.7 to 91.9% when the contact time was varied from 10 to 180 minutes (Table: 1). It was observed that the percentage removal of the dye increased with increase in contact time. The increase in adsorption with increase in contact time may be attributed to the increased intraparticle diffusion occurring on longer shaking time (6, 7).
Effect of pH
The effect of initial pH of the dye solution on the amount of Methylene Blue dye adsorbed was studied by varying the initial pH of the dye solution from 5 to 9. The percentage removal of Methylene Blue dye increased from 86.5 to 91.89% when the pH of the dye solution was varied from pH 5 to 7. This may be due to the lowered electrostatic repulsion between the positively charged MB dye molecules and the surface of adsorbent, consequently the removal efficiency is increased with increase in pH. The optimum pH for the removal of dye from aqueous solution by adsorption was found to be in pH 7 (Table: 2).
Table 2: Adsorption Potential of Methylene Blue Dye with pH Variation
| Time in minutes
|
Removal of Methylene Blue in percentage
|
||||
| pH 5
|
pH 6
|
pH 7
|
pH 8
|
pH 9
|
|
| 10 | 66.22 | 73.33 | 75.68 | 67.57 | 53.5 |
| 20 | 68.92 | 79.33 | 77.70 | 75.68 | 75.8 |
| 30 | 69.59 | 80.67 | 82.43 | 81.76 | 80.9 |
| 40 | 73.65 | 84.00 | 86.49 | 85.14 | 82.2 |
| 50 | 75.00 | 84.67 | 87.84 | 85.81 | 84.1 |
| 60 | 75.68 | 85.33 | 87.84 | 86.49 | 85.4 |
| 90 | 81.76 | 85.33 | 88.51 | 88.00 | 85.9 |
| 120 | 85.14 | 86.67 | 90.54 | 90.45 | 87.9 |
| 150 | 85.81 | 87.33 | 91.22 | 91.01 | 87.9 |
| 180 | 86.5 | 88.00 | 91.89 | 91.57 | 87.9 |
Effect of adsorbent dosage
The effect of adsorbent dosage on Methylene Blue removal was tested by varying the adsorbent dose of Blue Green Algae from 100 to 500mg. The initial concentration of the dye solution used in this study was 100mg/L and the experiments were carried out at pH 7 by varying the contact time from 10 to 180 minutes at 32˚C. From the experimental data (Table: 3), it is clear that the percentage removal of dye increases from 45.27% to 91.9 % with the increase of adsorbent dosage. This may be due to the increase in effective surface area and increasing availability of active adsorption sites from the increase in adsorbent dosages (8, 9).
Table 3: Adsorption Potential of Methylene Blue Dye with Dosage Variation
| Time in minutes |
Removal of Methylene Blue in percentage |
||||
| 100 mg
|
200 mg
|
300 mg | 400 mg | 500mg | |
| 10 | 31.08 | 37.8 | 66.22 | 73.33 | 75.7 |
| 20 | 33.11 | 53.4 | 68.92 | 75.80 | 77.7 |
| 30 | 33.11 | 67.57 | 69.59 | 80.89 | 82.4 |
| 40 | 35.14 | 79.8 | 73.65 | 82.17 | 86.5 |
| 50 | 41.22 | 85.81 | 75.00 | 84.08 | 87.8 |
| 60 | 43.24 | 85.81 | 75.68 | 85.35 | 87.8 |
| 90 | 43.92 | 89.19 | 81.76 | 85.99 | 88.5 |
| 120 | 44.59 | 89.86 | 85.14 | 87.89 | 90.5 |
| 150 | 45.27 | 90.54 | 85.81 | 87.89 | 91.2 |
| 180 | 45.27 | 91.22 | 90.79 | 87.89 | 91.9 |
Adsorption isotherms
The results obtained in this study by varying concentration of the aqueous solution of Methylene Blue dye using the Blue Green Algae adsorbent were interpreted in terms of Langmuir and Freundlich adsorption isotherm.
Langmuir adsorption isotherm
Langmuir adsorption isotherm is based on the assumption that points of valency exist on the surface of the adsorbent and that each of these sites is capable of adsorbing only one molecule. Thus the adsorbed layer will be one molecule thickness. Further, it is assumed that all the adsorption sites have equal affinities for the adsorbate and the presence of adsorbed molecules will not affect the adsorption of molecules at an adjacent site. The Langmuir adsorption isotherm is commonly given by
x/m = (k1Co) / 1 + k1Ce
where, x is the amount of Methylene Blue dye adsorbed (mg/L), m is the weight of adsorbent (mg), Ce is the concentration of MB dye solution at equilibrium and k1 is a Langmuir constant corresponding to the measure of maximum energy of adsorption capacity.
On rearranging, the above equation becomes,
m/x = 1/ (k1/ k11) + 1/ k1Ce
A linear plot of 1/Ce versus m/x (figure:1,2) shows the applicability of Langmuir adsorption isotherm(10) for the present study indicating the formation of monolayer coverage of adsorbate on the surface of the blue green algae used in this study.
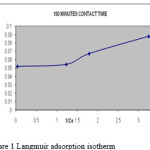 |
Figure 1: Langmuir adsorption isotherm |
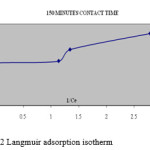 |
Figure 2: Langmuir adsorption isotherm |
Separation factor (RL) : The essential characteristics of Langmuir isotherm can be expressed in terms of a dimensionless constant, separation factor or equilibrium parameter ‘RL’ which is defined by RL = 1 / 1+ b Ci where Ci is the initial concentration of the MB dye and b is the Langmuir constant (k1)
The value of RL and the feasibility (11, 12) of the adsorption process is as follows:
| RL value | Type of isotherm |
| RL> 1
RL = 1 RL < 1 |
Unfavourable
Linear Favourable |
In this study, RL values obtained are in the range 0.0316 – 0.0161 (below 1) indicates the feasibility of the adsorption of Methylene Blue dye from aqueous solution with the adsorbent Blue Green Algae (Table: 4) and also suggest the homogeneous distribution of active sites on the dried Blue Green Algae surface.
Table: 4 The values of parameters and correlation coefficient for each isotherm model
|
Concentration of dye solution mg/L |
Langmuir Isotherm |
Freundlich Isotherm
|
||||
|
K1 |
RL |
R2 |
Kf |
1/n |
R2 |
|
|
60 80 100 120 |
0.051 |
0.0316 0.0239 0.0192 0.0161 |
0.938
|
1.122 x 10⁻³ |
0.3698 |
0.8898 |
Freundlich adsorption isotherm
Freundlich isotherm is given by the equation:
log x/m= logKf + 1/n log Ce
Where Kf and 1/n are Freundlich constants, which are related to the adsorption capacity and adsorption intensity respectively and x/m is the amount of adsorbate in an aqueous solution at equilibrium. The Freundlich adsorption isotherm plots at 320C are obtained by plotting log x/m versus log Ce (figure: 3, 4) for different concentrations of Methylene Blue dye solution. The plots obtained are linear showing the applicability of Freundlich adsorption isotherm for the removal of MB dye. The value 1/n ranges from 0 to 1 (0.3698) confirms the favourable adsorption of MB onto BGA. The correlation coefficient (R2 = 0.8898) shows the good mathematical fit of Freundlich adsorption isotherm with the experimental data.
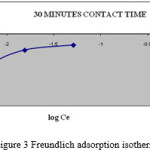 |
Figure 3: Freundlich adsorption isotherm |
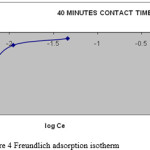 |
Figure 4: Freundlich adsorption isotherm |
Conclusion
The results of this study indicated that BGA can be successfully used for the adsorption of Methylene Blue from aqueous solutions. Langmuir and Freundlich adsorption isotherm were well fitted with the equilibrium data for adsorption of Methylene Blue dye from aqueous solution. The maximum removal of Methylene Blue dye was found to 91.89% at pH 7 with 500mg of the adsorbent when the concentration of the MB dye solution used was 100mg/L. Based on the above investigations, proper conclusions were drawn on the development of treatment technology for the adsorption of dye by using dried Blue Green Algae.
References
- Gong R., et al., Dyes and Pigments, 73 (3), 332 – 337, (2007).
- Namasivayam C. Prabha D. and Kumutha M., Bioresource.Tech., 64,77-79, (1998).
- Hashemian S., Main Group Chem., 6 (2), 97 – 107,(2007).
- Kannan N. and Meenakshisundaram M., Water,Air,Soil poll., 138, 289 -305, (2001).
- Ho Y.S. Huang C.T. and Huang H.W., Process Biochemistry 37, 1421-1430, (2002).
- Renugadevi N. Manjusha K. and Lalitha P., Archives of Applied Science Research, 2(6), 281- 284 ,(2010).
- Namasivayam C. Yamuna R. T., Water Air Soil Pollut., 113 (1),371-384, (1999).
- Krishna G. Bhattacharyya and Arunima Sharma, Dyes and Pigments, 65(1), 51 – 59, (2005).
- Aksu Z. and Tezer S., Journal of Processing Biochemistry, 40, 1347-1361,(2005).
- Coulson J.M. and Richardson J.F. with Backhurst J.R. and Harker J.H., Chemical Engineering , Volume 2, Fourth Edition, PERGAMON Press, Heading ton Hill Hall, Oxford, (1991).
- Weber W.J. and Morris J.C., Journal of Sanitary Engineering, Div.Am.Soc.Civ.Eng., 89, 31 – 59, (1963).
- Hall K.R. Eagleton L.C. Acrivos A. & Vermeulen T., Ind Eng Chem Fund, 5, 212, (1966).

This work is licensed under a Creative Commons Attribution 4.0 International License.
![]()
A New Edition of Web of Science
Journal Impact Factor
2022: 0.5
Five Year: 0.8
Journal is Indexed in

Cabells Whitelist
![]()


