Cloud-Point Method of Extraction Co(II) and Determination by FAAS
Mohamad Javad Poursharifi¹ and Ali Moghimi²*
¹Department of Chemistry, Saveh Branch Islamic Azad University, Saveh (Iran).
²Department of Chemistry, Varamin (Pishva)Branch Islamic Azad University, Varamin (Iran).
A new, simple and versatile cloud-point extraction (CPE) methodology has been developed for type equation here.the separation and preconcentration of Co. The metals in the initial aqueous solution were complexed with 2-(2-benzothiazolylazo)-2-p-cresol (BTAC ) and Triton X-114 was added as surfactant. Dilution of the surfactant-rich phase with acidified methanol was performed after phase separation, and the Co contents were measured by flame atomic absorption spectrometry. The variables affecting the cloud-point extraction were optimized using a Box–Behnken design. Under the optimum experimental conditions, enrichment factors of 29 and 25 were achieved for Cdmium. The accuracy of the method was evaluated and confirmed by analysis of the ICPAES. The limits of detection expressed to solid sample analysis were 0.1 µg g-1 (Co). The precision for 10 replicate measurements of 75 µgL”1 Co was 0.9. The method has been successfully applied to the analysis of water samples.
KEYWORDS:Co; Cloud-point extraction; water samples
Download this article as:| Copy the following to cite this article: Poursharifi M. J, Moghimi A. Cloud-Point Method of Extraction Co(II) and Determination by FAAS. Orient J Chem 2012;28(1). |
| Copy the following to cite this URL: Poursharifi M. J, Moghimi A. Cloud-Point Method of Extraction Co(II) and Determination by FAAS. Orient J Chem 2012;28(1). Available from: http://www.orientjchem.org/?p=23957 |
Introduction
In the recent years, pollution of the environment by heavy metals has received considerable attention. These elements accumulate in living organisms and are of high toxic potential. Their wide technological use (fertilizers, mining, pigments), as well as their production from burning oil and coal and incineration of waste causes an extensive anthropogenic contamination of soil, air and water1. Several analytical techniques such as flame atomic absorption spectrometry (FAAS)2,3, inductively coupled plasma atomic emission spectrometry (ICP-AES)4 and inductively coupled plasma mass spectrometry (ICP-MS)5 are available for the determination of trace metals with enough sensitivity for the most applications. Despite good developments in the modern analytical instruments, which allow great enhancement in aspects of analysis, in many cases the available analytical instrumentation does not have enough sensitivity for the analysis of natural samples. Sample preparation is still a bottleneck for overall throughput because the involved steps often employ large volumes of hazardous organic solvents, are time consuming and/or expensive1. Although, the determination of trace metal ions in natural waters is difficult due to various factors, particularly their low concentrations and matrices effects. Pre-concentration and separation can solve these problems and can lead to a higher confidence level and easy determination of the trace elements. Several procedures have been developed for the separation and preconcentration of contaminants from environmental matrices, such as: liquid–liquid extraction (LLE)6–8, co-precipitation9–11, solid phase extraction (SPE)12–20.
Although, disadvantages such as significant chemical additives, solvent losses, complex equipment, large secondary wastes, unsatisfactory enrichment factors and high time consumption, limit the application of these techniques. These problems could be addressed by the development of modular and compact processes that provide adequate separation and preconcentration without complex processes. The solvent microextraction technique effectively overcomes these difficulties by reducing the amount of organic solvent as well as allowing sample extraction and preconcentration to be done in a single step. The technique is faster and simpler than conventional methods. It is also inexpensive, sensitive and effective for the removal of interfering matrices. Solvent microextraction is a form of solvent extraction with phase ratio values higher than 100. Compared with the conventional solvent extraction, microextraction may provide poorer analyte recovery, instead the concentration in the organic phase greatly enhances. In addition, the amount of the used organic solvent is highly reduced and only one step of manipulation is necessary, therefore, problems of contamination and loss of analytes vanishes.Cloud point extraction (CPE)21–26, homogeneous liquid–liquid extraction (HLLE)27,28 and single drop microextraction (SDME)29–33 are fairly new methods of sample preparation which are used in separation and preconcentration of metals and can solve some of the problems encountered with the conventional pretreatment techniques.In the previous researches, we demonstrated a novel microextraction technique, named dispersive liquid–liquid microextraction (DLLME), which was successfully used, for the extraction and determination of polycyclic aromatic hydrocarbons (PAHs), organphosphorus pesticides (OPPs) and chlorobenzenes in water samples34–36. DLLME is a modi- fied solvent extraction method and its acceptor-to-donor phase ratio is greatly reduced comparing with the other methods. In DLLME, the appropriate mixture of the extraction and disperser solvents is rapidly injected by syringe into aqueous samples containing analytes. Thereby, cloudy solution forms. In fact, the cloudy state results from the formation of fine droplets of the extraction solvent, which disperse in the sample solution. Then, this cloudy solution shall be centrifuged and the fine droplets sediment at the bottom of the conical test tube. The determination of anlaytes in sedimented phase can be performed by instrumental analysis. In this extraction method any component in the solution, directly or indirectly after previous (or simultaneous) derivatization reaction, interacts with the fine droplets of the extraction solvent and consequently gets extracted from the initial solution and concentrates in the small volume of the sedimented phase. Simplicity of the operation, rapidity, low sample volume, low cost, high recovery and high enrichment factor are some advantages of DLLME.DLLME is a miniaturized sample pre-treatment technique. On the other hand, graphite furnace atomic absorption spectrometry (GF AAS) is a microamount sample analysis technique. Therefore, it makes it perfect when a combination of both DLLME and GFAAS is used. The applicability of the approach has been demonstrated for the determination of Co in water samples. This element was selected for evaluation of the procedure because Co is one of the principal heavy metals of analytical interest due to its extreme toxicity even at relatively low concentrations37-39,41-44.
The aim of this work is to apply a thiazolylazo reagent, 2-(2-benzothiazolylazo)-2-p-cresol (BTAC) in a CPE procedure for determination of Co in water samples. Some analogous compounds of BTAC such as 2-(6-methyl-2-benzothiazolylazo)-5- diethyl aminophenol (MBTAE)45–46 and 2-(2-thiazolylazo)- 5-diethylaminophenol (TADAP) 47-49 have been applied as a precolumn derivatizing reagent in high-performance liquid chromatography (HPLC). Another analogue, 2-(6-bromo-2- benzothiazolylazo)-5-diethyl aminophenol,was synthesized and applied to the spectrophotometric determination of nickel50 and zirconium 51. According our knowledge, the use of BTAC in analytical procedures has not been reported before.
Experimental
Apparatus
Determination of Co2+ contents in working samples were carried out by a Varian spectra A.200 model atomic absorption spectrometerequipped with a high intensity hallow cathode lamp(HI-HCl) according to the recommendations of the manufacturers. Separation of sorbent was assisted using a centrifuge (centurion scientific model: K 240R, West Sussex, U.K.). The pH measurements were carried out by an ATC pH meter (EDT instruments, GP 353).
Reagents
All chemicals and reagents used in this study were of analytical-reagent grade. Deionized water was used to prepare all solutions. The laboratory glassware was kept in dilute nitric acid at least overnight and subsequently washed with deionized water. Solutions of the non-ionic surfactant Triton X-114 (Merck) were prepared in high purity deionized water. BTAC solutions were prepared by dissolving appropriate amounts of 2-(2-benzothiazolylazo)-2-p-cresol (BTAC) laboratory-prepared in absolute ethanol (Merck, Darmstadt, Germany). One thousand milligrams per liter stock standard solutions of Co(II) were purchased from Merck. Nitric acid solutions were prepared by direct dilution with deionized water from the concentrated solutions (Merck). Methanol (Merck) was used to decrease the viscosity of surfactant-rich phase. Acetate (4.6), phosphate (6.3) and borate (7.5 and 8.0) buffers were used to adjust the sample pH. Sodium carbonate (Merck), 2-ethylhexyl-amine (Sigma–Aldrich), sodium nitrite (Merck), ethanol (Merck) were used for synthesis of BTAC. The accuracy of the method was assessed by analysing the following certified reference materials (CRM): NIST 1515 Apple Leaves, NIST 1570a Spinach Leaves and NIST 1573a Tomato Leaves from the National Institute of Standards and Technology (Gaithersburg, MD, USA).
Synthesis of BTAC
BTAC was obtained by coupling diazotized 2-aminobenzothiazole with p-cresol in acid solution at 0–5◦C as described previously40. 2-Aminobenzothiazole was dissolved (6.0 g) in 120 ml of a 6 mol l−1 sulfuric acid solution. To this solution was added dropwise a solution of 3.0 g of sodium nitrite in 20 ml of water at 0–5◦C and the mixture was stirred and kept at 0–5◦C for 1 h. For coupling, 4.3 g of p-cresol was added to 20 ml of a 1 mol l−1 sodium carbonate solution and the mixture was cooled to 0–5◦C. This solution was added dropwise to the above diazotized solution with vigorous stirring. The system was allowed stand overnight in refrigerator at 4◦C. The orange color precipitate formed was filtered and purified by recrystallization with isopropyl alcohol. A yield of about 90% was obtained. Melting point was determined five times and varied in the range of 158–160◦C. Elemental analysis: C14H11ON3S requires C 62.46%, H 4.09%, O 5.94%, N 15.60%, S 11.91%; found: C 62.12%, H 3.99%, O 6.80%, N 15.53%, S 11.85%.
Samples and sample pretreatment
water samples were taken from the Tap water(Tehran, taken after 10 min operation of the tap),rain water(Tehran, 26january, 2007), Snow water (Saveh , 6 February,2007)and Sea water(taken from Caspian sea, near the Mahmoud-Abad shore) at Iran. After cooling at room temperature these solutions were adjusted to pH with a 10% (w/v) sodium hydroxide. The solution was made up to required volume with deionized water into a 50-mL volumetric flask. The same procedure was used for the blank solutions. Spiked samples were also prepared in order to calculate the recovery of the digestion procedure.
Cloud-point extraction procedure
An aliquot (10 mL) of a Co buffered solution was transferred to a 15mL centrifuge tube. Appropriate amounts of BTAC and Triton X-114 solutions were added. The sample solution was left to equilibrate in a thermostated bath for 15 min at 40 ◦C. The system was then centrifuged at 3500 rpm for 20 min to achieve complete separation of the two phases. The phases were cooled down in an ice bath in order to increase the viscosity of the surfactant-rich phase. After the cloud-point extraction, the aqueous phase was decanted by inverting the tube. Later 200 µL of a 1:1 (v/v) methanol; 1 mol L−1 HNO3 solution was added to the surfactant-rich phase. The resultant solution was directly introduced into the FAAS by conventional aspiration and the Cdmium content was measured.
Results and discussion
Optimization of the experimental conditions for CPE
In order to investigate the influence of the main variables in CPE procedure, a Box–Behnken designwas employed [30]. The variables: pH, BTAC concentration (BC) and surfactant concentration (SC) were optimized. Table 1 shows the experiments executed for this design. The data in Table 1 are described by a quadratic model in the three factor variables. The equation that represents the relationship among the analytical signal for Co and pH, BTAC concentration and surfactant concentration are the following:
| Experiment | pH | SC (% v/v) | BC (mol L−1 ) | RCo | |
| 1 | 4.6 (−1.0) | 1.0 (−1.0) | 1.84 × 10⁻³ (0.0) | 0.1700 | |
| 2 | 8.0 (1.0) | 1.0 (−1.0) | 1.84 × 10⁻³ (0.0) | 0.1800 | |
| 3 | 4.6 (−1.0) | 2.0 (1.0) | 1.84 × 10⁻³ (0.0) | 0.1720 | |
| 4 | 8.0 (1.0) | 2.0 (1.0) | 1.84 × 10⁻³ (0.0) | 0.1680 | |
| 5 | 4.6 (−1.0) | 1.5 (0.0) | 1.23 × 10⁻³ (−1.0) | 0.1660 | |
| 6 | 8.0 (1.0) | 1.5 (0.0) | 1.23 × 10⁻³ (−1.0) | 0.1810 | |
| 7 | 4.6 (−1.0) | 1.5 (0.0) | 2.46 × 10⁻³ (1.0) | 0.1680 | |
| 8 | 8.0 (1.0) | 1.5 (0.0) | 2.46 × 10⁻³ (1.0) | 0.1840 | |
| 9 | 6.3 (0.0) | 1.0 (−1.0) | 1.23 × 10⁻³ (−1.0) | 0.1900 | |
| 10 | 6.3 (0.0) | 2.0 (1.0) | 1.23 × 10⁻³ (−1.0) | 0.1990 | |
| 11 | 6.3 (0.0) | 1.0 (−1.0) | 2.46 × 10⁻³ (1.0) | 0.1840 | |
| 12 | 6.3 (0.0) | 2.0 (1.0) | 2.46 × 10⁻³ (1.0) | 0.2000 | |
| 13 | 6.3 (0.0) | 1.5 (0.0) | 1.84 × 10⁻³ (0.0) | 0.2160 | |
| 14 | 6.3 (0.0) | 1.5 (0.0) | 1.84 × 10⁻³ (0.0) | 0.2240 | |
| 15 | 6.3 (0.0) | 1.5 (0.0) | 1.84 × 10⁻³ (0.0) | 0.2280 | |
| SC: surfactant concentration; BC: BTAC concentration; R Co : analytical signal for Co. | |||||
RCo = 0.2227 ∗ +0.0046 (pH) − 0.0343 ∗ (pH)2
+0.0019 (SC) − 0.0158 ∗ (SC)2 − 0.0136 (BC)2
−0.0035 (pH) (SC) + 0.0002 (pH) (BC)
+0.0017 (SC) (BC) (1)
Values marked with * are significant. Considering Eq. (1), a maximum point is predicted for the codified factor levels of 0.065 for pH, 0.052 for surfactant concentration and 0.0039 for BTAC concentration. Corresponding real values from data of Zinc are: 6.4 (pH), 1.53% (v/v) (surfactant concentration) and 1.84×10⁻³ mol L−1 (BTAC concentration). The results from mathematical adjustment by surface response graphs can be seen in Fig. 1. The critical point of surface response from data of Co was characterized as a saddle point. This point is a stationary point of a surface response which presents the maximum response for the levels of some variables and simultaneously the minimum response for the levels of other variables of the system53. The results obtained separately for Co agree with the results calculated using the multiple response function which were: 7.5 (pH), 1.0% (v/v) (surfactant concentration) and 1.9×10⁻³ mol L−1 (BTAC concentration)53,54.
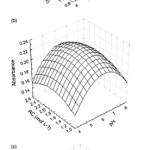 |
Figure 1: Response surface plot of the Co analytical signal as a function of (A) pH and surfactant concentration, (B) pH and reagent concentration and (C) surfactant concentration and reagent concentration. |
Analytical features
Calibration graphs obtained with preconcentration gave good linearity over the concentration range of 1.0–100.0µgL−1 of Co (Abs = 8.67×10⁻³ + 2.84×10⁻³ C). Abs is the absorbance and C is the metal concentration, in µgL−1. By using metal standard solutions with Cdmium concentrations in the range from 50.0 to 2000.0 µgL−1, calibration graphs for metals without preconcentration were also obtained. These calibration graphs were: Abs = 2.20×10⁻³ + 9.80 ×10⁻⁵C for Co. The enrichment factors of metals were based on matching the slopes of calibration graphs of preconcentration procedure and those by a conventional FAAS nebulization method. The enrichment factors of Co was 29fold. The limit of detection (LOD) was calculated based on three times (3s) of standard deviation of blank signal by 11 replicate measurements 55. LODs was 0.9 µgL−1for Co. The limit of uantification (LOQ) is the concentration that gives a response equivalent to ten times the standard deviation of blank signal (n = 11), and define the lower limit of the range. LOQ was also calculated for Co (1.5 µgL−1). The precision (determined as the relativestandard deviation) for 10 replicate measurements of 75 µgL−1 Co was 0.9.
Interference
The interference of foreign ions on the CPE determination of 100.0µgL−1 Co was studied. The tolerance limits of various foreign species on the sorption of the metal ions are given in Table 2. These tolerance limits were taken as that value which caused an error of not more than 5% in the absorbance reading. Most of the metal ions are tolerated up to 400 mg L−1. The potential interferences from some common matrix cations such as Na(I), K(I) and Mg(II) were also investigated. These substances are tolerated at concentrations at least up to 30 g L−1. The results obtained in these experiments demonstrate that the presence of large amounts of species commonly present in water samples have no significant effect on the CPE of Co.
Table 2: Effect of foreign ions on the cloud-point extraction of 100.0µgL−1 Co
| Substance | Concentration |
| Co | |
| Al3+
Ba2+ Br− Cu2+ Cl− Cd2+ Cr2O72−CrO42− Fe3+ K+ Mg2+ Na+ Ni2+ NO3− Pb2+ SO42− Ca2+ |
250.0 mg L−1
45.0 g L−1 40.0 g L−1 300.0 mg L−1 50.0 g L−1 240.0 mg L−1 12.0 mg L−1 12.0 mg L−1 18.0 mg L−1 55.0 g L−1 50.0 g L−1 70.0 g L−1 4.0 mg L−1 30.0 g L−1 600.0 mg L−1 30.0 g L−1 300.0 mg L−1 |
Analysis of water samples
To assess the applicability of the method to real samples, it was applied to the extraction and determination of copper from different water samples. Tap water(Tehran, taken after 10 min operation of the tap),rain water(Tehran, 26 January, 2007), Snow water (Saveh , 6 February ,2007)and Sea water(taken from Caspian sea, near the Mahmoud-Abad shore) samples were analyzed(Table 3). As is seen, the recovered Co ion reveals that the results are quite reliable and are in satisfactory agreement with those obtained by ICPAES.
Table 3: Recovery of Co added to 1000mL of different water samples ( After cooling at room temperature these solutions were adjusted to pH with a 10% (w/v) sodium hydroxide).
| Sample | Co2+ added (µg) | Co 2+determined(ng.mL-1) | ICP-AES |
| Tap water | 0.0
10.0 |
1.75(0.8)a
11.95(0.6) |
ND
11.9 |
| Snow water | 0.0
10.0 |
4.84(1.2)
14.90(1.1) |
ND
14.4 |
| Rain water | 0.0
10.0 |
2.67(1.3)
12.79(1.0) |
ND
12.1 |
| Sea Water | 0.0
10.0 |
12.69(1.1)
22.98(1.0) |
12.2
23.6 |
Application
The results demonstrate the applicability of the method for interference-free determination of the metals. Applicability of the method to real samples was checked by the determination of Co in waters. The results of this investigation are given in Table 2. It can be seen that the recovery of spiked samples is good. The results indicate that the proposed method is applicable for routine monitoring of Co in these matrices. The limits of detection and quantification expressed to solid sample analysis were: Co (LOD = 0.1µg g−1, LOQ= 0.51µg g−1).
Conclusion
The reagent BTAC was successfully employed in a CPE procedure for determination of Co in water samples by FAAS. This study allowed the development of a rapid, easy to use, safe, environmentally friendly and inexpensive methodology for the preconcentration and separation of trace metals. The method significantly improved the performance of the FAAS detection for Co. The method developed was simple, reliable, and precise for determining Co in water. Also, the proposed method was free of interference compared to conventional procedures to determine Cdmium.55-
Acknowledgements
The authour wish to thank the Chemistery Department of East Tehran(Ghiamdasht) Campus Islamic Azad University and SavehCampus Islamic Azad University for financial support.
References
- Carasek, E.; Tonjes, J.W.; Scharf, M. Talanta 2002,56 ,185.
- MOGHIMI, A. Oriental Journal of Chemistry 2006,22(3),527.
- Anthemidis,A.N.; Zachariadis, G.A.; Farastelis, C.G.; Stratis, J.A. Talanta 2004,62 ,437.
- Boevski, Iv. ; Daskalova, N.; Havezov, I.; Spectrochim. Acta Part B 2000,55 ,1643.
- Xia, L.; Hu, B.; Jiang, Z.;Wu, Y.; Li, L.; Chen, R. J. Anal. At. Spectrom. 2005, 20 ,441.
- Welz, B. Atomic Absorption Spectrometry, VCH, Amsterdam, 1985.
- Marczenko, Z. Separation and Spectrophotometric Determination of Elements, Ellis Hardwood, London, 1986.
- Anthemidis,A.N.; Zachariadis, G.A.; Stratis, J.A. J. Anal. At. Spectrom. 2003,18 ,1400.
- Atsumi, K.; Minami,T. Uada, J. Anal. Sci. 2005,21 ,647.
- Saracoglu, S.; Soylak, M.; Elci, L. Talanta 2003, 59 ,287.
- Doner, G.; Ege, A. Anal. Chim. Acta 2005,547 ,14.
- Yamini,Y.; Hejazi, L.; Mohammadi, D.E. Microchim. Acta 2003,142 ,21.
- Burham, N.; Abdel-Azeem, S.M. ; El-Shahat, M.F.; Anal. Chim. Acta 2006,579 ,193.
- MOGHIMI, A. “Chinese Journal of Chemistry ” 2007,25, 640.
- Jamali, M.R. ; Assadi, Y.; Shemirani, F.; Milani Hosseini, M.R. ; Rahnama Kozani, R. ; Masteri-Farahani, M. ; Salavati-Niasari, M. ; Anal. Chim. Acta 2006,579, 68.
- Bowles, K.C. ; Apte, S.C. ; Batley, G.E. ; Hales, L.T. ; Rogers, N.J.; Anal. Chim. Acta 2006,558 ,237.
- Melek, E.; Tuzen, M..; Soylak, M. Anal. Chim. Acta 2006,578, 213.
- Dos Santos, E.J.; Herrmann, A.B.; Ribeiro, A.S.; Curtius, A.J.; Talanta 2005,65 ,593.
- Lemos, V.A. ; Baliza, P.X. ; Talanta 2005,67 ,564.
- Wang, J.; Hansen, E.H. ; J. Anal. At. Spectrom. 2002,17 ,248.
- Hinze, W.L.; Pramaur, E.; Rev. Crit. ; Anal. Chem. 1993, 24 ,133.
- Stalikas, C.D. ; Trends Anal. Chem. 2002,21,343.
- Paleogos, E.K. ; Giokas, D.L. ; Karayannis, M.I.. ; Trends Anal. Chem. 2005, 24, 426.
- Borges, D.L.G. ; daVeiga, M.A.M.S. ; Frescura, V.L.A. ; Welz, B.; Curtius, A.J. J. Anal. At. Spectrom. 2003,18 , 501.
- Nayebi, P.; MOGHIMI, A. Oriental Journal of Chemistry 2006,22(3),507.
- Zhu, X. ; Zhu, X. ; Wang, B. ; Microchim. Acta 2006,154, 95.
- Ghiasvand, A.R. ; Shadabi, S. ; Mohagheghzadeh, E. ; Hashemi, P. ; Talanta 2005,66,912.
- Igarashi, S.; Ide, N.; Takagai, Y.; Anal. Chim. Acta 2000,424 , 263.
- Fan, Z.; Zhou, W.; Spectrochim. Acta Part B 2006, 61 ,870.
- Li, L.; Hu, B.; Xia, L. ; Jiang, Z. ; Talanta 2006,70 ,468.
- Chamsaz, M.; Arabab-Zavar, M.H.; Nazari, S.; J. Anal. At. Spectrom. 2003,18 , 1279.
- Fragueiro, S.; Lavilla, I.; Bendicho, C.; Spectrochim. Acta Part B 2004, 59, 851.
- Fragueiro, S.; Lavilla, I.; Bendicho, C.; Talanta 2006,68 ,1096.
- Rezaee, M.; Assadi Y.; Milani Hosseini, M.R. ; Aghaee, E.; Ahmadi, F. ; Berijani, S.; J. Chromatogr. A 2005,1116 ,1.
- Berijani, S.; Assadi, Y. ; Anbia, M.; Milani Hosseini, M.R. ; Aghaee, E.; J. Chromatogr. A 2006,1123 ,1.
- Rahnama Kozani, R.; Assadi, Y.; Shemirani, F.; Milani Hosseini, M.R. ; Jamali, M.R.; Talanta, in press.
- Robards, K.; Worsfold, P. Analyst 1991,116 ,549.
- Kaewsarn, P.; Yu, Q. Environ. Pollut. 2001,112 , 209.
- M.S.Tehrani,; A.Moghimi,; S. Waqif Husain,.Material Science Research India 2005,3(2),135.
- I.C.S. Fraga, M.Sc. dissertation, Pontificia Universidade Católica, Rio de Janeiro, Brazil, 1989.
- MOGHIMI, A. “Chinese Journal of Chemistry ” 2007,25, 640.
- MOGHIMI, A. Oriental Journal of Chemistry 2006,22(3),527.
- Moghimi, A.; S.Tehrani, M.; Waqif Husain, S. Material Science Research India 2006,3(1a),27.
- Nayebi, P.; MOGHIMI, A. Oriental Journal of Chemistry 22(3) (2006) 507.
- Q.P. Liu, J.C. Liu, Y. Tong, J.K. Cheng, Anal. Chim. Acta 269 (1992) 223.
- Q.P. Liu, T. Zhao, J.C. Liu, J.K. Cheng, Microchim. Acta 122 (1996) 27.
- I.V. Mishenina, E.N. Shapovalova, T.A. Bolshova, P.V. Smirnov, O.A. Shpigun, J. Anal. Chem. 51 (1996) 270–276.
- H. Wang, H.S. Zhang, J.K. Cheng, Talanta 48 (1999) 1.
- H.Wang, H.S. Zhang, J.K. Cheng, P.H. Qiu Microchem. J. (1997) 332.
- C.P. Zhang, D.Y. Qi, T.Z. Zhou, Talanta 29(1982) 1119.
- T.Z. Zhou, D.Y. Qi, C.P. Zhang, Acta Chim. Sin. 41(1983) 237.
- S.L.C. Ferreira, R.E. Bruns, H.S. Ferreira, G.D. Matos, J.M. David, G.C. Brand˜ao, E.G.P. da Silva, L.A. Portugal, P.S. dos Reis, A.S. Souza,W.N.L.dos Santos,Anal. Chim. Acta 597 (2007) 179.
- S.L.C. Ferreira, W.N.L. dos Santos, C.M. Quintella, B.B. Neto, Talanta 63 (2004) 1061.
- L.A. Portugal, H.S. Ferreira, W.N.L. dos Santos, S.L.C. Ferreira, Microchem. J. 87(2007) 77.
- G.L. Long, D. Wineforder, , Anal. Chem. 55 (1983) 712A.
- Choi,Y.S.;Choi,H.S.Bull.Korean Chem. Soc.24(2003)222.
- Matoso,E.;Kubota,L.T.;Cadore,S. Talanta 60(2003)1105.
- Purachat, B.; Liawruangrath,S.;Sooksamiti,P.;Rattanaphani,S.;Buddhasukh, D.Anal.Sci. 17(2001)443.
- Wuhan University, Analytical Chemistry, 4th ed., Higher Education Press,Beijing, China, 1999, p. 275.
- V.A. Lemos, R.S. Franc¸a, B.O. Moreira, Sep. Purif. Technol. 54 (2007) 349.
- J.L. Manzoori, G. Karim-Nezhad,Anal. Chim. Acta 521 (2004) 173.
- J.L. Manzoori, A. Bavili-Tabrizi, Microchim. Acta 141 (2003) 201.
- V.A. Lemos, M.S. Santos, M.J.S. Santos, D.R. Vieira, C.G. Novaes Microchim. Acta 157 (2007) 215.

This work is licensed under a Creative Commons Attribution 4.0 International License.
![]()
A New Edition of Web of Science
Journal Impact Factor
2022: 0.5
Five Year: 0.8
Journal is Indexed in

Cabells Whitelist
![]()


