Visible Spectrophotometric Methods for Quantitative Determination of Doxofylline using Iodine and α, α'-Bipyridyl as Reagents
A. V. V. N. K. Sunil Kumar1*, S. Vijaya Saradhi2, C. Bala Sekaran3, and T. V. Reddy4
1Department of Chemistry, N. R. I. College, Vijayawada - 520 010 India. 2Department of Biotechnology, K L University, Vaddeswaram, Guntur - 522 502 India. 3Department of Biotechnology, J. K. C. College, Guntur - 522 006. 4Department of Chemistry, P B Siddhartha College of Arts and Sciences, Vijayawada - 520 010 India.
Doxofylline is a phosphodiesterase inhibitor used in the treatment of bronchial asthma, chronic obstructive pulmonary disease and chronic bronchitis. In this study two simple, sensitive, precise and accurate visible spectrophotometric methods (A and B) have been developed for the determination of doxofylline in bulk and in its dosage forms. Method A is based on the formation of yellow colored charge transfer complex between doxofylline as n-donor and iodine as σ-acceptor. Method B is based on the reaction of doxofylline with iron (III) and subsequent reaction with α, α'-bipyridyl in an acid medium to yield a red colored complex. The colored products are quantitated spectrophotometrically at 395 and 535 nm by methods A and B, respectively. The methods determine the cited drug in concentration ranges of 4-32 (method A) and 2-16 (method B) μg mL-1. The optimum experimental conditions have been studied. The proposed methods were successfully applied to the determination of the doxofylline in pure and dosage forms with good accuracy and precision. The results were compared statistically with those given by the reported method.
KEYWORDS:Doxofylline, Iodine; α; α’ Bipyridyl; Spectrophotometric analysis
Download this article as:| Copy the following to cite this article: Kumar A. V. V. N. K. S, Saradhi S. V, Sekaran C. B, Reddy T. V. Visible Spectrophotometric Methods for Quantitative Determination of Doxofylline using Iodine and Α, Α’-Bipyridyl as Reagents. Orient J Chem 2011;27(2). |
| Copy the following to cite this URL: Kumar A. V. V. N. K. S, Saradhi S. V, Sekaran C. B, Reddy T. V. Visible Spectrophotometric Methods for Quantitative Determination of Doxofylline using Iodine and Α, Α’-Bipyridyl as Reagents. Orient J Chem 2011;27(2). Available from: http://www.orientjchem.org/?p=25019 |
Introduction
Doxofylline (DFL)1-5, chemically known as 7-(1, 3-dioxolan-2-ylmethyl)-1, 3-dimethylpurine-2, 6-dione (Figure 1), is a novel bronchodilator xanthine derivative drug used in the treatment of bronchial asthma, chronic obstructive pulmonary disease (COPD) and chronic bronchitis. Animal and human studies has shown similar efficacy to theophylline but with significantly less side effects6. DFL differs from theophylline for the presence of a dioxalane group in position 7. DFL acts as a phosphodiesterase inhibitor and have decreased affinities toward adenosine A1 and A2 receptors which may account for the better safety profile of the drug7, 8. The safety profile shows a better tolerability on cardiovascular, digestive and the central nervous systems9. DFL was found to be particularly effective in both decreasing the daily asthma attack rate as well as the beta-2- agonist consumption.
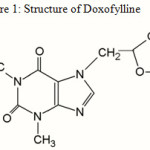 |
Figure 1: Structure of Doxofylline |
The determination of DFL in pharmaceutical preparations is very important for medical and pharmaceutical needs where it is used for the treatment of bronchial asthma, chronic obstructive pulmonary disease and chronic bronchitis. Several types of analytical procedures have been proposed for the analysis of DFL in bulk, pharmaceutical formulations and biological fluids. These procedures include HPLC10-13, Stability indicating RP-HPLC chromatography14, LC-MS/MS15, stability indicating HPTLC16. Although the above methods have adequate sensitivity to assay DFL, but require relatively expensive reagents, time-consuming and require expertise. Visible spectrophotometry is considered the most widely used technique, because of its inherent simplicity, low cost and wide availability in most quality control laboratories. Therefore, they are a frequent choice for pharmaceutical analyses. Kamila et al., 17 and Joshi et al., 10 have reported UV spectrophotometric method for the quantification of DFL in pharmaceutical formulations. The literature is still poor in visible spectrophotometric methods for the determination of DFL in dosage forms.
This paper describes two visible spectrophotometric methods for the assay of DFL in pure and dosage forms. Method A is based on charge transfer complexation between the drug as n-electron donor and iodine acid as σ -acceptor. Method B is based on the oxidation of the drug with Fe3+ and the estimation of Fe2+ produced after complexation with α, α’ bipyridyl. The proposed methods are optimized and validated as per the International conference on Harmonization guidelines18.
Experimental
Instrumentation
Spectral runs were made on ELICO double beam model SL 159 digital spectrophotometer with 1-cm matched quartz cells.
Materials and reagents
All chemicals used were of analytical reagent grade and all solutions were freshly prepared in doubly distilled water.
0.2% iodine in chloroform: Prepared by dissolving 200 mg of iodine (Sdfine-Chem limited, Mumbai) in 100 mL chloroform (Merck, Mumbai).
0.15% α, α’ Bipyridyl: Prepared by dissolving 150 mg of α, α’ Bipyridyl (Merck, Mumbai) in 100 mL of distilled water
0.27% Ferric chloride: Prepared by dissolving 270 mg of Ferric chloride (Sdfine-Chem limited, Mumbai) in 100 mL of distilled water.
0.2M ortho phosphoric acid: Prepared by diluting 8.5 mL of ortho phosphoric acid (Merck, Mumbai) to 100 mL with doubly distilled water.
Pharmaceutical grade DFL was kindly gifted by local pharmaceutical industry.
Tablet dosage forms of DFL such as Doxobid (400 mg, Reddy’s Lab, Hyderabad), Synasma (400 mg, Ranbaxy, Mumbai), Doxfree (400 mg, Maceleods pharmaceuticals, Mumbai) were purchased from local market.
Preparation of stock and working standard drug solutions
A stock standard solution containing 1 mg mL-1 of DFL was prepared in chloroform for method A and in water for method B. Working standard solution equivalent to 200 μg mL-1 and 100 μg mL-1 of DFL was obtained by appropriate dilution of stock solution by chloroform and water for methods A and B, respectively.
Recommended procedure
Method A
Into a series of 10 mL flasks, different volumes (0.2-1.6 mL) of DFL (200 μg mL-1) were pipetted. 2 mL of 0.2 % iodine was added in each flask at room temperature (25±1 °C) and diluted up to the mark with chloroform. The absorbance was measured after 15 min at 390 nm against the reagent blank prepared similarly omitting the drug. The concentration of DFL was calculated either from calibration curve or from regression equation.
Method B
Into a series of boiling test tubes, different volumes (0.2-1.6 mL) of DFL (100 μg mL-1) were pipetted. To each test tube, 1.5 mL of 0.27 %FeCl3, 1 mL of 0.15 % α, α’ bipyridyl and 1 mL of 0.2 M orthophosphoric acid were added, mixed well, and heated on a water bath at 65°C for 15 minutes. The tubes were cooled at room temperature, and then the contents of the tubes were transferred to 10 mL volumetric flasks and diluted to volume with doubly distilled water. The absorbance was measured at 535 nm against a reagent blank treated similarly except without drug. The concentration of DFL was calculated either from calibration curve or from regression equation.
Procedure for the analysis of DFL in tablet dosage forms
Ten tablets were weighed accurately and ground into a fine powder. An amount of powder equivalent to 100 mg of DFL was weighed into a 100 mL volumetric flask, 50 mL of the chloroform (method A) or water (method B) was added and shaken thoroughly for about 10 min, then the volume was diluted up to the mark with the same solvents, mixed well and filtered using a quantitative filter paper. The filtered solution was further diluted with the respective solvents according to the need and then analyzed following the proposed procedures.
Results and Discussion
Mechanism of the reaction
The results obtained in method A were due to the charge transfer reaction between the DFL and iodine to yield a yellow colored Tri-iodide ion pair having maximum absorption at a wavelength of 390 nm against the corresponding reagent blank. Iodine is an σ-electron acceptor. The DFL has tertiary amino group, which act as n-electron donor. Therefore, the DFL react with electron acceptor to form charge transfer complex. Formation of the tri-iodide ion in solution is most probably due to a transformation of the initially formed outer complex into an inner electron donor accepter complex followed by a reaction of the resulting inner complex with iodine to form a triiodide ion. The colored complex was stable for about 1.5 hrs. A general reaction mechanism is proposed in figure 2.
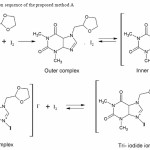 |
Figure 2: Probable reaction sequence of the proposed method A Click here to View figure |
The proposed method B was based on oxidation of DFL by Fe3+ in FeCl3. The resulting Fe2+ complexeswith unshared pair of electrons on each of the two nitrogen atoms of α, α’ bipyridyl to produce colored chromogen having maximum absorption at 535 nm against the corresponding reagent blank. Fe3+ interferes to a little extent (especially in the lower range of Beer’s law limits) in the determination of Fe2+ by method B. The reactivity of the interfering entity (Fe3+) has made insignificant by complexing it with orthophosphoric acid. The colored complex was stable for about 2 hrs. The probable reaction mechanism is proposed in figure 3.
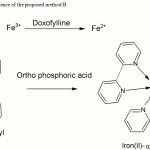 |
Figure 3: Probable reaction sequence of the proposed method B |
Optimization of experimental variables
The optimization of proposed methods is commonly accomplished by sequentially optimizing one variable at a time while keeping all other variables constant. In this work, the influence of experimental variables on the absorbance of colored product was studied to obtain the optimum conditions for assay procedures. The conditions so obtained were incorporated in Table 1 and 2. The optimum values of the variables were maintained throughout the determination process.
Table 1: Optimization of experimental variables for method A
| Parameter
|
Investigation conditions | Conditions in procedure | Remarks
|
| λmax (nm) | 350 – 600 | 390 | |
|
Effect of solvent
|
Acetonitrile, Dichloromethane, Chloroform and Dioxane | Chloroform
|
The chloroform was selected as the best for the iodine charge-transfer complex formation as it produces maximum sensitivity and product stability. |
| Volume of 0.2% Iodine (mL) | 0.2 – 3.6
|
2
|
2 mL of 0.2% iodine gave the maximum absorbance and remained constant by further addition of iodine. |
|
Effect of reaction time (min)
|
0-45
|
15
|
15 min of reaction time was required for maximum color intensity. Further increase in the reaction time does not cause any change in intensity of color. |
Table 2: Optimization of experimental variables for method B
| Parameter
|
Investigation conditions | Conditions in procedure | Remarks
|
| λmax (nm) | 400 – 700 | 535 | |
|
Volume of 0.27% FeCl3 (mL)
|
0.5 – 3.1
|
1.5
|
1.5 mL of FeCl3 was sufficient to produce maximum color. Beyond this volume the intensity of the color remains constant. |
| Volume of 0.15% α, α’ Bipyridyl (mL)
|
0.5 – 2.5
|
1
|
For optimum color development 1mL of α, α’ Bipyridyl is required. Beyond 1mL there is no change in the intensity of color. |
| Volume of 0.2 M orthophosphoric acid (mL)
|
0.5 – 5
|
1.0
|
1 mL of OPA was sufficient to complex with the interfering Fe3+ remaining in the solution after reaction was completed. |
| Effect of Temperature (0 C)
|
30 – 80
|
65
|
From 300C, the color intensity was increased upto 650C. Raising the temperature above 650C, color intensity and the absorbance started to decrease. Hence 650C was selected. |
|
Effect of heating time (min)
|
5 – 30
|
15
|
15 min of heating time was required for maximum color intensity. Further increase in the heating time does not cause any change in intensity of color. |
Method Validation
Method validation includes all of the procedures required to demonstrate that a method to quantify the concentration of MSZ is reliable for the intended application.
In order to test whether the colored species formed in the above methods adhere to Beer’s law, the absorbance’s of a set of solutions containing varying amounts of DFL and specified amounts of reagents (as given in the recommended procedures) were recorded at appropriate wavelengths against the corresponding reagent blank. Beer’s law limits, molar absorptivity and Sandell’s sensitivity for DFL in each method developed with mentioned reagents were calculated. Least square regression analysis was carried out for getting the slope, intercept and the correlation coefficient values. The results were summarized in the Table 3.
Table 3: Spectral and Statistical Data for the Determination of DFL by the proposed methods
| Parameters | Method A | Method B |
| λmax (nm) | 390 | 535 |
| Beer’s Limit (µg mL-1 ) | 4-32 | 2-16 |
| Molar Absorbtivity (L/ mole/ cm) | 8.012 x10³ | 1.812 x10⁴ |
| Sandell’s sensitivity
(µg cm-2/0.001 Absorbance unit) |
0.0333 | 0.0327 |
| Stability of colored products (hrs) | 1.5 | 2.0 |
| Regression equation (Y= mx + c)$$ | ||
| Slope (m) | 0.0301 | 0.0300 |
| Intercept (c) | -0.0008 | 0.0017 |
| Correlation coefficient (r) | 0.9999 | 0.9993 |
| LOD (µg mL-1) | 0.138 | 0.101 |
| LOQ (µg mL-1) | 0.418 | 0.306 |
| Standard deviation$ | 0.00126 | 0.00184 |
| Relative standard deviation (%) | 1.041 | 1.520 |
| %Range of error
(Confidence Limits) |
||
| 0.05 level | 0.870 | 1.270 |
| 0.01 level | 1.287 | 1.880 |
The limit of detection (concentration of drug corresponding to a signal equal to the blank mean plus three times the standard deviation of the blank) and limit of quantification (concentration of drug corresponding to the blank mean plus ten times the standard deviation of the blank) were calculated according to the current ICH guidelines18 and the results are presented in Table 3.
The intraday precision and accuracy of the proposed method was examined by carrying out six replicate determinations of fixed concentration of DFL (within Beer’s law range) by the proposed methods. The standard deviation, relative standard deviation and percentage of error were calculated for the proposed methods and were found to be acceptable (Table 3). The results shown that the proposed methods are effective for the determination of DFL.
The accuracy of the proposed methods was further evaluated by performing recovery studies by standard addition technique. The recovery studies were carried out by adding 10 mg of bulk sample of DFL to the pre-analyzed formulation and the mixture were analyzed by the proposed methods. The results of this study (Table 4) indicate that neither the accuracy nor the precision of the methods is not affected by the coformulated substances.
Table 4: Standard addition method for the determination of DFL in tablet dosage forms
|
Method |
Brand name of tablet |
Labeled claim (mg) |
Pure drug added (mg) |
Found ± S.D (n=5) |
Recovery (%) |
RSD |
|
A |
Doxobid | 400 | 10 | 410.05±0.348 | 100.01 | 0.848 |
| Synasma | 400 | 10 | 408.95±0.856 | 99.74 | 0.209 | |
| Doxfree | 400 | 10 | 409.75±0.728 | 99.93 | 0.177 | |
|
B |
Doxobid | 400 | 10 | 410.39±0.536 | 100.09 | 0.130 |
| Synasma | 400 | 10 | 411.54±0.485 | 100.37 | 0.117 | |
| Doxfree | 400 | 10 | 411.09±0.658 | 100.26 | 0.160 |
Application of the proposed methods for tablet dosage forms
The proposed methods were successfully applied to the analysis of different dosage forms containing DFL. The results obtained by the proposed methods are compared statistically with the reference method10. The t-test and F-test were carried out, which showed that the proposed methods and official method are of comparable accuracy and precision. The results are summarized in Table 5.
Conclusion
Doxofylline was quantified successfully in bulk and tablet formulations by the two inexpensive, simple, sensitive, accurate and precise visible spectrophotometric methods that were developed. The proposed methods do not require any sophisticated equipment, pretreatment of the drug and tedious extraction procedure prior to its analysis. The sample recoveries in tablet dosage forms were in good agreement with their respective label claims and they suggested non-interference of formulation excipients in the estimation. Hence, these methods can be easily and conveniently adopted for routine analysis of doxofyline in pharmaceutical industries, hospitals and research laboratories.
Acknowledgements
The authors express their gratitude to the management P.B. Siddhartha College of Arts and Science, Vijayawada, Andhra Pradesh for providing research facilities.
References
- Cirillo R., Barone D. and Franzone J. S., Arch. Int. Pharmacodyn. Ther., 295, 221 (1988).
- Poggi R., Brandolese R., Bernasconi M., Manzin E. and Rossi A., Chest, 96, 772 (1989).
- Dini F. L. and Cogo R., Curr. Med. Res. Opin., 16, 258 (2001).
- Sankar J., Lodha R. and Kabra S. K., Indian J. Pediatr., 75, 251 (2008).
- Dali S., Subhashis C., Sanjay Singh. and Brahmeshwar M., Expert O
pin. Pharmaco., 10, 2343 (2009). - Goldstein M. F. and Chervinsky P., Med. Sci. Monit., 8, CR297 (2002).
- Dini F. L., Frank L.D. and Roberto C., Curr. Med. Res. Opinion., 16, 258 (2000).
- Melillo G., Balzano G., Jodice F., De F. A., Campisi V., Capone M., Di F. A., Foddai G., Franzone J. S. and Grossi E., Int. J. Clin. Pharm. Res., 9, 397 (1989).
- Franzone J. S., Cirillo R. and Biffignandi P., Eur. J. Pharmacol., 165, 269 (1989).
- Joshi H. R., Patel A. H. and Captain A. D., J. Young Pharm., 2, 289 (2010).
- Tagliaro F., Dorizzi R., Frigerio A. and Marigo M., Clin. Chem., 36, 113 (1990).
- Ashu M. and Shikha P., J. Anal. Chem., 65, 293 (2010).
- Gannu R., Bandari S., Sudke S. G., Rao Y. M. and; Shankar, B. P. Acta Chromat., 19, 149 (2007)
- Sreenivas N., Narasu, M. L., Shankar, B. P. and; Mullangi, R., Biomed. Chromatogr., 22, 654(2008)
- Kamila M. M., Mondal N. and Ghosh L. K., Indian J. Chem. Tech., 14, 523 (2007).
- Validation of Analytical Procedures; Methodology, International Conference on Harmonization (ICH): Text and Methodology Q2 (R 1): Complementary Guideline on Methodology dated 06 November 1996: incorporated in November 2005, London.
- LaganaM. B., Marino A. and Mancini M., Biomed. Chromatogr., 4, 205 (1990).
- Narendra G. P., Sathiyanarayanan L., Mahadeo V. M., and Sunil R. D., J. Planar Chromatogr. – Mod. TLC., 22, 345(2009).

This work is licensed under a Creative Commons Attribution 4.0 International License.
![]()
A New Edition of Web of Science
Journal Impact Factor
2022: 0.5
Five Year: 0.8
Journal is Indexed in

Cabells Whitelist
![]()


