Prediction of SO2 Transport Across Ceramic Membranes using Finite Element Method (FEM)
Saeed Shirazian1, Azam Marjani1* and Fatemeh Azizmohammadi2
1Department of Chemistry, Science Faculty, Islamic Azad University, Arak Branch, Arak Iran. 2Department of English, Humaniti Faculty, Islamic Azad University, Arak Branch, Arak Iran.
In the present paper, synthesis and investigation of the rheological behavior of a graft copolymer based on Pectin (Pec) and polyacrylonitrile (PAN) was carried out . The physical mixture of Pec and PAN was hydrolyzed by NaOH solution to yield Pec-poly(sodium acrylate-co-acrylamide) superabsorbent hydrogel. The nitrile groups of PAN were completely converted to a mixture of hydrophilic carboxamide and carboxylate groups during alkaline hydrolysis followed by in situ crosslinking of the PAN chains by the alkoxide ions of Pectin. A proposed mechanism for hydrogel formation was suggested and the hydrogel structures were confirmed by FTIR spectroscopy, SEM and porosimeter. The rheological behavior of the prepared gels were measured with rheometer.
KEYWORDS:Pectin; polyacrylonitrile; hydrogel; chemorheoloy; rheology
Download this article as:| Copy the following to cite this article: Shirazian S, Marjani A, Azizmohammadi F. Prediction of SO2 Transport Across Ceramic Membranes using Finite Element Method (FEM). Orient J Chem 2011;27(2). |
| Copy the following to cite this URL: Shirazian S, Marjani A, Azizmohammadi F. Prediction of SO2 Transport Across Ceramic Membranes using Finite Element Method (FEM). Orient J Chem 2011;27(2). Available from: http://www.orientjchem.org/?p=24816 |
Introduction
Nowadays, capture of greenhouse gases is a subject of great interest in research community. Greenhouse gases have adverse effects on human life and health. Among adverse gases, sulfur dioxide (SO2) has been known as a highly reactive gas. This gasis emitted mostly from fossil fuel combustion at power plants (73%) and other industrial facilities (20%). Other sources of SO2 emissions are industrial processes such as extracting metal from ore, and the burning of high sulfur containing fuels. SO2 has a number of adverse effects on human health [1].
Capture of SO2 by selective absorption into a solvent is a common method to reduce the amount of SO2. The current sulfur dioxide (SO2) separation processes are based on physical and chemical processes. The separation of SO2 through ordinary processes experiences a number of shortcomings such as channeling, flooding, entraining, foaming, and also high capital and operating costs [2-5]. Some studies have been conducted to evaluate the possibilities of enhancing the efficiency of the latter processes to overcome the problems. New recently, the gas-liquid membrane contactors as gas absorption devices have become a subject of interest. In these devices, the membrane contactor acts as a physical barrier between the two phases, i.e. gas and liquid.
Extensive researches about the gas-liquid membrane contactors have been conducted since Qi and Cussler first studied these contactors [6]. They used a hollow-fiber membrane contactor for absorption of CO2. After that, Kreulen et al. [7] investigated the chemical absorption of CO2 into water/glycerol liquid mixtures as absorbent. All studies have been conducted on CO2 absorption in polymeric membrane contactors. A few studies have been done on ceramic membrane contactors. In industrial applications, harsh feed conditions or high temperature operations precludes the use of polymeric membranes. The main advantage of ceramic membranes compared with polymeric membranes is the thermal and chemical resistance of the ceramic membranes which makes these membranes favorable for industrial applications. Recently a few experimental studies have been carried out for SO2 absorption [8-9]. Luis et al. [8-9] studied absorption of SO2 in N,N-dimethylaniline as absorbent using alumina membrane contactor. The studies have focused on experiments and there is shortage of a comprehensive model for prediction of gas transport through ceramic membrane contactors [10].
The main objective of the present study is to develop and solve a 2-dimensional mathematical model to predict the SO2 absorption through a tubular ceramic membrane contactor.
Theory
Mass transfer model
The mass transfer model is developed for a tubular membrane, as shown in Fig. 1. The liquid absorbent flows with a laminar velocity in the tube and the gas mixture containing SO2 and air flows counter currently through the shell side. So, the membrane contactor consists of three sections: tube side, membrane, and shell side. The steady state two-dimensional material balances are carried out for all three sections of the contactor.
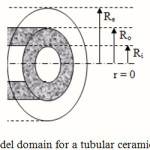 |
Figure 1: Model domain for a tubular ceramic membrane. |
The dimension of the free surface can be estimated by Happel’s free surface model [11]:

φ is the volume fraction of the void. It can be calculated as follows [11]:
![]()
where is the number of membranes and is the module inner radius.
The continuity equation for steady state for SO2 transport in the shell side of the membrane contactor is obtained using Fick’s law of diffusion for estimation of diffusive flux [12]:
![]()
In a laminar flow, Navier-Stokes equations can be applied for the shell side [12]:
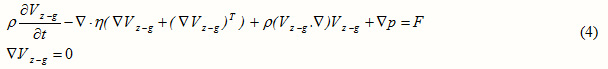
where , , and denote the velocity vector, pressure, density of the fluid, and the dynamic viscosity, respectively.
For the tube side, mass transfer equation (continuity equation) is:
![]()
The velocity distribution in the tube side is assumed to follow Newtonian laminar flow [12]:

The steady-state continuity equation for the transport of SO2 inside the membrane, which is considered to be due to diffusion alone, may be written as:
![]()
When the membrane is filled with gas phase (non-wetted mode), there are three mass transfer resistances for transport of SO2 from gas phase to the liquid phase. These mass transfer resistances include transfer of sulfur dioxide from the bulk gas to the membrane wall; diffusion across the pores of the membrane to the membrane–absorbent interface; and dissolution into the liquid, where a chemical/physical change takes place.
Physical properties and numerical solution of the equations
The dimensions of the membrane contactor used for the numerical simulation are the same as those in Ref. 9. The density and the viscosity data for gas phase are those of air because of low concentration of sulfur dioxide in the gas mixture. The inlet concentration of SO2 in the gas phase for all cases is 5 vol%. The model equations related to the tube side, membrane, and shell side with the appropriate boundary conditions were solved using COMSOL Multiphysics software, which uses finite element method (FEM) for numerical solution of differential equations. The finite element analysis is combined with adaptive meshing and error control using stationary nonlinear numerical solver.
Results and discussion
Concentration distribution of SO2 across the membrane
Figure 2 illustrates the distribution of SO2 concentration inside the ceramic membrane. The ceramic membrane used in the simulations is porous and is the most important part of the membrane contactor. The ceramic membranes for gas separation are very tortuous and can provide high concentration difference across the membrane. As the SO2 flows through the shell side, it is transferred towards the membrane pores due to the concentration gradient. Significant concentration change across the ceramic membrane shows that the main concentration change occurs in the membrane side, i.e. main mass transfer resistance is located in this part. It is due to high tortuosity of the applied membrane which provides a long path for transport of SO2 through the membrane pores.
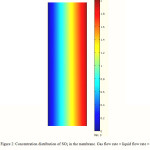 |
Figure 2: Concentration distribution of SO2 in the membrane. Gas flow rate = liquid flow rate = 1 L/min, T = 290K, Inlet SO2 volume fraction = 5%. |
SO2 concentration distribution in the liquid phase
Figure 3 indicates surface distribution of SO2 concentration in the liquid phase. The concentration distribution is calculated through the developed model in the tube side of the membrane contactor where the liquid absorbent flows. The gas phase flows from one side of the membrane contactor where the concentration of SO2 is the highest, whereas the absorbent flows from the other side where the concentration of SO2 is assumed to be zero. At the membrane-liquid phase interface, the absorbed SO2 is transferred through the boundary layer of liquid phase. The formation of boundary layer near the membrane can be observed from Figure 3 clearly. In the regions near the membrane surface, concentration gradient is great. High mass transfer flux occurs in these regions of tube because of higher driving force.
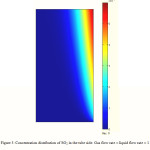 |
Figure 3: Concentration distribution of SO2 in the tube side. Gas flow rate = liquid flow rate = 1 L/min, T = 290K, Inlet SO2 volume fraction = 5%. |
Influence of liquid flow rate on SO2 concentration profile in the liquid phase
Radial concentration profile of SO2 in the tube side is shown in Figure 4. At the zones near the tube center (r = 0), SO2 concentration is zero. The concentration changes occur in the vicinity of the membrane wall. Figure 4 also indicates the effect of liquid phase flow rate on the concentration profile of SO2. It is deduced that increasing liquid velocity, would make the concentration profile more flat in the liquid phase. By increasing liquid flow rate, the contribution of convective mass transfer to the total mass transfer increases and causes more uniform concentration profile. In fact, convective mass transfer tends to transfer the SO2 toward the outlet of the membrane contactor.
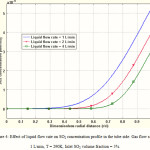 |
Figure 4: Effect of liquid flow rate on SO2 concentration profile in the tube side. Gas flow rate = 1 L/min, T = 290K, Inlet SO2 volume fraction = 5%. |
Effect of gas velocity on the SO2 removal
The percentage removal of SO2 in the gas phase for different values of gas flow rates is presented in Figure 5. As expected, the increase in the gas flow rate reduces the residence time of gas phase in the membrane contactor, which in turn reduces the removal rate of SO2 in the contactor. The percentage removal of SO2 decreases from 52% to 23% when the gas flow rate in the membrane contactor changes from 0.1 L/min to 0.6 L/min. Figure 5 Also reveals that gas flow rate greatly affect the SO2 removal in the membrane contactor.
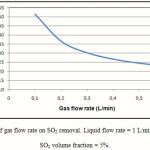 |
Figure 5: Effect of gas flow rate on SO2 removal. Liquid flow rate = 1 L/min, T = 290K, Inlet SO2 volume fraction = 5%. |
Mass transfer flux distribution along the liquid phase
Mass transfer flux distribution of SO2 in the liquid phase of the membrane contactor is illustrated in Figure 6. Both diffusive and convective fluxes for SO2 mass transfer in the tube side are shown in Figure 6 to demonstrate the contribution of axial diffusion in the simulation. As observed, contribution of convective flux in the z-direction is predominant compared to axial diffusive flux. That is due to the fact that in the axial direction, the velocity is significant and causes high convective flux for solute transport.
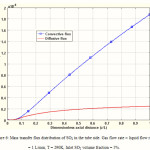 |
Figure 6: Mass transfer flux distribution of SO2 in the tube side. Gas flow rate = liquid flow rate = 1 L/min, T = 290K, Inlet SO2 volume fraction = 5%. |
Conclusions
Separation of sulfur dioxide (SO2) using ceramic tubular membrane contactors was studied in this work. A mass transfer model was developed to describe the transport of SO2 through the membrane contactor. The model was based on solving the conservation equations for SO2 in three sections of the contactor, i.e. shell, membrane, and tube. CFD was employed to solve the model equations. Effect of the operating parameters including liquid and gas flow rates on the removal of SO2 was investigated. The simulation results indicated that the removal of SO2 increased with either increasing the liquid velocity or decreasing the gas velocity in the membrane contactor. The model predictions also reveal that the main mass transfer resistances for transport of SO2 are located in the membrane and gas phase. Ceramic membrane has the highest resistance because of its high tortuosity.
Nomenclature
C concentration (mol/m3)
C0 SO2 concentration at the inlet of shell side (mol/m3)
CSO2-m SO2 concentration in the membrane (mol/m3)
CSO2-g SO2 concentration in the shell (mol/m3)
CSO2-L SO2 concentration in the tube (mol/m3)
Cout SO2 concentration in the gas phase at the outlet (mol/m3)
D diffusion coefficient (m2/s)
n number of membrane
p pressure (Pa)
Õg gas flow rate in the contactor (m3/s)
Õl liquid flow rate in the contactor (m3/s)
R Module radius (m)
r radial coordinate (m)
Ri inner tube radius (m)
Ro outer tube radius (m)
Re inner shell radius (m)
T Temperature (K)
V average velocity (m/s)
z axial distance (m)
References
- Müller, H., 2005. Sulfur dioxide, in: Ullmann’s Encyclopedia of Industrial Chemistry. Wiley-VCH Verlag GmbH & Co.:Weinheim.
- Bekassy-Molnar, E., E. Marki and J.G. Majeed, 2005. Sulphur dioxide absorption in air-lift tube absorbers by sodium citrate buffer solution. Chemical Engineering and Processing, 44: 1039–1046.
- VanDam, M.H.H., A.S. Lamine, D. Roizard, P. Lochon and C. Roizard, 1997. Selective sulphur dioxide removal using organic solvents. Industrial and Engineering Chemistry Research, 36: 4628–4837.
- Dutta, B.K., M. Shyamal and R.K. Basu, 1996. Absorption of sulfur dioxide in aqueous dispersions of dimethyl aniline. Canadian Journal of Chemical Engineering, 74: 339–346.
- Gabelman, A., S.T Hwang, 1999. Hollow fiber membrane contactors. Journal of Membrane Science, 159: 61–106.
- Qi, Z. and E.L. Cussler, 1985. Microporous hollow fibers for gas absorption. Journal of Membrane Science, 23: 321–345.
- Kreulen, H., C.A. Smolders, G.F. Versteeg and W.P.M. Van Swaaij, 1993. Microporous hollow fiber membrane modules. Industrial and Engineering Chemistry Research, 32: 674–684.
- Luis, P., A. Garea, A. Irabien, 2010. Modelling of a hollow fibre ceramic contactor for SO2 absorption. Separation and Purification Technology, 72: 174–179.
- Luis, P., A. Garea and A. Irabien, 2009. Zero solvent emission process for sulfur dioxide recovery using a membrane contactor and ionic liquids. Journal of Membrane Science, 330: 80–89.
- Shirazian, S., A. Moghadassi, S. Moradi, 2009. Numerical simulation of mass transfer in gas-liquid hollow fiber membrane contactors for laminar flow conditions. Simulation Modelling Practice and Theory, 17: 708-718.
- Happel, J., 1959. Viscous flow relative to arrays of cylinders. AIChE Journal, 5: 174–177.
- Bird, R.B., W.E. Stewart and E.N. Lightfoot, 2002. Transport Phenomena. 2nd edition, John Wiley & Sons: New York.

This work is licensed under a Creative Commons Attribution 4.0 International License.
![]()
A New Edition of Web of Science
Journal Impact Factor
2022: 0.5
Five Year: 0.8
Journal is Indexed in

Cabells Whitelist
![]()


