Physico-chemical Characteristics and Dissolved Trace Metals in the Pahang River Estuary, Malaysia
B. Y. Kamaruzzamanp*, A. Sitiwaznah and M. Y. Nurulna
Institute of Oceanography and Maritime Studies, International Islamic University Malaysia, 25200 Kuantan, Pahang (Malaysia).
Water samples from Pahang River estuary were analysed for Cu, Pb, Zn and Cd at 63 stations during the monson and non-monsoon seasons. Concentrations ranges of dissolved metals in the Chukai estuary were relatively low compared with other estuaries and are not significantly influenced by seasonal changes. Concentration of Cu in both monsoons ranged from 0.57 – 1.01 μgl-1, Pb ranged 0.88 – 1.34 μgl-1, Zn ranged from 9.96 – 12.8 μgl-1 and Cd ranged from 0.09 – 0.18 μgl-1. On the whole, trace metal concentrations in the dissolved metals behave conservatively and are mostly controlled by the natural processes. The estuary remained marine dominated during non-monson seasons, whereas freshwater dominance prevailed during monsoon seasons. The temperatures of surface and bottom waters are almost uniform or even identical at times while pH has an inverse relationship with salinity.
KEYWORDS:Trace Metals; Pahang River estuary; salinity; temperature; pH
Download this article as:| Copy the following to cite this article: Kamaruzzamanp B. Y, Sitiwaznah A, Nurulna M. Y. Physico-chemical Characteristics and Dissolved Trace Metals in the Pahang River Estuary, Malaysia. Orient J Chem 2011;27(2). |
| Copy the following to cite this URL: Kamaruzzamanp B. Y, Sitiwaznah A, Nurulna M. Y. Physico-chemical Characteristics and Dissolved Trace Metals in the Pahang River Estuary, Malaysia. Available from: http://www.orientjchem.org/?p=11675 |
Introduction
Estuarine areas where freshwater encounters seawater are characterized by a lateral variation in salinity, and can represent a transfer box for the sediments between land and the open ocean (Meade, 1972; Burton, 1988). They are very active areas where a huge amount of organic matter and trace metals are introduced into the ocean system through river runoff, in situ primary production and anthropogenic impacts. The behaviour of heavy metals as they pass through estuaries on their way to the ocean is of great interest and concern. Much evidence supports the key role estuaries play as biogeochemical barriers to toxic heavy metals. Although considerable information exists on some of the processes involved (Danielson et al., 1990; Windom et al., 1985), the need for additional data on the behaviour of pollutants in estuaries cannot be overstated. Concentrations of trace metals in estuaries can be elevated due to high inputs from natural and anthropogenic sources. In recent years, the PahangRiver has been heavily impacted by discharges from municipal and industrial outflows. This is due to the rapid development of the area via expansion of the industrialization area as well as the increase in population. Steel and petro-chemicals and automotives are the main industry activities in the area and are the catalyst for other supportive industries to develop around the same area. Very little work has been carried out on the determination of trace metal contents of rivers of Malaysia. The concentration of toxic metals are of interest as most of these rivers are used for the extraction of drinking water as well as their harmful effect to aquatic life at relatively high concentrations. The development of industrialisation and the greater utilisation of land for agriculture may undermine drinking water quality. As there is little published information on the levels of trace metals in riverine sytems of Malaysia, the purpose of this study was to measure the background levels of Cd, Cu, Pb and Zn in a relatively clean river in a rural area.
Materials and Methods
Sampling Sites
The study site area is located in the Pekan district which is about 50 km south of Kuantan, the capital state of Pahang (Fig. 1). This area has a humid tropical climate with Southwest and Northeast monsoons bringing an annual rainfall which varies between 1488 mm to 3071 mm. A total of 62 surface and bottom water samples were collected in this study. Stations 1 to 5 in the estuary represent the most seaward while station 52 to 63 inside the Pahang River, represent the landward most less saline water point. The samples were collected using the mercos water sampler and 1 liter of sample was collected at each station and was transferred into an acid cleaned polyethylene bottles. Sampling was done during high tides, twice during the dry season (July 2008 and May 2009) and twice during the rainy season (September 2008 and February 2009). Water samples were then acidified to pH 2, with HNO3 (Suprapure), stored at 4oC until treatment and analysis were performed. In the laboratory, all samples were pressure filtered through a pre-weighed, acid rinsed 0.45 μm nucleopore polycarbonate filter, located in a clean air cabinet. Filtrates were transferred into a acid-rinsed polyethylene bottles and acidified to pH 2, using HNO3, prior to trace element analysis. In this study seasonal changes in physico-chemical parameters of water were also monitored. The physical parameters (salinity, temperature and pH) for both the surface and bottom layers were obtained in situ by using the hydroLab. HydroLab were calibrated according to standard procedures before any data measurements were made in the field.
Analyses of metals were performed in a clean air cabinet (Class 100). Dissolved Cu, Pb, Zn and Cd were extracted using an ammonium pyrolidine dithiocarbamate/methyl isobuthyl ketone (APDC/MIBK) extraction into freon, and analysed by graphite furnace atomic absorption spectrophotometry (GFAAS) accordind to methods described by Danielsson et al (1982). The validity of the analytical techniques was assessed by analysis of blank and the standard reference materials SLRS-1 (Seawater and Riverine Water Reference Material for Trace Metals, supplied by the National Research Council of Canada). The contents of each element matched the certified values within 5% and the recoveries were obtained typically between 5 – 10%.
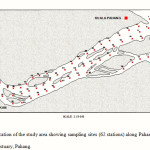 |
Figure 1: Location of the study area showing sampling sites (62 stations) along Pahang River- Estuary, Pahang |
Results and Discussion
Little information is available on the physico-chemical aspects of the PahangRiver estuary. As for the tropical estuaries, their environmental characteristics are much influenced by tidal rhythm and monsoon cycle. The characteristic features of the PahangRiver estuarine system are follow closely the pattern of river runoff and tidal variations and were mostly controlled by the monsoon seasons. According to the twenty years (1968 to 1987) accumulated data obtained from the Malaysian Meteorological Service, the monsoon seasons with strong winds with mean annual rainfall for 3064 mm occurred from November to January. Meanwhile the non-monsoon seasons with low rainfall occurred during April, May and June.
Salinity –Salinity varies from 0 – 32 ppt during non-monsoon seasons and 0 – 26 ppt during monsoon seasons. Results show that salinity at stn. 31 and upper stations are near the zero threshold throughout the year, signifying the fresh water region. Adopting the index of salt water penetration as 0 ppt, it is evident from Fig. 2a and 2b that the sea water intrusion is effective up to the maximum of 12 km (station 28, 29 and 30) in non-monsoon seasons and 5 km (station 17, 18 and 19) in the monsoon seasons (Fig. 2a and 2b). The relative lower salinity during monsoon seasons is due to dilution activity resulting from freshwater influx and land drainage into the riverine system. However, on many occasion the difference in salinity of surface and bottom layers is quite significant (P<0.05) but the bottom water is more saline than the surface water. The increase in salinity of both surface and bottom layers also indicates a lateral salinity gradient over most parts of the estuary.
Temperature – The temperature of surface and bottom waters are almost uniform or even sometimes they are identical (Fig. 3a and 3b). The magnitude of apparent variation of temperature in the water column is insignificant. There has been a gradual decrease in temperature from the mouth upstreams along the estuarine system reaching the riverine system in both seasoons. The mixed layer depth shoals and resulting detrainment inhibits the incoming surface heat flux from being transported downward and elevating the sea surface temperature (Wang et al, 2000; Wang et al., 2006a). These findings are in general agreement with that of Day (1981), where rivers are usually cooler than the coastal waters in the estuarine system.
pH – A small range of pH changes was encountered in the PahangRiverRiver (Fig.4a and 4b). During non-moonson seasons, pH values were relatively higher in the estuary (pH 7 – 8) due to the influence of seawater penetration and biological activity(Day, 1981), followed by lower pH in the moonson seasons (pH 5 – 6), which may due to the lower primary productivity (Day, 1981). The lower pH during the mooson seasons might also be due to the influence of freshwater influx and decomposition of organic matter (Day, 1981; Wang et al, 2000) carried by flood waters into the riverine system. This phenomenon was also reported by Law and Jong (2006), whereby more acidic pH was observed during pre-monsoon season.
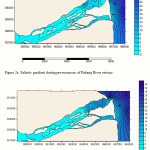 |
Figure 2a: Salinity gradient during pre-monsoon of Pahang River estuary.
2b: Salinity gradient during post-monsoon of Pahang River estuary. |
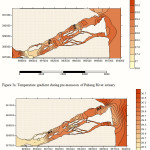 |
Figure 3a: Temperature gradient during pre-monsoon of Pahang River estuary.
Figure 3b: Temperature gradient during post-monsoon of Pahang River estuary. |
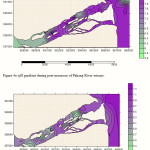 |
Figure 4a: pH gradient during post-monsoon of Pahang River estuary.
Figure 4b: pH gradient during pre-monsoon Pahang River estuary. |
Trace metal concentrations
The trace metals measured in the PahangRiver are summarized in Table 2. In general, neither salinity nor the concentration of Cu, Pb, Zn and Cd in the PahangRiver varied significantly during the seasonal changes. However, relatively lower concentrations during non-monsoon seasons were shown compared to the monsoon seasons. This could be result of successive dilution between two elemental sources of different origin, presumably identified as anthropogenic discharges and watershed flushing. The former would predominate during the non-monsoon seasons, and the latter during the monsoon seasons.
Table 2: Average concentration of dissolved trace metals (μgl-1) along the PahangRiver, showing a relatively lower metal concentrations during non-monsoon seasons.
| Metals | Monsoon seasons | Non-monsoon seasons |
| Copper(Cu) | 1.01 ± 0.13 | 0.57 ± 0.12 |
| Lead (Pb) | 1.34 ± 0.25 | 0.88 ± 0.45 |
| Zinc (Zn) | 12.8 ± 1.65 | 9.96 ± 0.78 |
| Cadmium (Cd) | 0.18 ± 0.04 | 0.09 ± 0.05 |
The lowest concentrations of dissolved metals measured in Pahang River estuary during the monsoon seasons were Cd (0.18 ± 0.04 μgl-1) followed by Cu (1.01 ± 0.13 μgl-1), Pb (1.34 ± 0.25 μgl-1) and Zn (12.8 ± 1.65 μgl-1). For all metals, as expected the lowest levels were found at stations away from the estuary. Furthermore, these stations are isolated from any human activities as it is within the Hulu Pahang Forest Reserve. For non-monsoon seasons, the concentrations of Cu (0.57 ± 0.12 μgl-1) and Cd (0.09 ± 0.05 μgl-1) showed relatively low concentrations, followed by Pb (0.88 ± 0.45 μgl-1) and Zn (9.96 ± 0.78 μgl-1). Some of the highest concentrations obtained in some stations are associated with water of low salinity and they may be attributed to anthropogenic inputs of the industrial area nearby. Meanwhile the lower metal concentrations near the lower estuary may be explained by the mixing of the contaminated runoff from land-based source and relative uncontaminated water from the sea in the mixing zone at the estuary itself. Variations between geographical areas were significant (P<0.05), when compared with some other estuaries. The concentration of dissolved Cu, Pb, Zn and Cd in the Pahang River were relatively higher than Terengganu estuary (Kong, 2001), and are generally lower than those reported by Law and Singh (1986) in the Klang river and Abdullah and Royle (1974) in the Bristol channel (Table 2).
In this study, concentration of dissolved metal of Cu, Pb, Zn and Cd were found to be decreased as the water salinity increased downstream. This trend is similar to many previous studies in other estuaries (Salomons et al. 1981; Zwolsman et al. 1997). In general, concentrations of Cu and Cd during non-monson seasons also show a good correlation (r2 > 0.9) with salinity, meanwhile Cu during monsoon seasons, Pb and Zn during both seasons has a fairly correlation (r2 = 0.7 – 0.8) with salinity (Figure 5). It is well known that these distributions are related primarily to physical mixing of fluvial and marine particulates. The decrease in trace metal content with the increasing salinity simply reflects the increase in the marine component in water (Zwolsman et al. 1997). It might be argued that the decrease in trace metals can also be due to desorption processes, which was demonstrated in the Scheldt estuary for Cd, Cu and Zn (Salomons et al., 1981). However, studies have stated that desorption for other trace metals in estuaries are insignificant (Zwolsman et al., 1997).
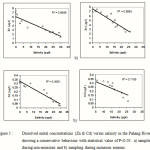 |
Figure 5 : Dissolved metal concentrations (Zn & Cd) versus salinity in the Pahang River showing a conservative behaviour with statistical value of P<0.05. a) sampling during non-monsons and b) sampling during monsoon seasons. |
Table 2: The concentration of dissolved Cu, Pb, Zn and Cd in study area compared to other estuaries
| Metal
Location |
Cu |
Pb |
Zn |
Cd |
| Terengganu River | 0.11 – 1.49 | 1.67 – 12.9 | 1.32 – 9.65 | 0.17 – 0.65
|
| Klang River
|
10 | 4.1 | 17.9 | –
|
| Bristol Channel
|
1.02 – 4.74 | 0.35 – 5.06 | n.a | n.a |
| Pahang River
(This Study)
|
0.57 – 1.01 | 0.88 – 1.34 | 9.96 – 12.8 | 0.09 – 0.18 |
References
- Abdullah M I. and Royle L G. 1974. A study of dissolved and particulate trace elements in the Bristol Channel. J. Marine Biological Assoc. 54, 581 – 597.
- Danielsson L G, Magnusson B, Westerlund S and Zhang K. 1990. Trace metals in Gota river estuary. Estuarine Coastal Mar. Sci. 17, 73 – 85).
- Danielsson L. G., Magnusson B., Westerlund S. and Zhang K. 1982. Trace metal determination in estuarine waters by electrothermal atomic absorption spectrometry after extraction of dithiocarbamate complexs into freon. Analytica Chemica Acta, 144, 183 – 188.
- Kong C Y. 2001. Heavy metals determination in Terengganu estuary. Final Year report, Bachelor Science (Marine Science), Faculty of Applied Science and Technology, Universiti Putra Malaysia Terengganu. 71p.
- Law A T and Singh A.1986. Distribution of Mn, Fe, Cu, Pb and Zn in water and sediment of Klang estuary. Pertanika 9(2), 209 – 217.
- Salomons W, Eysink W D, Kerdijk H N. 1981. Inventarisation and geochemical behaviour of heavy metals in the Scheldt estuary. Report M1640/M1736, Delft Hydraulics, the Netherlands, pp 61.
- Windom H L, Smith R, Maeda M. 1985. The geochemistry of lead in rivers, estuaries and continental shelf of the southestern United States. Mar. Chem 12, 183 – 193.
- Zwolsman J J G, van Eck G T M and van der Weijden. 1997. C. H., Geochemistry of dissolved trace metals (Cd, Cu and Zn) in Scheldt estuary, southwestern Netherlands: impact of seasonal variability. Geochim. Cosmochim Acta 61, 1635 – 1652.
- Burton. J. D. 1988. Riverborne materials and the continent-ocean interface. In: Lerman and Meybeck. M .. (eds.). Physical and Chemical Weathering in Geochemical Cycles. Kluver. Amsterdam 201-225.
- Day, J. H. 1981. Estuarine Ecology (ed.) Balkerna, A. A. and Rotterdam. 58: 23 – 34.
- Meade, R. H. 1972. Transport and deposition of sediments in estuaries. The Geological Society of American Members 133: 91-117.
- Wang, B., Wu, R. and Fu, X., 2000. Pacific-East Asian teleconnection: How does ENSO affect East Asian climate?, J. Clim. 13: pp. 1517–1536.
- Wang, C., Wang, W., Wang, D. and Wang, Q.. 2006a. Interannual variability of the South China Sea associated with El Nino, J. Geophys. Res. 111: p. C03023 10.1029/2005JC003333.

This work is licensed under a Creative Commons Attribution 4.0 International License.
![]()
A New Edition of Web of Science
Journal Impact Factor
2022: 0.5
Five Year: 0.8
Journal is Indexed in

Cabells Whitelist
![]()


