Macronutrient and Micronutrients Status in Relation to Soil Characteristics in South- East Coast Plain-riverine Soils of India
R. Vijayakumar1, A. Arokiaraj2 and P. Martin Deva Prasath3
1Department of Engineering, Manipal University, Dubai - 345 050 (UAE).
2Department of Chemistry, AVC Mayiladuthurai (India).
3PG and Research Department of Chemistry, TBML College, Porayar - 609 307 (India).
Hundred surface soil samples representing eighteen villages of the recently tsunami affected areas of Sirkali taluk of Tamilnadu in India were analyzed for the distribution of basic soil parameters viz., pH, EC, OC and OM and macronutrients viz., N, P, K by using standard methods. The available micronutrients (DTPA extractable) viz., Fe, Mn, Cu and Zn were investigated by using Atomic Absorption Spectrophotometer (ECIL, AAS-4129). The macro and micronutrient status and their relationship with soil properties were also studied. The result showed that the available macronutrients N, P, K was 85% low and 15% medium for N, 100% low for P and 85% medium and 15% high K respectively. Regarding the micronutrients, Fe was found to be deficient by 26% and sufficient by 74%, Mn was found to be sufficient by 100%, Cu was found to be deficient by 9% and sufficient by 91%, Zn was found to be deficient by 3% and 82% in marginal and 15% sufficient respectively. Further, Fe showed positive correlation with pH, EC, OC and OM. Mn also followed the same trend as that of Fe with OC, EC and OM but negative with pH. Cu showed positive correlation with OC and OM but negative correlation with pH and EC and Zn as well.
KEYWORDS:DTPA-extractable; macronutrients; micronutrients; soil properties; plain-riverine
Download this article as:| Copy the following to cite this article: Vijayakumar R, Arokiaraj A, Prasath P. M. D. Macronutrient and Micronutrients Status in Relation to Soil Characteristics in South- East Coast Plain-riverine Soils of India. Orient J Chem 2011;27(2). |
| Copy the following to cite this URL: Vijayakumar R, Arokiaraj A, Prasath P. M. D. Macronutrient and Micronutrients Status in Relation to Soil Characteristics in South- East Coast Plain-riverine Soils of India. Orient J Chem 2011;27(2). Available from: http://www.orientjchem.org/?p=24914 |
Introduction
Soil fertility is one of the important factors controlling yields of the crops. Soil characterization in relation to evaluation of fertility status of the soils of an area or region is an important aspect in context of sustainable agriculture production. Because of imbalanced and inadequate fertilizer use coupled with low efficiency of other inputs, the response (production) efficiency of chemical fertilizer nutrients has declined tremendously under intensive agriculture in recent years. Introduction of high yielding varieties (HYV) in Indian Agriculture in mid- sixties compelled the farmers to use high doses of NPK fertilizers along with micronutrient fertilizers.
Micronutrient plays a vital role in maintaining soil health and also productivity of crops. These are needed in very small amounts. The soil must supply micronutrients for desired growth of plants and synthesis of human food. However, exploitive nature of modern agriculture involving use of organic manures and less recycling of crop residues are important factors contributing towards accelerated exhaustion of micronutrients from the soil. The deficiencies of micronutrients have become major constraints to productivity, stability and sustainability of soils. Soils with finer particles and with higher organic matter can generally provide a greater reserve of these elements whereas, coarse textured soils such as, sand have fewer reserves and tend to get depleted rather quickly.
The widespread need for the micronutrients observed in recent years can be accounted for in three ways viz. i) Naturally deficient in some soil types ii) their deficiency has been brought out by crop removal and iii) widespread erosion together with destruction of soil organic matter has also brought about their removal from the soil. Considering all the above facts a study was made in Sirkali taluk in Nagapattinam district of Tamil nadu which was recently affected by the tsunami of December 2004 in India. Further Nagapattinam district is often affected by natural disasters like cyclones, floods, storm etc. It is well known that the soil series of Sirkali taluk are characterized by light in texture, moderate to high pH and low to medium in organic content. Hence an attempt has been made to analyze the basic soil parameters, macronutrients and the micronutrients of Sirkali taluk of Nagapattinam district.
Soil Series And Characteristics
It was found that there are 4 soil series in Sirkali taluk. The name of the 4 soil series and its characteristics are mentioned below:
Adhanur (And, 11643 ha. area) series comprises of dark grey brown to dark yellowish brown, loamy textured soils derived from Cauvery alluvium. The soils are very deep, non-calcareous, having sand layer within 100 cm.
Kondal (Knd, 17,817 ha. area ) soils of this type comprises of dark brown, clayey, mildly alkaline soils derived from river alluvium occurring in a needy level land.
Thiruvengadu (Tvg, 6239 ha. area) soils are very deep, dark yellowish brown, coastal alluvium overlaid by the deposition of Cauvery alluvium.
Valuthalagudi ( Vld, 15988 ha. area ) these are dark brown, very deep sandy soils bordering the sea coast.
Study Area
Sirkali soil series comes under Agro climatic zone, Sub-zone IV – Cauvery Delta zone. Coastal eco system – Eastern coastal plain hot sub humid to semi-arid eco system with a growing period 90 – 210+ days. Sirkali taluk is one of the 8 taluks of Nagapattinam District of Tamilnadu that lies between Lat. 110 3’ N; Long 790 50’E, surrounded by Cuddalore, Mayiladuthurai, Tharangampadi (Tranqubar) and Bay of Bengal. It covers an extant of 52134 ha land area. The sites from where soil samples were collected is depicted in Map 1, for which an inventory survey of the area was conducted.
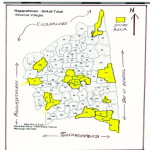 |
Map 1: Location of soil samples of Sirkali taluk. |
Material and Method
Soil samples (0-15 cm) were collected from 100 sites (map.1) covering 18 revenue villages, keeping in view the physiographic characteristic in different cross sections of the area as well as variation in soil texture. Soils were completely air-dried and passed through 2mm sieve and stored in properly labeled plastic bags for analysis. The list of villages of sampling sites of Sirkali Taluk soils are highlighted in the given Map 1. The names of the sampling stations are given below in correspondence to the number on the map.
Table 1: Samples site from villages and its number on the map.
| S.No | Name of the Village | No. on the Map |
| 1 | Thirukaruhavur | 43 |
| 2 | Semmangudi | 44 |
| 3 | Thillaividangan | 45 |
| 4 | Thittai | 46 |
| 5 | Kaivilancheri | 49 |
| 6 | Sirkali | 307 |
| 7 | Sattanathapuram | 57 |
| 8 | Panganur | 32 |
| 9 | Maruvathur | 40 |
| 10 | Karkoil | 63 |
| 11 | Kadiramangalam | 64 |
| 12 | Perunthottam Part 1 | 77 |
| 13 | Perunthottam Part 2 | 77 |
| 14 | Thiruvengadu | 306 |
| 15 | Manikiramam | 80 |
| 16 | Melaiyur | 82 |
| 17 | Vanakiri | 83 |
| 18 | Pannankudi | 69 |
The processed soil samples were analyzed for basic soil parameters ( pH, EC, OC and OM) and for macronutrients (N,P,K) by using standard procedures (Jackson 1973)1. The available Fe, Mn, Cu and Zn in soil samples were extracted with a DTPA solution (0.005M DTPA + 0.01 M CaCl2 + 0.1M triethanolamine, pH 7.3 as outlined by Lindsay and Norvell3 (1978). The concentration of micronutrients in the extract was determined by atomic absorption spectrophotometer (ECIL, AAS-4129).
Results and Discussion
The results of all the relevant soil characteristics are described in table2.
The soils are neutral to alkaline in reaction, pH 6.78 – 7.95 with the mean value of pH 7.59. The relative high pH of the soils might be due to the presence of high degree of base saturation. The electrical conductivity (EC), organic carbon (OC), organic mineral (OM) of the soil varied from 0.07 – 0.62 dsm-1, 0.20 – 7.54% and 0.50- 15.40% with a mean value of 0.344dsm-1, 1.077% and 1.625% respectively (Table .2). It showed a considerable variation with types and topography of soils. On the basis of the limits suggested by Muhr7 for judging salt problems of soils, all samples (100%) were found normal (< 1.0) in EC.
The organic carbon was very low (<0.50%) in 64%, medium in 21%, high in 15% soil samples (table.2). The very low OC content of these soils may be attributed to the poor vegetation and high rate of organic matter decomposition under hyper-thermic temperature regime which leads to extremely high oxidizing conditions (Kameriya 1995)2. The results of the present investigation are in close proximity with the findings of singh et al 5(1997).
Available nitrogen content varied from 124.49-397.67Kg/ha with an average value of 187.7Kg/ha. On the basis of standard ratings (F.A.Q. Calcareous soils6 1973), 85% samples were low (< 250 N Kg/ha) and 15% samples were medium (250- 500Kg/ha) in available nitrogen (Table 2). Similar results were reported by paliwal8.
The available phosphorus content varied from 3.705– 17.29 Kg/ha with the mean value of 11.36 Kg/ha (table2). The range is considerably large which might be due to variation in soil properties viz., pH, organic matter content, texture and various management and agronomic practices. On the basis of the limits suggested by Muhr7, all the 100% samples were low (< 20 P2O5 Kg/ha, Table2). This might be due to the presence of more than 50% of phosphorus in organic farms and after decomposition of organic matter as humus is farmed which forms complex with Al and Fe and that is a protective cover for phosphorus fixation with Al and Fe. Thus reduce phosphorus adsorption / phosphate fixation, (10Tisdale S.L et. al 1997).
Status of available potassium (K2O) in the soils ranged from 135.85 – 432.25Kg/ha with an average of 237.37 Kg/ha (Table .2). According to Muhr7 85% samples were medium (125- 300 kg/ha)and 15% high in potassium content (Table.2). This might be due to creation of favorable soil environment with the presence of high organic matter.
Data on available Fe in soil samples indicated that 26% soil samples were deficient in DTPA-Fe content and 74% of the soil samples were sufficient (Table.2) with 4.5mg/kg as the critical limit proposed by Lindsay and Norvell3. The content of DTPA- Fe in soils varied from 2.94to 6.75mg/kg with an average value of 4.912mg/kg (Table.2). The available of Fe increased significantly with an increase in EC (r = 1.1), organic carbon (r =2.0), pH (r=0.35) and organic matter (r=2.0), (Table3).
The DTPA-Mn in the soil samples varied from 3.78-6.94mg/kg with the mean value of 5.902 (Table2), considering 3.00 mg/kg as critical limit for Mn deficiency (4Sakal et al. 1985), here all the 100% samples were sufficient in availability (Table2). The available Mn in these soil samples was positively correlated with EC (r = 0.07), organic carbon(r=0.56), organic matter (r=0.66) and inversely proportional to pH by -1.12 (Table3).
Available Cu content of the soil samples varied from 0.32 – 1.52 mg.kg-1 with the mean value of 0.861mg.kg-1 (Table2). The data indicated that 9% of the soil samples were deficient in availability of Cu and 91% were sufficient (Fig.2) considering 0.66 mg/kg(4sakal et al. 1985). The available Cu inversely proportional to pH (r = – 0.09), EC (-1.28), and directly proportional to OC (r=0.42) and organic matter (r=0.44) (Table3).
Available Zn in the soil samples varied from 0.32 to 1.40 mg.kg-1 with the mean value of 0.8414mg.kg-1 (Table2). On the basis of critical limit suggested by Takkar and Mann9 3% samples were deficient, 82% samples were marginal and 15% of the samples were sufficient (Table2) in availability (< 0.6 mg.kg-1 for deficient, 0.6 to 1.2mg.kg-1 for marginal and > 1.2 mg.kg-1 for sufficient). The availability of Zn increased with increase in OC (r = 0.65), OM (r = 0.63) whereas reduced with increase in pH (r = – 0.08), (Table2) and EC (r= – 0.08) Table 3.
Table 2. Physico – chemical properties and Nutrient Status of Soil Characteristics
| Range | Mean | ||||
| pH | 6.78 – 7.95 | 7.59 | |||
| EC | 0.07 – 0.62/dsm | 0.344/dsm | |||
| OC | 0.20 – 7.54% | 1.077% | |||
| OM | 0.50 – 15.40% | 1.625% | |||
| Available Macronutrients | Range
(Kg/ha) |
Mean
(Kg/ha) |
Low
(%) |
Medium
(%) |
High
(%) |
| N | 124.49-397.67 | 185.7 | 85 | 15 | nil |
| P | 3.705-17.29 | 11.36 | 100 | nil | nil |
| K | 135.85-432.25 | 237.37 | nil | 85 | 15 |
| Available
Micronutrients’ |
Range
(mg/kg) |
Mean
(mg/kg) |
Deficient
(%) |
Marginal
(%) |
Sufficient
(%) |
| Fe | 2.94 – 6.75 | 4.912 | 26 | nil | 74 |
| Mn | 3.78 – 6.94 | 5.902 | nil | nil | 100 |
| Cu | 0.32-1.52 | 0.861 | 9 | nil | 91 |
| Zn | 0.32- 1.40 | 0.8414 | 3 | 82 | 15 |
Table 3. Correlation matrix between soil properties and available nutrients Soil Characteristics
|
Available Micronutrients |
|||||||
| Fe | Mn | Cu | Zn | ||||
| OC | 2.0 | 0.56 | 0.42 | 0.65 | |||
| pH | 0.35 | -1.12 | -0.09 | -0.08 | |||
| EC
OM |
1.1
2.02 |
0.07
0.66 |
-1.28
0.44 |
-0.08
0.63
|
|||
Conclusion
Considering the critical limit of macronutrients, the recorded macronutrients are 85% low, 15% medium in nitrogen, 100% low in P2O5 and 85% medium, 15% high in potassium. Among micronutrients, Fe sufficient by 74%, Mn suefficient by 100%, Cu sufficient by 91% and Zn sufficient by 15% only. The studied soils though contained adequate amounts of available micronutrients deficiencies also recorded. The results indicated that the soil properties pH, EC, OC and OM are the main characteristics playing major role in controlling the availability of micronutrients. These factors could be manipulated in order to combat any present or future deficiencies of micronutrients in these soils.
Reference
- Jackson, M.L (1973) Soil chemical analysis, prentice Hal of India Private Limited, New Delhi.
- Kameriya, P.R. (1995) Characterization of soils of agro climatic zone of transitional plain of inland drainage (Zone 11-A) of Rajasthan, Ph.D. Thesis, R.A.U., Bikaner.
- Lindsay, W.L. and Norvell, W.A (1978) Development of DTPA soil tests for Zn, Fe, Mn and Cu. Soil Science Society of America Journal 42, 421-428.
- Sakal. R, Singh, A.P., Singh, B.P., Sinha, R.B., Jha, S.N. and Singh, S.P. (1985) Distribution of available micronutrient cations in calcareous soils as related to certain soil properties. Journal of the Indian Society of soil science 33, 672-675.
- Singh, C.P., Gupta, S.P and Gupta, V.K. (1997) Determination of micro and secondary nutrients in ber (Zizyphus mauritana L) orchard soil profiles. Hariyana Journal of Horticulture science 26, 199-202.
- F.A.O Calcareous Soils. F.A.O. Soils Bulletin No. 21 (1973)
- Muhr G.R. Datta N.P., Shankara Subraney N., Dever F., Lecy V.K., and Donahue R.R., Soil testing of India. USAID Mission to India (1963)
- Paliwal M.L.,Studies on Major and Micronutrient Status of Soils of Panchayat Samiti Bhinder (Dist.Udaipur)., M.Sc(Ag)Thesis, Rajasthan Agricultural University, Bikaner (1996).
- Takkar P.N and MannM.S., Agrochemica 19, 420 ( 1975)
- Tisdale S.L., Nelson W.L., Beaton J.D., Havlin J.L., Soil fertility and fertilizers, 5th Edition. Macmillan publishing Co., New Delhi.pp 144, 180, 198, 201 (1997).
- Yadav R.L. and Meena M.C., Available Micronutrient status and their relationship with soil properties of Degana soil series of Rajasthan. Journal of the Indian Society of soil science, Vol. 57, No.1, pp 90-92 (2009).

This work is licensed under a Creative Commons Attribution 4.0 International License.
![]()
A New Edition of Web of Science
Journal Impact Factor
2022: 0.5
Five Year: 0.8
Journal is Indexed in

Cabells Whitelist
![]()


