Linear Regression Analysis for Kinetics and Isotherm Studies of Sorption of Manganese (II) Ions Onto Activated Palm ash from Waste Water
Zaira Zaman Chowdhury*, Sharifuddin Mohd. Zain, Rashid Atta Khan and Khalisanni Khalid
Department of Chemistry, Faculty of Science, University Malaya, Kuala Lumpur (Malaysia).
The potential of low cost adsorbent, palm oil ash was investigated as a replacement of current expensive methods for treating wastewater contaminated by Mn (II) cation. To enhance the uptake capacity, natural oil palm ash (OPA) was refluxed sodium hydroxide solution for certain period of time and temperature. Reaction rate constants were calculated by linear regression analysis of Pseudo first order, Pseudo second order, and Intra-particle diffusion kinetic equations. The linear plots of intra particle diffusion suggested that the adsorption process was mainly carried out by pore diffusion. Experimental data showed that equilibrium uptake was increased with the increase of initial Mn (II) ion concentration and contact time. The values of Langmuir dimensionless constant, RL and Freundlich constant, 1/n were less than 1, which revealed that the adsorption process is favourable.
KEYWORDS:Kinetics; Isotherm; Thermodynamics; Oil palm ash
Download this article as:| Copy the following to cite this article: Chowdhury Z. Z, Zain S. M, Khan R. A, Khalid K. Linear Regression Analysis for Kinetics and Isotherm Studies of Sorption of Manganese (II) Ions Onto Activated Palm ash from Waste Water. Orient J Chem 2011;27(2). |
| Copy the following to cite this URL: Chowdhury Z. Z, Zain S. M, Khan R. A, Khalid K. Linear Regression Analysis for Kinetics and Isotherm Studies of Sorption of Manganese (II) Ions Onto Activated Palm ash from Waste Water. Available from: http://www.orientjchem.org/?p=11679 |
Introduction
The Aqueous effluents emanating from various natural and industrial sources contain heavy metals dissolved in it. The hazardous impact of heavy metals in waste stream has generated considerable concern in recent years. Primarily, some manmade factors such as unplanned urbanization, deforestation, industrialization along with anthropogenic activities, such as weathering of rocks and volcanic activities are the major cause for enriching the water reservoirs with heavy metals 1-5. Different metals such as manganese (Mn), lead (Pb), chromium (Cr), mercury (Hg),cadmium (Cd), arsenic (As), copper (Cu) etc. are known to be highly toxic due to their non-biodegradability . Among these heavy metals, manganese is considered as one of the most toxic one. If manganese, Mn (II) is present in water than the tolerance limit, then it may cause severe damage to the nervous system6.
In order to reach environmental standards, many conventional methods including oxidation, membrane filtration, coagulation, reverse osmosis, adsorption onto activated carbon, ion exchange, precipitation, etc. have been reported in the literature to remove manganese along with other heavy metals from waste water 7-12. These methods are extremely expensive especially when it is relatively dissolved in low concentration of about (1-100ppm) in large volume of waste stream. However, adsorption onto low cost adsorbent can be considered as one of the most popular method for the removal of heavy metals from the wastewater due to its cheap cost, easy availability, biodegradability and simplicity of design with high removal efficiency. Moreover, it does not generate toxic substances. Therefore, removal of heavy metals including manganese by adsorption technique from aqueous streams by using agricultural and industrial waste products which are abundant in nature and requires little processing has received much attention in recent years 13. Several adsorbent derived from low cost material such as: zea mays Tassel 14, sunflower stalk15, spent grain16, onion skin17, rice husk 18-19, almond husk20, sea mussel and white clay21, Spirogyra neglecta22, dried activated sludge23, etc. for treating metal bearing waste water at the solid-solution interface have been reported.
Above perusal of the literature clearly depicts the importance of using several types of low cost adsorbents for removal of heavy metals from waste water. Oil palm ash after activation with sodium hydroxide possesses some unique features of extended surface area, porosities and oxide content in it which significantly can contribute for its enhanced uptake capacity of Mn (II) in liquid phase adsorption.
Malaysia produces a large amount of agro-based waste biomass-generated from oil palm industries which consists of empty fruit bunch (EFB), palm shell (PS) and mesocarp fiber. The statistical report showed that, about 110 million tones of renewable non oil biomass (trunks, fronds, shell, press palm fiber and empty fruit bunch) are produced each year 24. Oil palm ash (OPA) is a kind of particulate material produced from combustion of this waste biomass in boiler to obtain steam for electricity generation. Present research aims to remove Mn (II) from waste water by using chemically treated palm oil ash and to investigate the influence of all the physicochemical parameters involved during the removal process. The research focuses on adsorption kinetics and isotherm studies of Mn (II) onto the prepared adsorbent. The efforts have been made to develop an improved activation strategy for natural oil palm ash by using sodium hydroxide which can enhance its surface area significantly and consequently increase its adsorption capability for Mn (II) ions from waste water.
Experimental
Preparation of stock solution
Manganese (II) chloride, MnCl2.2H2O, sodium hydroxide (NaOH) and hydrochloric acid (HCl) were obtained from Merck, Germany. Stock solution of manganese salt having concentration of about 1000 mg/l was prepared with double distilled water. Various concentrations of test solution of Mn (II) ranging from 50mg/l to 100 mg/l were prepared by subsequent dilution of the stock solution. The initial pH was adjusted to 5.5 using a pH meter (Mettles Toledo, Model: Ross FE 20, USA) so as to avoid any precipitation at higher concentration. Fresh dilution of the stock solution was done for each adsorption study to minimize the error. All reagents used for the research purpose were of AR grade chemicals.
Activation of Oil palm ash (OPA)
The palm oil ash used here was taken from the middle section of the flue tower. The sample was collected from East oil Mill, Golden Hope Plantation Sdn. Bhd, Pulau Carey, Selangor. The raw OPA thus obtained was sieved through sieve no 200µm. It was washed with deionized water for several times to remove foreign particles which might interfere during the sorption process. It was oven dried at 110 °C over night to remove moisture. The ratio of oil palm ash with caustic soda was predetermined and was kept constant at 5:1 that is 50 grams of oil palm ash were mixed with 10 gm of NaOH in 250 ml distilled water. Then the mixture transferred into a round bottom flask with a magnetic stirrer placed inside it and was refluxed at 160°C for 8 hours. After the heating was stopped, the slurry was allowed to cool at room temperature and filtered. The filter cake was repeatedly washed with deionized water until neutral pH of the filtrate was observed to ensure complete removal of unreacted caustic soda from the adsorbent surface. Then it was dried in an oven at 110 °C for 12 hours before use for adsorption study and stored in desiccators over fresh silica gel for further application.
Surface Characterization
The surface functional groups of activated OPA were detected by Fourier transform infrared (FTIR) spectroscope FTIR-2000, PerkinElmer and the spectra were recorded from 4000 to 400 cm−1. Textural characterization of the activated OPA was carried out by N2 adsorption at 77 K using Autosorb I (Quantachrome Corporation, USA). Before performing the nitrogen gas adsorption, the natural and activated OPA was out gassed under vacuum at temperature 300°C for 4 hours to ensure complete removal of moisture content from the surface of both types of OPA. Surface area and pore volume were calculated by using Brunaure Emmett Teller (BET).
Equilibrium Studies
Each of the batch experiment was carried out by adding 0.2 gm of OPA with 50 ml of different concentration of Mn (II) solution at agitation speed of about 150 rpm. The residual concentration of Mn (II) was analyzed after predetermined interval of time until the system reached equilibrium by using atomic absorption spectrophotometer (Perkin – Elmer Model 3100).
Isotherm Studies
For isotherm studies, each experiment was conducted at 30 ° C in a thermoregulated water bath (Haake Wia Model, Japan) with shaker cover in order to prevent heat loss to the surroundings. The equilibrium adsorption amount (qe) is calculated according to equation (1)
![]()
Where,
qe = adsorption amount of metal ion (mg/g) at equilibrium contact time
W= weight of adsorbent (g)
V = volume of solution (ml)
The removal efficiency of the metal ion was calculated by using equation (2)
![]()
Results and Discussion
The FTIR spectroscopy is a well known method for identification of groups and quantitative analysis of the sample. The FTIR spectrum of natural and activated samples of oil palm ash is shown by following Figure1. It is quite clear from the spectra that some peaks shifted due to activation and some peaks disappeared even after the treatment with sodium hydroxide. The peaks of 468.16 cm-1 and 474.02 cm-1 for natural and activated samples of oil palm ash represented bending of Si-O group. The peaks of 797.79 cm-1 and 793.99 cm-1 on both the sample were detected meaning CH out of plane deformation. The band of 1050.70 cm-1 in natural and 1030.20 cm-1 in activated OPA were assigned for Si-O-Si stretching vibration. The peak of 1651.42 cm-1 shifted to 1638.68 cm-1 in activated sample represented C=C stretching vibration. The peaks of 3394.21 cm-1 and 3449.52 cm-1 corresponded to OH stretching vibration of hydroxyl functional group in natural and activated samples of activated OPA. However, the two peaks of 2901.88 cm-1 and 2976.41 cm-1 for aliphatic CH2 vibration disappeared in activated sample. Another peak at 880.78 cm-1 for Si-H deformation also disappeared in activated sample. The presence of peaks at 2366.31 cm-1 in natural sample and 2346.23 cm-1 and 2375.43 cm-1 in activated sample was due to the presence of C≡C stretching vibration in alkyne groups.
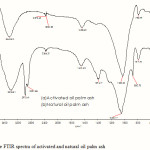 |
Figure 1: The FTIR spectra of activated and natural oil palm ash |
Adsorption is mainly dependent on surface area, pore structure and surface functional groups. The BET surface area for the natural sample was 3.774 m2/g, but it increased to 467.1 m2/g after activation with NaOH. The micro pore volume and micro pore surface area of natural sample of OPA calculated was 0.0014cm3/g and 4.057 m2/g respectively which were increased to 0.199 cm3/g and 561.9 m2/g after activation.
Fig. 2 describes the effect of initial Mn (II) ion concentration and uptake by activated OPA with equilibrium contact time. It is clearly visible from the graph, that amount of uptake, qt (mg/gm) increased with increased agitation time and after certain period of contact time with the activated OPA; it reached to a static value beyond which no further change of uptake was observed reflecting the equilibrium state of the system. The experimental data showed that, the adsorption process was taking place rapidly at initial stage of contact period and after that near the equilibrium point it became slower. The rate of Mn (II) uptake was initially high due to the availability of larger surface area of activated oil palm ash for adsorption. With the lapse of time, the surface adsorption sites were occupied. The remaining vacant sites were difficult to be captured by Mn (II) ions due to repulsive forces between adsorbate that is Mn (II) present in solid and bulk phases. As the concentration of the Mn (II) ion is increasing, the sorption capacity by the prepared adsorbent is also increasing. Similar trend was observed for Cu (II) and Pb (II) adsorption on sawdust of meranti wood 25.The plot reveals that within 80 min the system reached equilibrium and after that no more adsorption was taking place. However, here experimental data were measured for 180 min. to ensure that full equilibrium was achieved.
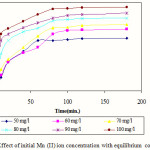 |
Figure 2: Effect of initial Mn (II) ion concentration with equilibrium contact time Click here to View Figure |
In order to study the effect of pH, the solution pH was changed from 2-8 while keeping the other variable constant. Following fig. 3 describes the effect of pH on removal% of Mn(II) onto activated OPA. It was observed that adsorption of Mn (II) ion from the solution was strongly pH dependent. At lower pH of 2-3 range the adsorption was very low and it rapidly increased between pH 4-7. After that with increase of pH, there was no increase of removal % of Mn (II) from the solution. At lower pH, the presence of H+ and H3O+ ions in the solution compete with Mn (II) ions for active binding sites on the surface of palm oil ash, which leads to fewer binding sites being available for binding Mn (II) ions. As the pH increases from 3-7, the adsorption surface became less positive and therefore electrostatic attraction between Mn(II) ions and the surface of palm oil ash was increased resulting greater removal efficiency between pH 4-7. The result depicts that removal% was increased steadily up to pH 6, after pH 7 , more or less it was same. Cumulative effect of adsorption and precipitation has enhanced the removal efficiency at higher pH values. Therefore, to ensure true adsorption, all kinetics experiments were carried out at pH 5.5.
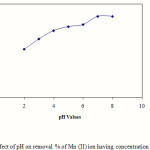 |
Figure 3: Effect of pH on removal % of Mn (II) ion having concentration of 100 mg/l Click here to View Figure |
Calculation of chemical kinetics is very important to understand the rate of reaction 26-28. The pseudo first order equation based on equilibrium adsorption is expressed as:
![]()
Where, qe and qt are the amount of adsorbed (mg/g) at equilibrium and at any time t, k1 is the first order rate constant (min-1). The plot of versus gave the slope k1 and intercept of and is shown by the following Fig 4.
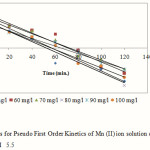 |
Figure 4: Plots for Pseudo First Order Kinetics of Mn (II) ion solution onto activated OPA at pH 5.5 |
Pseudo second order equation can be given by:
![]()
Here,k2 is the rate constant of second order adsorption. The linear plot of versus t gave 1/qe as slope and 1/k2q2 as intercept. This model is more likely to predict the behaviour for the range of concentration studied here for adsorption and represents chemisorptions. The linear plots of pseudo second order model is shown in Fig. 5 and the model parameters for both pseudo first and second order kinetics are listed in Table 1.
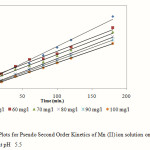 |
Figure 5: Plots for Pseudo Second Order Kinetics of Mn (II) ion solution onto activated OPA at pH 5.5 Click here to View Figure |
Table 1: Comparison of pseudo-first order and pseudo-second order adsorption rate constant for different initial concentration Mn (II) ion
|
Pseudo-first order kinetics Pseudo-second order Kinetics |
|||||||
|
C0 |
qe (exp) |
qe (cal) |
K1 |
R2 |
qe (cal) |
K2 |
R2 |
|
(mg/l) |
(mg/g) |
(mg/g) |
(min-1) |
(mg/g) |
(min-1) |
||
|
50 |
8.3125 |
7.6559 |
0.0392 |
0.945 |
9.8039 |
0.0044 |
0.983 |
|
60 |
9.8050 |
13.964 |
0.0369 |
0.947 |
12.346 |
0.0022 |
0.983 |
|
70 |
10.550 |
11.246 |
0.0322 |
0.979 |
12.500 |
0.0030 |
0.993 |
|
80 |
11.505 |
10.069 |
0.0392 |
0.969 |
12.500 |
0.0070 |
0.998 |
|
90 |
12.3025 |
6.6374 |
0.0276 |
0.980 |
12.987 |
0.0084 |
0.998 |
|
100 |
13.3050 |
7.2778 |
0.0345 |
0.972 |
14.085 |
0.0092 |
0.999 |
Table 1 summarizes the results obtained for both types of kinetics studies. In the same table, the correlation coefficients, R2 was determined and experimental equilibrium uptake, qe were compared with those calculated theoretically from pseudo first and second order kinetics. From Table 1, it clearly reflects that the experimental values of qe determined in this work were very close to the theoretical ones in case of second order kinetics. With no exception, the accuracy is better for second order kinetics in all concentration range studied here as R2 values are near to unity and this indicated the chemisorption nature of adsorption here.
The rate-limiting step is the key factor to be determined in the adsorption process to understand the overall mechanism for sorption. The most commonly used technique for identifying the mechanism involved in the adsorption process is by fitting an intraparticle diffusion plot. According to Weber and Morris 29, an intraparticle diffusion coefficient Kid is given by the equation:
![]()
The linear plots of versus is shown by Fig. 6. The slope of the plot has been defined to give the intraparticle diffusion parameter (mg ). On the other hand, the intercept of the plot yields C, the boundary layer effect. The larger the intercept observed, the greater will be the contribution of the surface sorption in the rate-controlling step.
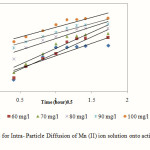 |
Figure 6: Plots for Intra- Particle Diffusion of Mn (II) ion solution onto activated OPA at pH 5.5 |
From the plot it is observed that the lines did not pass through the origin. This indicated that the rate limiting process is not only governed by intra particle diffusion. Some other mechanism along with intraparticle diffusion was involved 30.
Table 2: Intra particle rate constant for different initial concentration
|
Initial |
C |
Kdif(mg/gh0.5) |
Correlation |
|
Concentration(mg/L) |
coefficient,R2 |
||
|
50 |
1.975 |
4.502 |
0.765 |
|
60 |
1.049 |
5.899 |
0.898 |
|
70 |
2.044 |
5.797 |
0.882 |
|
80 |
5.400 |
4.214 |
0.850 |
|
90 |
7.027 |
3.507 |
0.919 |
|
100 |
8.080 |
3.562 |
0.884 |
The Langmuir isotherm predicts monolayer adsorption for the adsorbate assuming constant heat of adsorption for all sites on the active sites of the adsorbent and it is expressed by following equation31:
![]()
The linear form of the Langmuir isotherm is given by:
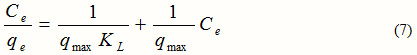
Where, qe = Equilibrium cation concentration on the adsorbent (mg/g),
Ce = Equilibrium cation concentration in solution (mg/l),
qmax = The maximum monolayer adsorption capacity of the adsorbent (mg/g),
KL = The Langmuir adsorption constant (l/mg).
When Ce/qe is plotted against Ce, a straight line having slope 1/qmax and intercept of 1/qmaxKL is obtained.
The essential characteristics of the Langmuir equation can be represented by a dimensionless factor, RL which is given below-
![]()
Co is the highest initial cation concentration (mg/l). The value of separation factor RL, can be represented by following Table 3-
Table 3: Essential Characteristics of Langmuir Isotherm
|
Value of RL Type of Isotherm |
|
RL > 1 Unfavourable RL= 1 Linear 0 < RL < 1 Favourable RL= 1 Irreversible |
The linear plot of Langmuir Isotherm at 30°C temperature is shown by Fig. 7 and the model parameters at 30°C are listed in Table 4.
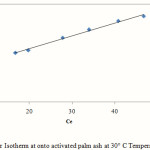 |
Figure 7: Langmuir Isotherm at onto activated palm ash at 30° C Temperature at pH 5.5 |
Freundlich isotherm gives the relationship between equilibrium liquid and solid phase capacity based on the multilayer adsorption representing heterogeneous surface properties 32. This isotherm is based on the assumption that the adsorption sites are distributed exponentially with respect to the heat of adsorption and is given by: ![]()
And can be linearized as:
![]()
Where Kf (mg ) = Multilayer adsorption capacity and
1/n = Intensity of adsorption. The linear plot of Freundlich Isotherm at 30°C temperature is given on Fig. 8 and the model parameters at 30°C are listed in Table 4
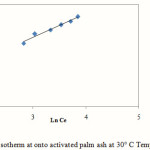 |
Figure 8: Freundlich Isotherm at onto activated palm ash at 30° C Temperature at pH 5.5 |
Temkin isotherm assumes that the effects of the heat of adsorption of all molecules in the layer would decrease linearly with coverage due to the adsorbate and adsorbent interactions and is given by33:
![]()
Equation 11 can be linearized as:
![]()
Here,
RT/b = B (j/mol), which is Temkin constant related to heat of sorption
A (L/g) = Equilibrium binding constant corresponding to the maximum binding energy,
R (8.314 J/mol k) = Universal; gas constant and
T° (K) = Absolute solution temperature.
Fig. 9 depicts Temkin model under the concentration range studied here.
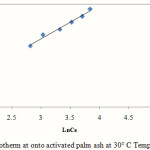 |
Figure 9: Temkin Isotherm at onto activated palm ash at 30° C Temperature at pH 5.5 |
Table 4: Isotherm model parameters and correlation coefficient at 30° C Temperature
|
Isotherm Model |
Parameters
|
values
|
R2 |
|
Langmuir
|
qm ,maximum monolayer adsorption capacities(mg/g) RL, separation factor KL, Langmuir constant |
19.2307 0.1801 0.0455 |
0.993
|
|
Freundlich |
KF,Affinity Factor(mg/gm(L/mg)1/n) 1/n, Freundlich exponent |
2.604
0.422 |
0.978
|
|
Temkin |
A, (l/mg) B |
0.3924 4.492 |
0.981 |
The R2 values of the Langmuir model here suggested that the adsorption process was monolayer and adsorption of each molecule had equal activation energy. The RL value obtained is below 1 indicating that the adsorption of Mn (II) onto activated oil palm ash is favourable. The Langmuir model was found to fit the data significantly better than Freundlich model, which demonstrated more homogeneous nature of activated palm ash. Freundlich exponent, 1/n ranging between 0 and 1 is a measure of adsorption intensity or surface heterogeneity which is below one indicating favourable adsorption of Mn (II) onto activated oil palm ash. Linear regression analysis of Temkin isotherm showed a higher regression coefficient, which may be due to the linear dependence of heat of adsorption at low or medium coverage. The regression coefficient of these models showed a strong affinity for the adsorption of Mn (II) onto activated palm ash.
Conclusions
From the findings of this research, it can be concluded that sodium hydroxide activated oil palm ash is a versatile, novel and environmentally friendly adsorbent which can be used successfully for separation of Mn (II) from waste water.
Acknowledgements
The authors are grateful for the financial support of this project by Research Grant (UMRG 056-09SUS) of University Malaya, Malaysia.
References
- Bailey S. E., Olin T J, Bricka R M and Adrian D D., Water Res., 33(11): 2469,(1999).
- Cay S., Uyanik A. and Ozajik A., Sep. Purif. Technol., 38: 273, (2004).
- Tee T. W. and Khan A. R. M., Environ. Technol. Lett., 9: 1223, (1988).
- Jonathan Y. Am. J. Applied Sci., 7(2): 153, (2010).
- Ong M.C., and Kamruzzaman, B.Y., Am. J. Applied Sci., 6(7):1418, (2009).
- Savova D., Petrov N., Yardin M.F., Ekinci E., Budinova T., Razvigorova M. and Minkova V., Carbon,41: 1897, (2003).
- Pandey A., Shukla A. and Ray L., Am. J. Biochem. & Biotech. 3(2): 55, (2009).
- Toles C.A., Marshal W.E., and Johns M.M., Carbon, 35:1407, (1997).
- Dastgheib S.A. and Rockstraw A.D. Carbon, 31: 1849, (2001).
- Hashim M. A. and Chu K. H., Chem. Eng. J., 97: 249, (2004)
- Horsfall M., Abia A. A. and Spiff A. I., Afr. J. Biotechnol., 2(10): 360, (2003).
- Okieimen F. E. and Onyenkpa V. U., Biol. Wastes, 29: 11, (1989).
- Zuorro, A. and Lavecchia R., Am .J. Applied Sci., 7: 153, (2010).
- Caliph M. Z., Okonkwo O.J. and Agyei N.M., Am. J. Biochem. & Biotech. 6(1): 10. (2010).
- Sun G. and Shi W., Ind. Eng. Chem. Res., 37(4): 1324, (1998).
- Low K. S., Lee C. K. and Liew S. C., Process Biochem., 36(1-2): 59, (2000).
- Kumar P. and Dara S. S., J. Polym. Sci. Polym. Chem. Ed., 19: 397, (1981).
- Khalid N., Ahmad S., Kiani S. N. and Ahmed J., J Sep Sci Technol., 34(16):3139, (1999).
- Munaf E., and Zein R., Environ. Technol., 18(3): 359, (1997).
- Hasar H., J. Hazard. Mater. B97: 49, (2003).
- Sakulkhaemaruethai, S., Duangduen C., Pivsa-Artand W. and Pivsa-Art S. Energy Research Journal, 1(2): 78, (2010).
- Modher, A.H., Salleh A. and Milow P., Am. J. Biochem. & Biotech, 6(1): 1, (2009).
- Solatani, R. D.C., Jafari A.J. and Khorramabadi G.S., Am. J. Environ. Sci. 5(1): 41, (2009).
- Saifuddin, N. and Fazlili S.A., Am. J. Eng. & Applied Sci., 2(1): 139. (2009).
- Ahmad A., Rafatullah M., Sulaiman O., Ibrahim M.H., Chee Y.Y. and Siddique B.M., Desalination, 247: 636, (2009).
- Ho Y.S. and McKay G., Process Biochemistry, 34(5): 451, (1999a).
- Ho Y.S. and McKay G., Water Research, 33(2): 578, (199b).
- Wong K.K., Lee C.K., Low K. S. and Haron M.J., Chemosphere, 50: 23, (2003)
- Weber W.J. and Morris J.C., In: Proc. Int. Conf. Water pollution symposium, 2: Pergamon, Oxford, (1962), 231, (1962).
- Weber W.J. and Morris J.C., J. Sanit. Eng. Div. Am. Soc. Civ. Eng. 89: 31, (1963).
- Langmuir I., J. Am. Chem. Soc. 38: 2221, (1916).
- Freundlich H.M.F., J. Phys. Chem. 57A: 385, (1906).
- Temkin M.I., and Pyzhev V., Jour. Phys. Chem. (U.S.S.R.), 13: 851, (1939).

This work is licensed under a Creative Commons Attribution 4.0 International License.
![]()
A New Edition of Web of Science
Journal Impact Factor
2022: 0.5
Five Year: 0.8
Journal is Indexed in

Cabells Whitelist
![]()


