Fabrication of Collagen-Coated Poly (beta-hydroxy butyrate-co-beta-hydroxyvalerate) Nanofiber by Chemical and Physical Methods
M. Rezaei-Tavirani1 , E. Biazar2 *, J Ai3 , S. Heidari1 and A. Asefnejad4
1Clinical Proteomics Research Center, Faculty of Paramedical Sciences, Shahid Beheshti University of Medical Sciences,Tehran, (Iran). 2Department of Chemistry, Tonekabon Branch, Islamic Azad University, Tonekabon, (Iran). 3Department of Tissue Engineering, Faculty of Advanced Technologies, Tehran University of Medical Sciences, Tehran, (Iran). 4Department of Biomaterial Engineering, Science and Research Branch, Islamic Azad University, Tehran, (Iran).
Tissue engineering is the design and engineering of structures to rebuild and repair damaged tissue of the body. Poly (beta-hydroxybutyrate-co-beta-hydroxyvalerate) (PHBV) scaffold has shown good biocompatibility and biodegradable properties. Nanofibers have improved the performance of biomaterials, and could be considered effective. Electro spinning is one of the most important methods of fabricating nanofibrous scaffolding. In this study, PHBV nanofibers were well designed then modified with immobilized collagen by a chemical method (glutaraldehyde) and physical method (oxygen plasma). The samples were evaluated by attenuated total reflectance-fourier transform infrared spectroscopy (ATR-FTIR), scanning electron microscope (SEM), contact angle and finally, cell culture. ATR-FTIR structural analysis showed the presence of collagen on the nanofiber surfaces both the methods. The SEM images showed the average size of nanofibers to be about 280 nm, which increased with a collagen coating up to 350-400 nm in the both methods. Contact angle analysis were 67° for uncoated nanofibers and 52-56° for coated nanofibers by the both methods. Cellular investigations (unrestricted somatic stem cells) showed better adhesion and cell growth and proliferation of coated samples by physical method than chemical method.
KEYWORDS:PHBV; Nanofiber; Collagen coating; Glutaraldehyde; Plasma treatment; Cellular investigation
Download this article as:| Copy the following to cite this article: Rezaei-Tavirani M, Biazar E, Ai J., Heidari S, Asefnejad A. Fabrication of Collagen-Coated Poly (beta-hydroxy butyrate-co-beta-hydroxyvalerate) Nanofiber by Chemical and Physical Methods. Orient J Chem 2011;27(2). |
| Copy the following to cite this URL: Rezaei-Tavirani M, Biazar E, Ai J., Heidari S, Asefnejad A. Fabrication of Collagen-Coated Poly (beta-hydroxy butyrate-co-beta-hydroxyvalerate) Nanofiber by Chemical and Physical Methods. Available from: http://www.orientjchem.org/?p=11672 |
Introduction
Poly (3-hydroxybutyrate-co-3-hydroxyvalerate) (PHBV) is a biomaterial that is used in a variety of applications including surgical sutures, wound dressing, drug delivery, and tissue engineering. Its versatility is due to its specific properties such as good biocompatibility, biodegradability, and nontoxicity as well as its piezoelectricity features. However, this material is a hydrophobic polyester which should be modified with other materials until it improves its cell adhesion and hydrophilicity properties.1-5 It has been generally accepted that extracellular matrix mimics may improve the attachment, proliferation, and viability of the cultured cells.6 Electro spinning has been rapidly developed into a technique to prepare nanofibers with a size ranging from tens of nanometers to several microns.7-9 The electro spun fibrous mats also show extremely high surface area and large porosity. Besides, the fibrous structure of the electro spun mats may mimic the extracellular matrix. It is well known that the collagen is a natural extracellular matrix component of nearly every tissue such as bone, skin, tendon, ligament, and so on. Fiber sizes of the electro spun nanofibrous mats approach even that of collagen fiber bundles, between 50 and 500 nm.9 Therefore during
the past few years, many studies on the tissue engineering of electro spun nanofibers have been reported. Most recently, electro spun nanofibers were prepared by Yang et al and were applied in neural tissue engineering.10 Although the presented nanofibers may mimic the morphologies of extracellular matrix to some extent, some modifications are still required to create a friendly environment for the cells attachment, proliferation, and functions such as communications. Some natural materials such as collagen, fibronectin, and some peptides have been reported as scaffold modifiers.11,12 Controlling surface properties is very important for the high performance of adhesion. Biomaterials wettability is an important factor in the surface modification of materials. Surface modification of hydrophobic polymer surfaces can be achieved by wet (acid, alkali), dry (plasma), and radiation treatments (ultraviolet radiation and laser).13-16 Non-thermal and low pressure plasma have been used in a series of surface treatment applications. The majority of plasma-assisted technologies are based on low pressure processes.17 The treatment of polymeric materials with plasma is a frequently-used technique to accomplish surface modifications that affect chemical composition as well as surface topography. Moreover, microwave discharges are routinely employed in the processing of materials to deposit films as well as coatings.18,19 In this study, unrestricted somatic stem cells (USSCs) were used. USSCs were first isolated from the umbilical cord blood in 2003 by Jager et al, and their differentiation capacity for transplantation was evaluated.20 Kögler et al also evaluated these cells for cytokine production. The USSCs are pluripotent stem cell, and are considered rare cell populations in umbilical cord blood. They have a high potential to proliferate and differentiate, and thus are considered valuable sources in cell therapy. 21 The USSCs are CD45 negative, the adherent and human leukocyte (HLA) class II-negative stem cells with a long telomerase. Moreover, these cells possess a unique cytokine profile and have a high percentage of production associated with self-renewing factors. In spite of other cord blood-derived mesenchymal cells, differentiated only into osteoblasts, chondrocytes, adipocytes,22 and neurons,21 the USSCs have the potential to differentiate into osteoblasts, chondrocytes, blood cells, neurons, hepatocytes, and heart tissue under ex vivo conditions. [21]These cells express different factors, including adherent cells, growth factors, and various cytokines such as stem cell factor (SCF), vascular endothelial growth factor (VEGF), granulocyte-macrophage colony-stimulating factor (GM-CSF), macrophage colony-stimulating factor (M-CSF), tumor growth factor (TGF)-1β, interleukin (IL-6), granulyte colony-stimulating factor (G-CSF), leukemia inhibitory factor(LIF), Flt3 ligand, thrombopoietien (TPO), human hepatocyte (HGF), stromal cell derived (SDF)-1α, IL-15, IL-12, IL-8, and IL-1β.22
In this work, the coated collagen PHBV nanofibers were obtained through the chemical and physical methods. The samples were evaluated by attenuated total reflectance-Fourier transform infrared spectroscopy (ATR-FTIR), scanning electron microscope (SEM), and the contact angle, and also the cell culture with USSCs.
Materials and Methods
Materials
PHBV containing 5 mol% of 3-hydroxyvalerate with 680,000 (g mol−1) molecular weight was purchased from Sigma-Aldrich (St Louis, MO); 2,2,2-trifluoroethanol (TFE) to prepare PHBV solution was purchased from Sigma-Aldrich and used as received without further purification.
Methods
Nanofiber preparation
Electrospinning apparatus used in this study prepared from asia nano meghyas company (Iran). PHBV was dissolved at determined concentration in TFE. The PHBV solution (2% wt.) was contained in a glass syringe controlled by syringe pump. A positive high voltage source through a wire was applied at the tip of a syringe needle. In this situation a strong electric field (20 kv) is generated between PHBV solution and a collector. When the electric field reached a critical value with increasing voltage, mutual charge repulsion overcame the surface tension of the polymer solution and an electrically charged jet was ejected from the tip of a conical shape as the Taylor cone. Ultrafine fibers are formed by narrowing the ejected jet fluid as it undergoes increasing surface charge density due to evaporation of the solvent. An electro spun PHBV nanofibrous mat was carefully detached from the collector and dried in vacuum for 2 days at room temperature to remove solvent molecules completely. The nanofibers designed with determined parameters (Syringe Size: 17 mm, Collector speed: 1000 rpm , Injected speed: 2 mL/min, Syringe tip distance to collector : 75 mm , Voltage : 20 kv, Temperature: 30 °C, Time: 7 h).
Collagen immobilization
Collagen immobilization by chemical method
Collagen (type I, from bovine Achilles tendon, purchased from Sigma-Aldrich) was immobilized onto the nanofiber surface based on the following protocol. A weighted amount of the nanofibrous mat was rinsed with acetic acid buffer solution (50 mM, pH 5.0). Then, the mat was submerged into the collagen solution (15 mg/mL in acetic acid buffer solution, 50 mM, pH 5.0) and was shaken gently for 2 hours at 50°C. The samples were exposure to glutaraldehyde 12% in a hot water bath (80°C).The obtained samples were placed inside a vacuum oven so that they would completely lose humidity.
Collagen immobilization by physical method
In our experimental observation, we used a microwave plasma source to modify the surface of the polystyrene samples. The microwave plasma has significant advantage over other techniques such as Radio Frequency Glow Discharge (RFGD), frequently used in polymer surface modifications. Microwave sources could be operated at low pressures (10-3 to 10-1 mbar), which reduced the risk of gas phase contamination during processing. Moreover, the plasma properties could be controlled conveniently by adjusting the microwave power. Hence, the surface modification of this polymer became important. In this paper, we have demonstrated the effect of microwave plasma on the surface property of PHBV nanofibers with active gas (oxygen) at different times. Before exposure, the nanofibers were cut into 1 × 1 cm sections. Then, they were placed within the ethanol solution for 24 h to eliminate the pollution and fats on the films. After removing the films from the solution, they were washed in distilled water. The samples were placed in the plasma chamber and exposed to oxygen gas during 30 and 60 sec. The irradiated samples were investigated by structural analysis and microscopic and cellular investigations at times. The plasma surface treatment was reached in the microwave-induced plasma with a surface wave at 100 W. The experimental setup has been shown in Figure 1.
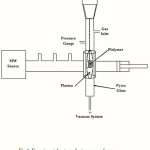 |
Figure 1: Experimental setup of microwave plasma Click here to View Figure |
Collagen (type I, from bovine Achilles tendon, purchased from Sigma) was immobilized onto the nanofiber surface based on the following protocol. A weighted amount of the plasma modified nanofibrous mat was rinsed with acetic acid solution (50 mM , pH: 5). Then, the radiated mat was submerged into the collagen solution (15 mg/mL in acetic acid solution, 50 mM , pH: 5) and was shaken gently for 2 h at 50 °C. The obtained samples were placed inside a vacuum oven so that they would fully lose humidity.
Fourier transmission infrared spectroscopy
The samples were examined by FTIR (Bruker-Equinox 55; Bruker Optics, Billerica, MA) before and after adjustment. The samples were scratched into powder and were produced as capsules using KBr, and then were investigated.
Scanning electron microscopy
The surface characteristics of various modified and unmodified films were studied by scanning electron microscopy (SEM; Cambridge Stereo-scan, model S-360; Cambridge Instruments, Wetzlar, Germany) to analyze the changes in the surface morphology. The films were first coated with a gold layer (Joel fine coat, ion sputter for 2 hours) to provide surface conduction before their scanning.
Contact angle analysis
The sample surfaces static contact angles were investigated by a contact-angle-measuring device (Krüss G10; Krüss, Matthews,NC) following the sessile drop method.
Cellular analysis
Culture and isolation of the USSC from fresh umbilical cord blood
After consent from mothers, their umbilical cords were obtained from the cord vein. Only 40% of the cord blood samples contained USSCs. The mean age of donors was 28 years. After collecting the samples, the red blood cells were lysed using ammonium chloride (NH4CL) and the isolation procedure continued by Ficoll. Then the samples were rinsed twice with sterile phosphate buffered saline (pH:7.4). After centrifuging, the resultant cells were placed in Dulbecco’s modified Eagle’s medium(DMEM) low glucose, which had been enriched with 100 nmol dexamethasone, 10% fetal bovine serum (FBS), penicillin, and streptomycin. The first medium exchange process was done for 24 hours, then every 4 days. When 80% of the flask surface area was covered by the cells, the cells were passed by using 0.25% trypsin and ethylenediaminetetraacetic acid (EDTA). The USSCs were regularly expanded on the culture medium; and the 37°C temperature and 5% of CO2 were required for the growth. The USSCs were first trypsinized and counted. The tubes, containing 105–106 cells, were incubated on a rocker rotator for 10 to 6 hours, centrifuged at 1000 rpm for 6 minutes, and 3% human serum was added to cell deposition thereafter. The resultant mixture remained at room temperature for 30 minutes. The cells were again centrifuged as above and the PBS was added to the cell deposition. The cell mixture was passed through a nylon mesh, then 100 µL of cells was added to each tube with the following antibodies: anti-CD90, anti-CD105, anti-CD166, anti-CD45, anti-CD73, and anti-CD34. Next, they were kept at 4°C out of light for 45 minutes. After washing, the cells were fixed in 100 µL of 1% paraformaldehyde. Finally, the flow cytometric analysis was carried out. the karyotype analysis was performed on USSC. The first and last passages were chosen for karyotype analysis. The cells were first placed in an incubator with 0.1 µg/mL colcemid for 3 to 4 hours. Next, they were trypsinized, and 0.075 of M KCL solution was added. The cells were incubated with 5% CO2 at 37°C for 20 minutes. In the next stage, methanol and acetic acids in ratio of 1:3 were added for fixing the samples. Finally, the cells were scattered over the slide surface and the chromosomes were subjected to karyotype analysis.
Cell culture study on the polymer surface
The tissue culture polystyrene (TCPS) as control samples were well cleaned and sterilized by the autoclave method. Individual samples were placed in Petri dishes using a sterilized pincer; the USSC suspension was transferred to a flask (25 cm) containing of DMEM, 2mML-glutamine, penicillin [100 μL/mL], streptomycin [100 μL/mL]) and FBS 10%. The suspension was then placed in an incubator (5% CO2, 37°C ). The USSCs were proliferated in the flask and were washed using the PBS. Then the trypsin enzyme/EDTA was added to the flask (37°C); and the flask was incubated for 2 minutes. The culture media (FBS/DMEM) was added to the flask, and the cells were gently pipetted. The cell suspension was transferred to a falcon tube (15 mL) and centrifuged (1410 rpm) for 5 minutes. The solution was removed and the precipitation was transferred to a new flask (75 cm) for re-culturing. Pieces of cell culture (1×1 cm) from the petri dish (control) and the main sample were placed individually in one of the Petri dish wells by using a sterilized pincer. 100,000 cells/well were seeded into a 24-well culture plate removed by pipette and poured onto the control and the main samples. Then all samples were placed in Memmert incubator at 37°C for 48 hours and studied using a ceti microscope (Wolf Laboratories, UK). Cell proliferation was determined by the MTT assay for viable cell numbers. The MTT tetrazolium compound was reduced by living cells in a colored formazan product that was soluble in the tissue culture medium. The quantity of formazan product was directly proportional to the number of viable cells in the culture. The assays were performed by adding 20 µL of MTT solution (Sigma-Aldrich) and 200 µL of fresh medium to each well after aspirating the spent medium and incubating at 37°C for 4 hours with protection from light. Colorimetric measurement of formazan dye was performed at a wavelength of 570 nm using a Rayto micro-plate reader.
Result and Discussion
FTIR results
The results, from the ATR-FTIR spectrum of the uncoated nanofiber sample, the collagen film, and the nanofiber sample modified with collagen by two method, are shown in Figure 2. In Figure 2A, the strong band in 1720 cm-1 is shown to be related to the C = O group. The stretching band in 800–975 cm-1is shown to be related to the -C-O-C- group and the stretching band in 2800–3000 cm-1is shown to be related to the –CH3 groups. Figure 2B illustrates the ATR-FTIR spectra of collagen film. The spectra shows the strong band in 1720 cm-1 as related to the C = O group, and stretching bands in 2900–3000 cm-1 as related to the –CH3 groups. The stretching bands in 3318 cm-1 and 3746 cm-1 are related to the OH and NH groups. Figure 2C shows the strong band in 1720 cm-1 as related to the C=O group, the stretching band in 800–975 cm-1 as related to the -C-O-C- group, and the stretching bands in 2800–3000 cm-1 as related to the –CH3 groups. The stretching bands in 3429 cm-1 and 3783 cm-1 are related to the presence of collagen groups, Figure 2D shows the bands related to collagen groups coated on the nanofiber surface by plasma treatment.
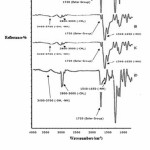 |
Figure 2:.FTIR analysis of uncoated nanofiber (2A), collagen film (2B), collagen coated nanofiber by chemical method (2C), collagen coated nanofiber by plasma method (2D). Click here to View Figure |
SEM investigations
Figures 3 – 5 show the SEM images of the uncoated and the coated nanofibers with collagen at different magnifications. The smooth and homologous nanofibers are clearly shown in the figure 3. The average size obtained for the normal nanofiber was about 280 nm.
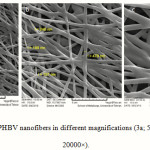 |
Figure 3: SEM images of PHBV nanofibers in different magnifications (3a; 5000× – 3b; 10000× – 3c; 20000×). Click here to View Figure |
Figure 4 shows the collagen-coated nanofiber mat prepared by the chemical method at different magnifications. The non smooth and non homologous nanofibers are shown. The size average size obtained for the nanofibers were about 400 nm; Figure 5 shows the collagen-coated nanofiber prepared by the physical method at different magnifications. The smooth and homologous nanofibers are clearly shown in this method. The average size obtained for the nanofibers were about 350 nm. The increase was due to collagen coated on the PHBV surfaces.
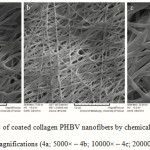 |
Figure 4: SEM images of coated collagen PHBV nanofibers by chemical method in different magnifications (4a; 5000× – 4b; 10000× – 4c; 20000×).Click here to View Figure |
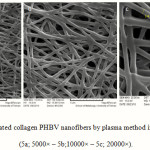 |
Figure 5: SEM images of coated collagen PHBV nanofibers by plasma method in different magnifications (5a; 5000× – 5b;10000× – 5c; 20000×). Click here to View Figure |
Contact angle results
Table 1 shows the contact angle obtained for the uncoated and the coated collagen nanofibers. The contact angles of 67° and 52-58° were obtained for the uncoated and the coated nanofibers, respectively. The 10-15° difference in the contact angle, obtained for the 2 samples, shows a better hydrophilicity of the collagen-coated nanofibers than the uncoated nanofibers.
Table 1: Contact angle for uncoated and coated collagen nanofibers
|
Coated collagen nanofiber (60 s treated plasma) θ (deg( |
Coated collagen nanofiber (30 s treated plasma) θ (deg( |
Coated collagen nanofiber (chemical method) θ (deg( |
PHBV nanofiber θ (deg( |
T(°C ) |
|
56± 1.2o |
58± 1.9o |
52± 6 |
67± 3.2o |
25 |
Cellular Results
The USSCs were isolated from the cord blood, and were then cultured. These cells were continuously cultured during 50 passages. The USSCs had a high proliferation capacity as they needed to repeat the passages. The proliferation and morphology of these cells were completely similar to each other before and after freezing. No indication of viral or mycoplasmal infection was observed during different stages of work on the USSC. The USSCs were morphologically adherent and spindle-shaped; they also had a size of 20-25 µm.After 3 passages, the flow cytometric analysis was performed on the USSC in order to express the stem cell markers. The markers were as follows: CD34, CD45, CD73, CD105, CD90 and CD166 (Figure 6). For the USSCs, the expression of the surface markers like CD90, CD105, CD166 and CD73 was positive, but was negative for CD34, CD45. Before beginning the experiments, the Karyotype analysis was performed on the USSCs of passage 2 which showed that they depicted a normal 44, XX Karyotype. After 48 passages, these cells were subjected to the Karyotype analysis once again, and it was indicated that they had a normal chromosome Karyotype of 44, XX (Figure 7). Table 2 shows the MTT assay for TCPS (control), the uncoated nanofiber and the coated collagen nanofiber samples by both methods. The results showed a high viability for the samples of the uncoated nanofiber and the collagen-coated nanofiber by chemical method (130%) and plasma method at the different times of 30 and 60 second (112, 135 and 164 % respectively). The collagen-coated nanofibers showed a better viability than the control and the uncoated nanofiber. But the collagen-coated nanofibers by plasma method especially treated plasma at 60 second showed a better viability than the collagen-coated nanofibers by chemical method.
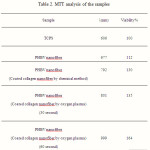 |
Table 2: MTT analysis of the samples Click here to View Figure |
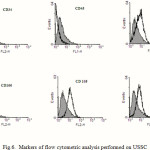 |
Figure 6: Markers of flow cytometric analysis performed on USSC Click here to View Figure |
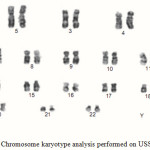 |
Figure 7: Chromosome karyotype analysis performed on USSC Click here to View Figure |
Also, the nanofiber samples caused more cells to proliferate. Figure 8 shows images of the cell culture on the nanofibers and the control sample. Image A is related to the control sample and Images B and D are related to the uncoated nanofiber and the collagen-coated nanofiber both methods. Cellular images showed good growth in the vicinity of nanofibers especially the collagen-coated nanofiber by treated plasma at 60 second.
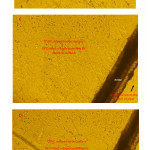 |
Figure 8: USSCs growth on the samples. a: Control (TCPS), b: uncoated nanofiber, c: coated nanofiber (modified by plasma, 30s), d: coated nanofiber (modified by plasma, 60s) |
Conclusion
PHBV nanofibers with an average size of about 280 nm were designed and successfully coated with collagen by the chemical and physical (oxygen plasma) methods shown in the analysis. A 10-15° difference in the contact angle, obtained for the samples, showed a better hydrophilicity of the collagen-coated nanofibers than the uncoated ones. Cellular investigations showed better adhesion, growth, and viability in the collagen-coated nanofibers than the uncoated nanofibers. The results showed also a high viability for the collagen-coated nanofiber by plasma method in the different times of 30 and 60 second but the collagen-coated nanofiber by plasma in 60s showed a better viability than the all samples. These collagen-coated nanofibers could well be used for tissue engineering.
References
- S. F. Williams, D. P. Martin, D. M. Horowiz, and O. P. Peoples, PHA applications: addressing the price performance issue: I. Tissue engineering, Int. J. Biol. Macromol. 25, 111-116 (1999).
- J. Liu, B. Zhao, Y. Zhang, Y. Lin, P. Hu, and C. Ye, PHBV and pre differentiated human adipose-derived stem cells for cartilage tissue engineering, J. Biomed. Mater. Res. A. 94, 603-610 (2010).
- W. Meng, S. Y. Kim, and J. Yuan, Electrospun PHBV/collagen composite nanofibrous scaffolds for tissue engineering, J. Biomater. Sci. Polym. Ed. 18, 81-94 (2007).
- A. Ndreu, L. Nikkola, H. Ylikauppila, N. Ashammakhi, and V. Hasirci, Electrospun biodegradable nanofibrous mats for tissue engineering, Nanomedicine (Lond) 3, 45-60 (2008).
- G. Torun Köse. Tissue engineering of bone using collagen and PHBV matrices, Tech. Health Care10, 3-4 (2002).
- C. Gerard, C. Catuogno, and C. Amargier-Huin. The effect of alginate, hyaluronate and hyaluronate derivatives biomaterials on synthesis of non-articular chondrocyte extracellular matrix, J. Mater. Sci. Mater. Med. 16, 541-551 (2005).
- D. Li and Y. N. Xia. Electrospinning of nanofibers: Reinventing the wheel? Adv. Mater. 16, 1151-1170 (2004).
- Z. M. Huang, Y. Z. Zhang, M. Kotaki, and S. Ramakrishna. A review on polymer nanofibers by electrospinning and their applications in nanocomposites, Compos Sci Technol. 63, 2223-2229 (2003).
- L. A. Smith and P. X. Ma. Nano-fibrous scaffolds for tissue engineering, Colloids. Surf. B Biointerfaces 39, 125-132 (2004).
- F. Yang, R. Murugan, S. Wang, and S. Ramakrishna. Electrospinning of nano/micro scale poly(L-lactic acid) aligned fibers and their potential in neural tissue engineering, Biomaterials 26,2603-2612 (2005).
- T. Ito, T. Nakamura, and K. Suzuki. Regeneration of hypogastric nerve using a polyglycolic acid (PGA)-collagen nerve conduit filled with collagen sponge proved electrophysiologically in a canine model, Int. J. Artif. Organs. 26, 245-256 (2003).
- T. A. Kapur, and M. S. Shoichet. Chemically-bound nerve growth factor for neural tissue engineering applications, J. Biomater. Sci. Polymer. Ed. 14,383–394 (2003).
- H. W. Lu, Q. H. Lu, W. T. Chen, H. J. Xu , and J. Yin. Cell culturing on nanogrooved polystyrene petri dish induced by ultraviolet laser irradiation, Mater. Lett. 58, 29-32 (2004).
- G. Roucoules, T. Mathia, and P. Lanteri. Hydrophobic mechano chemical treatment of metallic surfaces. Wettability measurements as means of assessing homogeneity, Adv. Colloid. Interface Sci. 97, 177-201 (2002).
- K. M. Hay, M. I. Dragila, and J. Liburdy. Theoretical model for the wetting of a rough surface, J. Colloid. Interf. Sci. 325, 472-477 (2008).
- U. Kogelschatz. Dielectric barrier discharges: their history, discharge physics and industrial applications, Plasma Chem. Plasma 23, 1-46 (2003).
- A. L. Kuzmichev. Ion plasma sources based on a microwave oven Instrum, Exp. Tech. 37, 648-653 (1994).
- V. Asmussen. Electron cyclotron resonance microwave discharge for etching and thin film deposition, J. Vac. Sci. Technol. 7, 883-889 (1989).
- C. Takahashi, Y. Jin, K. Nishimura, and S. Matsuo. Anisotropic etching of Si and WSiN using ECR plasma of SF6-CF4 gas mixture, Jpn. J. Appl. Phys. 39, 3672-3676 (2000).
- M. Jäger, M. Sager, A. Knipper, O. Degistirici, J. Fischer, G. Kögler, P. Wernet, and R. Krauspe. In vivo and in vitro bone regeneration from cord blood derived mesenchymal stem cells, Orthopade. 33(12), 1361-1372 (2004).
- G. Kögler, S. Sensken, and J. A. Airey. A new human somatic stem Cell from placental cord blood with intrinsic pluripotent differentiation potential, J. Exp. Med. 6, 123–135 (2004).
- G. Kögler, T. F. Radke, and A. Lefort. Cytokine production and hematopoiesis supporting activity of cord blood–derived unrestricted somatic stem cells, Exp. Hematol.33, 573-583 (2005).

This work is licensed under a Creative Commons Attribution 4.0 International License.
![]()
A New Edition of Web of Science
Journal Impact Factor
2022: 0.5
Five Year: 0.8
Journal is Indexed in

Cabells Whitelist
![]()


