Evaluation of Rate Coefficients and Diffusion Coefficients of Evaporated n-Heptane using RF-GC Methodologies
Khalisanni Khalid
Department of Chemistry, Faculty of Science, University of Malaya, 50603 Kuala Lumpur (Malaysia).
The cases of environmental contamination and toxicity originated from liquid pollutants are increasing from time to time. A fast and accurate technique is needed to study the physicochemical properties of respective liquid pollutants. Reversed-flow gas chromatography, which is a sub-technique of inverse gas chromatography, is an experimental arrangement simulating a simple model for the action of liquid pollutants in laboratory scale. By using a commercial gas chromatograph and an appropriate mathematical analysis, kinetic parameters such as rate coefficients, kc and diffusion coefficients, D of analyzed liquid were calculated. These physicochemical properties of the liquid experimented will contribute to the references for future research in the area of environment, food, agriculture as well as physical sciences.
KEYWORDS:Chromatography; Diffusion Coefficients; Evaporation; Rate Coefficients
Download this article as:| Copy the following to cite this article: Khalid K. Evaluation of Rate Coefficients and Diffusion Coefficients of Evaporated n-Heptane using RF-GC Methodologies. Orient J Chem 2011;27(2). |
| Copy the following to cite this URL: Khalid K. Evaluation of Rate Coefficients and Diffusion Coefficients of Evaporated n-Heptane using RF-GC Methodologies. Orient J Chem 2011;27(2). Available from: http://www.orientjchem.org/?p=24910 |
Introduction
Evaporation of n-hexane is a vital ecological fate for compounds introduced into human, freshwater and marine environments by accidental spills, industrial effluents, or introduced directly into the air from industrial unit processes such as bioreactors and cooling towers1. The n-hexane evaporates off to the atmosphere, contributes to the air pollution. The acute toxicity of n-heptane is relatively low, although it is a mild anesthetic. Inhalation of high concentrations produces first a state of mild euphoria, followed by somnolence with headaches and nausea. The long-term toxicity of n-heptane in humans is well known; however the physicochemical properties (such as rate and diffusion coefficients) during transportation of the molecules to the environment are less described2.
The application of RF-GC concerning on analysis of liquid pollutants was first reported by Karaiskakis3. In the research, n-heptane was one of the interest liquids under study but the diffusion coefficient values of the samples were not conformed to the theoretical ones which gave more than 20% deviations. The authors come to the conclusion that the equilibrium at the liquid-gas interphase leads to profound disagreement with the experimental evidence. On the other hand, in 2004, Kwon has reported the diffusion coefficient values of n-heptane into air by using open-tube evaporation method4. The deviation between experimental and theoretical diffusion coefficient values gave less than 5%. However, the similarity of these reported research was the determination of diffusion coefficients of n-heptane were restricted within the temperature ranged of 20°C to 30°C, whilst in the industries itself, such as boilers, bioreactors and cooling towers, the activation temperatures might archived to 40°C and more.
Concerning to the case studies mentioned above, the aim of the research was to determine the rate and diffusion coefficients of n-heptane within the temperature ranged of 40°C to 90°C with 0.5% deviation (or less) assisted by RF-GC techniques.
Experimental
In this type of chromatography, the column was unfilled with any material and sampling process was carried out by reversing of the carrier gas from time to time producing sample peaks. Selected liquid pollutants of 99.99% purity (MERCK) will be used as solute, while carrier gas was nitrogen of 99.99% purity. After the injection of 1 cm3 s-1 of liquid pollutant at atmospheric pressure and selected temperature, a continuous concentration–time curve was recorded passing through a maximum and then declining with time. By means of a six-port valve, the carrier gas flow direction is reversed for 5 s, which was a shorter time period than the gas hold-up time in both column sections l and l’, and then the gas was again turned to its original direction. This procedure creates extra chromatographic peaks (sample peaks) superimposed on the continuous elution curve. This was repeated many times during the experiment lasting a few hours. The height, h of the sample peaks from the continuous signal, taken as baseline, to their maximum was plotted as ln (h¥–h) versus time, giving a diffusion band, whose shape and slope both depend on vessel L which is empty, as well as on the geometric characteristics of the vessel and the temperature. In all experiments, the pressure drop along l + l’ will negligible, while the carrier gas flow-rate will keep constant (1.0 cm3 s-1).
Results and Discussion
The results obtained from the preliminary experiments were evaluated for physicochemical quantities of n-heptane.
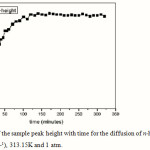 |
Figure 1: The rise of the sample peak height with time for the diffusion of n-heptane vapor into nitrogen (v=cm3 s-1), 313.15K and 1 atm. |
In Figure 1, the height, h of the sample peaks as a function of the time t0, when the flow reversal was made, was plotted on a semilogarithmatic scale5. It shows the steep rise and then the leveling off with time of the sample peak height. As an example using equations,
![]()
![]()
Where
h∞ = maximum height of peak (cm)
h = peak height (cm)
kc = rate coefficient (cms-1)
D =diffusion coefficient (cm2s-1)
L = length of column (cm)
t0 = initial time (minute)
c0 = initial concentration (moldm-3)
v = carrier gas flow rate (cm3s-1)
The equations above were derived from Katsanos6 to analyze the experimental findings; the data on Figure 1 were treated as follows. Iterated some points, which correspond to small times, the rest of the experimental points were plotted according to Equation 1, as shown in Figure 2.
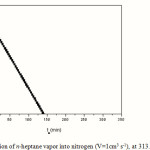 |
Figure 2: Diffusion of n-heptane vapor into nitrogen (V=1cm3 s-1), at 313.15K and 1atm. |
As infinity value h¥was taken the mean of the values found in the time interval, which differed little from one another. From the slope of this plot, which was equal to -2(kcL+D)/L2, according to Equation 1, using the theoretically calculated value of 0.0799 cm2 s-1, and the actual value of L (28.5cm), a value of 279.40 cm s-1 for kc, was calculated. This approximate value was used to plot all but the few point closed to h¥according to Equation 2 as shown in Figure 3
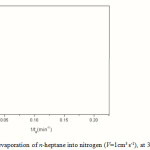 |
Figure 3: Data from evaporation of n-heptane into nitrogen (V=1cm3 s-1), at 313.15K and 1atm |
From the slope of this latter plot, a value of 0.0798 cm2 s-1 for D was found. If this is combined with the slope of the previous plot (Figure 2), a second value for kc= 279.40 cm s-1 was calculated and further used to re-plot the data according to Equation 2. The new value for D found coincides with the previous one (0.0799 cm2 s-1), and thus the iteration procedure must be stopped.
Table 1: Rate coefficients for evaporation of pure liquid and diffusion coefficients of vapors into nitrogen at 1atm
|
Liquid |
T, K |
kc, cm s-1 |
This work D, cm2 s-1 |
Theoretical D, cm2 s-1 |
Deviation (%) |
|
n-Heptane |
313.15 |
279.40±0.16 |
0.0798±0.0009 |
0.0799 |
0.04 |
|
|
323.15 |
293.39±0.17 |
0.0846±0.0004 |
0.0844 |
0.20 |
|
|
333.15 |
308.57±0.12 |
0.0890±0.0004 |
0.0890 |
0 |
|
|
343.15 |
324.94±0.17 |
0.0937±0.0007 |
0.0937 |
0 |
|
|
353.15 |
342.01±0.18 |
0.0986±0.0003 |
0.0986 |
0 |
|
|
363.15 |
362.22±0.12 |
0.1035±0.0016 |
0.1035 |
0 |
Table 1 summarizes the results obtained with the pure liquid studied. In the same table, the diffusion coefficients determined here were compared with those calculated theoretically. As one can see from the Table 1, the D values determined in this work were very close to the theoretical ones. The deviation given in the last column was the accuracy of the experimental values from those calculated theoretically7:
Deviation (%) = 100[(Dfound–Dtheory)/Dfound]
With no exception, this accuracy is better than 0.5% in all cases and indicated that investigation of liquid pollutants using reversed-flow gas chromatography (RF-GC) is of great significance in environmental science8. However, the comparison of experimental and literature values is impossible because the experimental temperatures, column length, gas flow rate and pressure are varies9. The findings of these evaporated liquid were unattainable for the experimental temperature ≥ 100°C because the boiling temperature of this liquids is merely more than 90°C.
Evaporation of chemicals from water bodies to the atmosphere can be an important environmental pathway for certain pollutant liquids. The transfer rate of pollutants from the air onto the sea surface depends on rate coefficients and diffusion coefficients in the gas phase. The chemical interaction involves measurement of the rate of liquid loss into a gas stream flowing horizontally across the liquid surface. In the majority of these techniques relative evaporation rates, which cannot be related to the physical properties of the evaporating species, as well as evaporation halftimes are measured. Thus, this relative new technique of reversed-flow gas chromatography (RF-GC) is suitable to study various physicochemical measurements, such as of rate coefficients and diffusion coefficients for the evaporation of pure liquid10.
Conclusions
From the findings of this research, it can be concluded that the equilibrium at the liquid-gas interphase leads to profound agreement with the experimental evidence
Acknowledgements
The author is indebted to University Malaya, who supported the research project and Ministry of Science and Technology Malaysia (MOSTI) for the scholarship. Last but not least, special thanks to the staff from Department of Chemistry, University of Malaya for their technical support.
References
- Robert S. G. Addiction, 99, 686 (2004)
- Karaiskakis G. and Katsanos N. A. J. Phys. Chem., 88, 3674 (1984)
- Kwon K. C. Ibrahim T. H. Park Y. K. and Simmons C. M. Adv. Environ. Res., 8, 667 (2004)
- Katsanos N. A. Khan A. R. Dimitrios G. and Karaiskakis G. J. Chrom. A, 934, 31 (2001)
- Khalisanni K, Rashid A. K. and Sharifuddin M. Z. Am. J. Applied Sci., 8(5), 428, (2011)
- Hathaway G. J. Proctor N. H. Hughes J. P. and Fischman M. Proctor and Hughes’ chemical hazards of the workplace. New York, Van Nostrand Reinhold. (1991)
- Karaiskakis G. Agathonos P. Niotis, A. and Katsanos N. A. J. Chrom. A, 364, 79 (1986)
- Karaiskakis G. and Dimitrios G. J. Chrom. A, 1037, 147 (2004)
- Dimitrios G. Khan A. R. and Karaiskakis G. AIChE, 52, 2381 (2006)
- Katsanos N. A. J. Chrom. A, 969, 3 (2002)

This work is licensed under a Creative Commons Attribution 4.0 International License.
![]()
A New Edition of Web of Science
Journal Impact Factor
2022: 0.5
Five Year: 0.8
Journal is Indexed in

Cabells Whitelist
![]()


