Early Stages of Cobalt-Copper Alloys Electrodeposition Onto Fluorine-Doped Tin Oxide Electrodes in Sulfate Solution
L. Mentar
Laboratoire de Chimie, Ingénierie Moléculaire et Nanostructures, Université F. Abbas-Sétif, 19000 Sétif Algérie.
The electrocrystallization process of Co-Cu alloy thin films deposited on a fluorine-doped tin oxide (FTO)-coated conducting glass substrate in sulfate solution was studied using cyclic voltammetry and chronoampermetry techniques. The results clearly show that the potential of Co-Cu dissolution and their positive shifts depend on the cathodic limit and reveal a variation of the deposit composition when switching potential is varied. From the analysis of the current transients on the basis of the Scharifker-Hills model, it is found that nucleation mechanism is instantaneous with a typical three-dimensional (3D) nucleation and growth process. A strong dependence of the number of active sites N0 with applied potential is observed on FTO surface.
KEYWORDS:Electrodeposition; Co–Cu alloy; cyclic voltammetry; chronoamperometry
Download this article as:| Copy the following to cite this article: Mentar L. Early Stages of Cobalt-Copper Alloys Electrodeposition Onto Fluorine-Doped Tin Oxide Electrodes in Sulfate Solution. Orient J Chem 2011;27(2). |
| Copy the following to cite this URL: Mentar L. Early Stages of Cobalt-Copper Alloys Electrodeposition Onto Fluorine-Doped Tin Oxide Electrodes in Sulfate Solution. Orient J Chem 2011;27(2). Available from: http://www.orientjchem.org/?p=24804 |
Introduction
The electrochemical deposition of metals and alloys on semiconductors substrates has received considerable attention from both fundamental and applied viewpoints [1–3]. This deposition of metallic films on semiconductors is usually performed in a vacuum from the vapor phase deposition techniques such as molecular beam epitaxy (MBE) or sputtering. Electrochemical deposition represents an alternative approach for the deposition of these films on semiconductor surfaces. The formation of these metallic phases requires a study of the nucleation and growth mechanisms and the influence of parameters such as potential and chemical composition of the solution. The deposition process is characterized by the voltammetric technique, and the current-time transient follows a potential step that providing an in situ measurement of the deposition process since the current is proportional to the deposition rate. The chronoamperometric technique is an excellent choice for the study of the electrocrystallization mechanism because, using the appropriate models, it offers information on the nucleation process that is usually not available with other techniques.
The early stages of an electrochemical reaction involving phase formation are usually associated with 2D or 3D nucleation processes. Several reports have been published on this subject, and few models have been proposed for these processes [4-8]. Such three-dimensional nucleation model was proposed by Scharifker and Hills [9, 10]. This model was usually used because of its convenient diagnosis for nucleation mechanisms. According to this model, the nucleation process is generally described in terms either of instantaneous or of progressive nucleation. Instantaneous nucleation corresponds to fast growth of nuclei on many actives sites, all activated during the electro-reduction. Progressive nucleation corresponds to slow growth of nuclei on a small number of actives sites, all activated at the same time [11].
The copper and cobalt electrochemical nucleation and growth process onto semiconductors substrates has been widely studied. However, the study of electrocrystallization of Co-Cu thin films alloys has been considered little so far [12-15]. Consequently, the present paper gives the results of an investigation of the early stages of electrocrystallization of Co-Cu alloys thin films on fluor-tin-oxide (FTO) surface. This was performed in aqueous sulfate solution without additives using an electrochemical technique. The growth process was analyzed using Scharifker-Hills model.
Experimental
Co-Cu alloys thin films are grown by electrodeposition on FTO conducting glass substrates in single sulfate bath. Table 1 shows the bath composition and the electrodeposition conditions employed in the preparation of the films. All solutions were prepared from analytical grade reagents and bidistilled water. The conventional electrochemical measurements were taken using a glass cell consisting of a three-electrode assembly that was connected to VoltaLab 40 (PGZ301 & VoltaMaster 4) controlled by a personal computer. The counter electrode and the reference electrode are a platinum wire and a saturated calomel electrode (SCE), respectively. The working electrode was a polycrystalline fluorine-doped tin oxide (FTO)-coated conducting glass substrate with an exposed area of 1´2 cm2 (10–20 W cm-2 sheet resistance). The FTO substrates were first degreased in acetone and ethanol by ultrasonication for 15 min, and finally well rinsed with distilled water. All the experiments were performed in unstirred solutions. Solutions were aerated with nitrogen and the temperature of the bath was maintained constant in the 20–25°C range. Cyclic voltammetry technique was performed to obtain the electrochemical potentials for deposition and dissolution of the individual metal Co and Cu and for Co-Cu alloy. In order to investigate nucleation behaviors of Co-Cu alloys thin films at the initial deposition stages, the current densities were analyzed by using the models of Scharifker and Hills [9, 10] for three-dimensional (3D) islands growth under the diffusion-limited control.
Table 1: Electrolytes composition of the plantings baths.
|
0.5 M H3BO3 |
1 M Na2SO4 |
0.005 M CuSO4 |
0.25 M CoSO4 |
Bath |
| Operating conditions: | Temperature (° C)
pH Cathode Anode |
20 – 25
3.8 FTO Pt |
To define the major characteristics of the cobalt, copper and Co-Cu alloy deposition process, the CV technique was used. Fig. 1 shows the typical voltammograms of FTO electrode recorded in a Co, Cu and Co-Cu ions solutions. For all measurements, the potential scan was started from 0.6 V, in the negative potential direction up to -1.3 V, and then reversed to the starting potential at a scan rate of 20 mV s−1. Fig. 1a shows the cyclic voltammogram of a solution containing 0.005 M CuSO4 with a cathodic scan limit of -0.8 V. The apparent cathodic reduction peak and sharp anodic dissolution peak are observed at -0.343 and 0.024 V, respectively. In copper electrodeposition, the charge transfer step is fast and the rate of growth is controlled by the rate of mass transfer of copper ions to the growing centers. The consistency of CV behavior upon potential cycling indicates that the anodic stripping process completely removes Cu from the electrode surface. This behavior is in agreement with previous investigations on the electrodeposition of Cu onto FTO [16]. The data in Fig. 1a indicate the absence of an underpotential deposition peak, with Cu reduction occurring at significant overpotential to the Nernstian value. This is due to a weak deposit substrate interaction, and the early stages of the electrodeposition of Cu on FTO surfaces, correspond to a Volmer-Weber growth mechanism [17].Results and Discussion
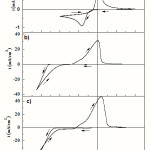 |
Figure 1: A cyclic voltammogram obtained from (a) 0.005 M CuSO4, (b) 0.25 M CoSO4,and c) 0.25 M CoSO4 + 0.005 M CuSO4 with a cathodic scan limit of -1.3 V vs. SCE, pH 3.8 at scan rate of 20 mV s−1. The supporting electrolyte is 1 M Na2SO4 + 0.5 M H3BO3 (pH=3.8). |
For the cyclic voltammogram obtained in the Co free solution (0.25 M CoSO4), shown in Fig. 1b, during the direct scan, it is possible to note that the increasing of current begins at -1.024 V, this increasing current is due to electrodeposition of Co and hydrogen evolution. In the reverse potential scan, we observe first a very small shoulder due to the oxidation of hydrogen followed by an intense peak at potentials around 0.0 V corresponding to the dissolution of the previously deposited Co. This process of Co electrodeposition has usually been reported in literature [18-22].
Fig. 1c shows the cyclic voltammogram of the FTO electrode recorded in a Co-Cu solution at cathodic scan limit of – 1.3 V. In the direct scan, the beginning of the current increased was detected at -0.14 V, which is characteristic of the overpotential deposition process of Cu onto FTO surfaces. Due to lower Cu2+ concentration, the deposition is diffusion-limited over a wide potential range from about -0.325 V to the start of Co deposition at about -0.88 V. This difference in comparison with the cathodic peak of Co free solution is probably due to the fact that Co starts the deposition on the FTO pre-covered by Cu. This is similar to the case of the FTO-coated glass substrates which has been covered with the Cu after the deposition of the Co. The deposition overpotential of Co on Cu is smaller than that on the FTO surface because of the comparable crystallographic structures between Co and Cu. On the reverse scan; two peaks are observed at -0.29 and 0.13 V. At -0.29 V a shoulder is observed which corresponds to the oxidation of hydrogen [18-22]. This is followed by a strong peak at 0.13 V which is related to the dissolution of the Co-Cu alloy. The alloy dissolution peak appears at more noble potential than those of the peaks attributed to Co and Cu. The existence of the alloy peak is associated to various kinetic factors which cause the shift of the peak away from its reversible position in the positive direction [23, 24]. The relative height of the two oxidation peaks of Figs. 1b and c depends on the deposition potential. A current crossover is therefore observed in all curves and the appearance of such hysteresis loop is a characteristic feature of a nucleation and growth process [25].
To identify the oxidation peaks, the voltammetric stripping curves recorded at 20 mVs-1 with different cathodic scan limits for a FTO electrode in 0.25 M CoSO4 + 0.005 M CuSO4 with Na2SO4 + 0.5 M H3BO3 (pH =3.8), are displayed in Fig. 2. The cathodic scan limits values were chosen to be within the zone where the reduction processes are observed in the voltammograms. The number of anodic peaks is related to the switching potentials. Effectively, only one peak a2 corresponding to-0.7 and -0.9 V vs. SCE is observed. The position of this peak is related to the dissolution of copper [26]. Moreover at -1.0 and -1.1 V vs. SCE, two anodic peaks a1 and a2 are observed. By comparing these cyclic voltammetric curves with of the oxidation of pure cobalt shown in Fig. 1b, it could be concluded that peak a1 corresponds to the cobalt oxidation. At higher applied potentials, -1.2 and -1.3 V, only one higher peak is observed (a3). The peak corresponds to cobalt-rich phases. In all cases, the anodic peaks shifted slightly in the positive direction. The cathodic and anodic current density increased with increasing value of switching potential, which indicated that more cobalt deposits were obtained in the cathodic region with a higher negative applied potential. Adjustment of the applied current led to the preparation of Co-Cu films with variable metal percentages.
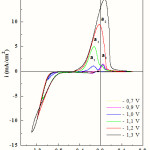 |
Figure 2: Voltammetric curves of Co-Cu alloy deposition and dissolution from 0.25 M CoSO4 + 0.005 M CuSO4 with 0.5 M H3BO3 (pH=3.8) electrolytic solutions with different cathodic potentials. |
Chronoamperometry is commonly used to study the electrochemical nucleation mechanism of metal and alloy electrodeposition. In chronoamperometry measurements, the potential is stepped from the open circuit potential to a potential at which the deposition of Co-Cu occurs. A set of current transients obtained at different potentials during Co-Cu electrodeposition on FTO coated glass substrates are shown in Fig. 3. As it could be seen, all transients present the same behavior with well-defined current maxima. At higher overpotentials, the current transient maxima, imax, were more defined but shifted toward short time, tmax. In all transients, the rapid surge and exponential decay of the current at the onset of the potential step was due to the double layer charging, and then, the rising current arose from the birth and growth of the new phase and/or the increasing number of nuclei. As these grew, the coalescence of neighboring diffusion fields with localized spherical symmetry gave rise to a current maximum. These curves present a typical response of 3D multiple nucleations with diffusion controlled growth [9, 10]; taking into account the eventual overlap of the diffusion zone and considering the development of nucleation exclusion zones around already established nuclei. The characteristic parameters obtained from these current transients are presented in Table 2. From this latter table, it is evident that with increasing the deposition potential, the current maximum significantly increases, and shifts towards shorter times. Also, this behavior is typical for 3D electrochemical nucleation and growth of a new phase under the diffusion control. In addition, it was observed that after current maxima all the current transients decayed slowly and, for a longer time, almost merged into a common curve, which was caused by diffusion control and can be described by the Cottrell equation i ~ [27].
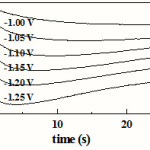 |
Figure 3: Current transients for Co-Cu electrodeposition on FTO-coated conducting glass substrates at the indicated final potentials. |
Table 2: Some kinetics parameters extracted from the analysis of current transients for deposition of Co-Cu onto FTO electrode.
|
– E (V) |
-imax (mA cm-2) |
tmax (s) |
10-5N0 (cm-2) |
| 1.05 | 19.06 | 13.71 | 1.21 |
| 1.10 | 24.66 | 09.37 | 1.55 |
| 1.15 | 30.03 | 07.17 | 1.78 |
| 1.20 | 35.54 | 05.40 | 2.24 |
| 1.25 | 42.65 | 04.00 | 2.84 |
According to the characteristic shapes of the current transients presented in Fig. 3, as a preliminary step, all current transients were presented in a nondimensional form, normalized current versus time plot [(i/imax)2 versus t/tmax] [9, 10]. A comparison of the theoretical lines with the experimental data was often used for the determination of the nucleation mechanism (the instantaneous or progressive process). For instantaneous nucleation,
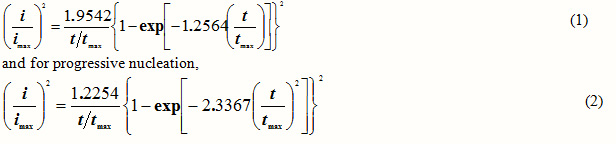
where imax and tmax are the current and time coordinates of the peaks, respectively. Fig. 4 shows the representative nondimensional plots obtained at different potentials during Co-Cu electrodeposition on FTO coated glass substrates in sulfate aqueous solution along with the theoretical curves for the limiting cases of instantaneous and progressive 3D nucleation with diffusion- controlled growth. In the studied potential range, the nucleation of the Co-Cu alloy follows the behavior of instantaneous nucleation mechanism, but with a non-negligible deviation from the theoretical model. In this case, all nuclei are formed immediately after the potential step is applied, and their number remains constant during the growth process. A similar behavior to that of Co-Cu alloy was found in sulfate electrolytes in absence [12] and in presence of citric acid [15].
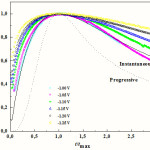 |
Figure 4: Reduced parameter plots for selected current transients for the deposition of Co-Cu shown in Figure. 3; also shown are the theoretical curves for progressive (dotted line) and instantaneous (solid line) nucleation. |
When instantaneous nucleation occurs, N is equal to N0 and can be determined by [9, 10]

where C the bulk concentration, zF the molar charge of electrodepositing species, M and r are the molecular weight and the density of deposited material, respectively.
The number of active nucleation sites (N0) at different potentials was calculated from this latter equation (Eq. 3) and the values thus obtained are given in Table 2. The N0 values are quite typical for an instantaneous type of nucleation, which is characterized by a small number of actives sites N0. The values of N0 for the nucleation of Co-Cu on FTO coated glass substrates listed in Table 2 were used to plot the dependence of ln N0 vs. E (Fig. 5). The values of N0 strongly depend on the final potential. In both cases, the N0 increases exponentially as the potential changes to more negative values. The exponential dependence of the nucleus density on potential suggests that thermal activation of nucleation sites is consistent with classical nucleation model [28] following the equation, where DGC is the work for critical nucleus formation; k is the Boltzmann constant, T the absolute temperature.
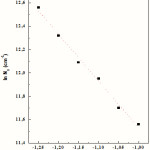 |
Figure 5: Plot of ln N0 vs. E for Co-Cu electrodeposition on FTO surfaces. Dotted line corresponds to the linear adjustment |
Conclusions
In this study we have presented an electrochemical nucleation and growth properties of cobalt-copper alloys on FTO surfaces in aqueous solution sulfate without complexing agent (pH 3.8). From voltammetry technique the overpotential of the cobalt deposition in presence of Cu is greater than the Co free solution. The dissolution peak attributed to Co-Cu phase is shifted towards the positive direction as the cathodic limit increased. In the potential range analyzed the voltammetric and chronoamperometric analyses have shown the existence of a typical nucleation and growth process. The deposition kinetics can be explained on the basis of an instantaneous 3D nucleation with hemispherical diffusion control of the growing clusters. The kinetic parameters were determined considering the Scharifker-Hills model. Under the used experimental conditions, the Co-Cu nuclei density is exponentially dependent on the potential and consequently confirmed the instantaneous character of the nucleation process.
References
- P. Allongue, E. Souteyrand, Electrochim. Acta., 34: 1717 (1989).
- P. Bindra, H. Gerischer, D. M. Kolb, J. Electrochem. Soc., 124: 1012 (1977)
- Y. Nakato, K. Ueda, H. Yano, H. Tsubomura, J. Phys. Chem., 92: 2316 (1988).
- M.E. Hyde, R.G. Compton, J. Electroanal. Chem., 549: 1 (2003).
- A. Milchev, L. Heerman, Electrochim. Acta., 48: 2903 (2003).
- E. Budevski, G. Staikov, W.J. Lorenz, Electrochim. Acta., 45: 2559 (2000).
- M. Palomar-Pardave, M. Miranda-Hernandez, I. Gonzalez, N. Batina, Surf. Sc., 399: 80 (1998).
- L. Heerman, A. Tarallo, J. Electroana. Chem., 470: 70 (1999).
- G. Gunawardena, G. Hills, I. Montenegro, B.R. Scharifker, J. Electroanal. Chem., 138: 225 (1982).
- B.R. Scharifker, G. Hills, Electrochim. Acta., 28: 879 (1983).
- A.I. Inamdar, S.H. Mujawar, P.S. Patil, Int. J. Electrochem. Sci., 2: 797 (2007).
- M. Gu, Electrochim. Acta ., 52: 4443 (2007).
- M. Gu, S.B. Yao, S.M. Zhou, Trans. Inst. Met. Finish.., 84: 196 (2006).
- T. Cohen-Hyams, W. D. Kaplan, D. Aurbach, Y. S. Cohen, J. Yahalom, J. Electrochem. Soc, 150: C28 (2003).
- T. Cohen-Hyams, Ph.D. dissertation, The Technion–Israel Institute of Technology, Haifa, 2003.
- M. R. Khelladi, L. Mentar, A. Azizi, A. Sahari, A. Kahoul, Mater Chem Phys, 115: 385 (2009).
- L. Huang, F.Z. Yang, S.K. Xu, S.M. Zhou, Trans. Inst. Met. Finish.., 84: 47 (2006).
- M.R. Khelladi, L. Mentar, A. Azizi, M. Boubatra, A. Kahoul, Mater Chem Phys, 122: 449 (2010).
- M. Palomar-Pardavé, B. Scharifker, E. M. Arce, M. Romero-Romo, Electrochim. Acta., 50: 4736 (2005).
- C.H. Rios-Reyes, L.H. Mendoza-Huizar, M. Rivera, J. Solid State Electrochem. 14: 659 (2010).
- A.E. Elsherief, J. Appl. Electrochem. 33: 43 (2003).
- J.T. Matsushima, F. Trivinho-Strixino, E.C. Pereira, Electrochim. Acta., 51: 1960 (2006).
- V.D. Jovic, R.M. Zenjnilovic, A.R. Despic, J.S. Stevanovic, J. Appl. Electrochem. 18: 511 (1988).
- S.S. Abd El-Rehim, S.M. Abd El-Wahab, S.M. Rashwan, Z.M. Anwar, J Chem Technol Biotechnol, 75: 237 (2000).
- R. Greef, R. Peat, L.M. Peter, D. Pletcher, J. Robinson, Instrumental Methods in Electrochemistry Ellis Horwood, Chichester, 1985, p.283.
- I. Bakonyi, J. Toth, LF. Kiss, E. Toth-Kadar, L. Peter, A. Dinia, J. Magn. Magn. Mater., 269: 156 (2004).
- Southampton Electrochemistry Group Instrumental Methods in Electrochemistry Horwood Publishing, UK, 2001, p. 309.
- E. Budevski, G. Staikov, W.J. Lorenz, “Electrochemical Phase Formation and Growth- An Introduction to the Initial Stages of Metal Deposition”, VCH, Weinheim, 1996.

This work is licensed under a Creative Commons Attribution 4.0 International License.
![]()
A New Edition of Web of Science
Journal Impact Factor
2022: 0.5
Five Year: 0.8
Journal is Indexed in

Cabells Whitelist
![]()


