Vibrational Spectroscopic Studies and Ab intio Calculations of N-methylacetamide
1Department of Physics, Fatima Mata National College, Kollam, Kerala (India).
2Department of Physics, Catholicate College, Pathanamthitta, Kerala (India).
3Department of Physics, TKM College of Arts and Science, Kollam, Kerala, (India).
Download this article as:
![]()
Fourier-transform-Raman and infrared spectrum of N-methylacetamide were recorded and analyzed. The vibrational wavenumbers were examined theoretically using the Gaussian03 set of quantum chemistry codes. The first hyperpolarizability, predicted infrared intensities and Raman activities are reported. The calculated first hyperpolarizability makes this compound an attractive object for future studies of nonlinear optics. The experimental frequencies are in agreement with the calculated scaled values.
KEYWORDS:FT-Raman; FT-IR; HF calculations; Acetamide
Introduction
Spectroscopic investigation of N-methylacetamide(NMA), which is considered a model for a peptide bond in proteins, can provide information about secondary structure of proteins in the gas phase as well as in solution. Numerous Infrared and Raman experiments have focused on the spectral region spanned by the three amide bands of NMA1-8 particularly in the easily dictable amide I regime that overlaps with the carbon-oxygen stretch. In liquid water, carbon-oxygen stretch responds to the presence of water molecules by forming hydrogen bonds, and the resulting frequency shift can be used to assess the dynamics of protein-solvent interactions . Similarly the amide II and amide III bands, which overlap with the NH in-plane wagging motion, can be used to describe the interaction between CO and NH, which are the backbone of a protein. And since the amide hydrogen can form a bond with the solvent, that is H2O…NH, corresponding frequency shifts provide further information on protein behavior in aqueous solution. Senthil kumar et al.9 studied electron density and energy decomposition analysis in hydrogen bonding complex of azabenzenes with water, acetamide and thioacetamide have been carried out to explore the controversy involved in the relative order of their stability in a systematic way. Jong et al.10 have studied experimentally the hydrogen bonding ability of azabenezene and methyl substituted azabenezene with thioacetamide, acetamide and water and concluded that the order of proton affinity is not same as those of the corresponding standard enthalpy. In the present study the IR, Raman and theoretical calculations of the frequencies for N-methylacetamide are reported.
Experimental
The FT-IR spectrum was recorded using a Perkin-Elmer FT-IR spectrometer. The spectral resolution was 4 cm-1. Standard KBr was used. The FT-Raman spectrum was obtained on a Bruker IFS 66V NIR-FT instrument equipped with a FRA 106 Raman module . An Nd/YAG laser at 1064 nm with an output on 300mw was used as the exciting source.
Computational Details
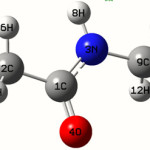
Calculations of N-methylacetamide are carried out with Gaussian 03 program11 using the Hartree-Fock/631G* basis set to predict the molecular structure and vibrational wave numbers. Molecular geometry was fully optimized by Berny’s optimization algorithm using redundant internal coordinates. Harmonic vibrational wave numbers are calculated using the analytic second derivatives to confirm the convergence to minima on the potential surface. The wave number values computed at the HF level contain known systematic errors due to the negligence of electron correlation12, and we henceS used the scaling factor value of 0.8929 for HF/6-31G* basis set. Parameters corresponding to optimized geometry of N-methylacetamide (Figure 1) is given in table 1. The absence of imaginary wave numbers on the calculated vibrational spectrum confirms that the structure deduced corresponds to minimum energy.
Results And Discussion
The observed Raman and IR bands with their relative intensities, calculated values and assignments are given in Table 2.
The observed IR bands with their relative intensities and calculated wave numbers and assignments are given in table. The NH stretching vibrations13,14 generally give rise to bands at 3500-3300 cm-1. In the present study, the NH stretching band has split in to a doublet 3294, 3100 cm-1 in the IR spectrum owing to the Davydov coupling between neighboring units. A similar type of splitting observed in acetanilide15,16 and N-methyl acetamide17 in the stretching band is attributed to the Davydov splitting. The splitting of about 194 cm-1 in the IR spectrum is due to strong inter molecular hydrogen bonding. Further more, the N-H stretching wave number is red-shifted by 204 cm-1 in the IR spectrum with a strong intensity from the computed wave number, which indicates the weakening of the N-H bond resulting in proton transfer18 to the neighboring oxygen atom O4. In N-mono substituted amides, the in-plane bending frequency and the resonance stiffened C-N bond stretching frequency fall close together and therefore interact. The CNH vibration where the nitrogen and hydrogen move in opposite direction relative to the carbon atom involves both NH bending and C-N stretching and absorbs19 strongly near 1550 cm-1. This band is very characteristic for mono substituted amides. The CNH vibration where the N and H atoms move in the same direction relative to the carbon atom gives rise19 to a weaker band near 1250 cm-1. In the present case the bands observed at 1563,1299 cm-1 in the IR spectrum and 1306 cm-1 in the Raman spectrum and at 1529, 1285 cm-1 (HF) are assigned as CNH bending modes .The out-of-plane NH wag absorbs at 629 cm-1 in the IR spectrum and at 630 cm-1 in Raman spectrum and theoretically at 618 cm-1.
In aromatic compounds, the asymmetric stretching vibrations19,20 of CH3 are expected in the range of 2905-3000 cm-1 and symmetric CH3 vibrations in the range of 2860-2870 cm-1. The first of these results from the anti symmetric stretching υasCH3 mode in which two C-H bonds of the methyl group are extending while the third one is contracting. The second arises from the symmetrical stretching υsCH3 in which all three of the C-H bonds extend and contract in phase. The asymmetric stretching modes of the methyl group are calculated to be 2965, 2950, 2936 and 2925 cm-1 and the symmetric mode at 2872, 2864 cm-1. The bands observed at 2946 and 2900 cm-1 in the IR spectrum are assigned as asymmetric and symmetric methyl modes, respectively. The band observed 2936 cm-1 in the Raman spectrum is assent as υasCH3.Two bendings can occur with in a methyl group. The first of these, the symmetrical bending vibration, involves the in-phase bending of the C-H bonds. The second, the anti symmetrical bending vibration, involves out-of –phase bending of the C-H bonds. The asymmetrical deformations are expected in the range20 1400-1485 cm-1. The calculated values of δasCH3 modes are at 1493, 1469, 1468, 1452 cm-1 and no bands are observed in the IR spectrum. In many molecules, the symmetric deformation δsCH3 appears with an intensity varying from medium to strong and expected in the region 1380 ± 25 cm-1. In this case δsCH3 is calculated at 1445, 1406 cm-1 theoretically and the band at 1412 in the IR spectrum, 1417 cm-1 in Raman spectrum are assigned as these modes20. The rocking modes of CH3 are expected in the region20 900-1200 cm-1. In the present case ρCH3 modes are calculated at 1178, 1141, 1080, 1069 cm-1. The bands observed at 1151, 1096, 1042 in the IR spectrum and at 1163 cm-1 in the Raman spectrum are assigned as rocking modes of the methyl group. The methyl torsion, often assigned20 below 400 cm-1.
The carbonyl group vibration gives rise to characteristic bands in vibrational spectra. The intensity of these bands can increase owing the conjugation or formation of hydrogen bonds. The increase in conjugation, therefore, leads to identification of IR bands. The carbonyl absorption21 υC=O of one membered ring occurs in the region 1658 cm-1 and in the present case, this band is observed in the IR spectrum at 1655 cm-1 and at 1663 cm-1 in the Raman spectrum and the theoretical value is at 1658 cm-1. The deformation bands of the C=O are also identified at 599 cm-1 in the IR spectrum and at 595, 521 cm-1 theoretically20.
The υCC is identified at 979 cm-1 theoretically and at 991 in the IR spetrum and at 990 cm-1 in the Raman spectrum. The νCN is identified in 849 (HF) and the observed bands are at 881 cm-1 (IR) and 865 cm-1 (Raman). The tortional vibrations are observed below 500 cm-1 .
 |
Scheme 1 Click here to View Scheme |
For the title compound the bond length C1-O4=1.2294A˚ and this value is in agreement with the reported value 1.203A0,1.2074Å22,23. The bond lengths, C1-C2=1.5056Å, is in agreement with the reported value 1.526Å and 1.522Å22,23. The bond lengths of C2-H5=1.0791, C2-H6=1.0822, C2-H5 = 1.0844, C9-H10= 1.0808, C9-H11=1.0801, C9-H12=1.0815Å and these values are in agreement with the reported values 1.081, 1.071Å22,23. Purkayastha and Chattopadhyay24 reported C1-N3, C9-N3 bond lengths as 1.3270, 1.4Å for benzothiazole and 1.3503, 1.407Å for benzimidazole compounds. For the title compound the corresponding values are 1.3524 and 1.4535Å. At C1 the bond angles are (C2-C1-N3, C2-C1-O4, N3-C1-O4) 116.5, 121.7, 121.7 and the deviation from 120˚ shows that the interaction between CH3 and NH group. The C-C and C-H bond lengths are in agreement with the reported values25,26. The calculated first hyperpolarizability of the title compound is 0.467 × 10⁻³⁰ esu and is an attractive object for future studies of nonlinear optics.
Conclusion
The IR and Raman spectrum of N-methylacetamide were recorded and analysed. The frequencies are calculated theoretically using Gaussian03 software package. The calculated frequencies are found to be in agreement with the experimental values .The geometrical parameters of the title compound are in agreement with the reported values of similar compounds.
Table 1: Optimized geometrical parameters of the title compound
| Bond lengths (A˚) | Bond angles (˚) | Dihedral angles (˚) |
| C1-C2 1.5056
C1-N3 1.3524 C1-O4 1.2294 C2-H5 1.0791 C2-H6 1.0822 C2-H7 1.0844 N3-H8 0.9903 C9-N3 1.4535 C9-H10 1.0808 C9-H11 1.0801 C9-H12 1.0815 |
C2-C1-N3 116.5
C2-C1-O4 121.7 N3-C1-O4 121.7 C1-C2-H5 109.0 C1-C2-H6 112.5 C1-C2-H7 109.4 H5-C2-H6 109.4 H5-C2-H7 108.0 H6-C2-H7 108.4 C1-N3-H8 119.6 C1-N3-C9 121.6 H8-N3-C9 118.8 N3-C9-H10 110.7 N3-C9-H11 108.8 N3-C9-H12 111.0 H10-C9-H11 109.1 H10-C9-H12 108.1 H11-C9-H12 109.0
|
D(3,1,2,5) -151.2
D(3,1,2,6) -29.6 D(3,1,2,7) 90.9 D(4,1,2,5) 30.2 D(4,1,2,6) 151.8 D(4,1,2,7) -87.6 D(2,1,3,8) 1.3 D(2,1,3,9) -178.1 D(4,1,3,8) 179.8 D(4,1,3,9) 0.5 D(1,3,9,10) -57.4 D(1,3,9,11) -117.3 D(1,3,9,12) 62.7 D(8,3,9,10) 123.2 D(8,3,9,11) 3.3 D(8,3,9,12) -116.7 |
Table 2: Infrared, Raman spectral data and calculated wave numbers and band assignments for N-methyl acetamide
| Assignments | |||||
| 3498 | 42.02 | 49.23 | 3294 | 3329 | υNH |
| 2965 | 8.42 | 64.90 | – | – | υasCH3 |
| 2950 | 26.00 | 70.83 | – | – | υasCH3 |
| 2936 | 32.95 | 54.64 | 2946 | 2936 | υasCH3 |
| 2925 | 18.59 | 62.64 | – | – | υasCH3 |
| 2872 | 37.62 | 115.38 | 2900 | – | υsCH3 |
| 2864 | 8.09 | 116.92 | – | – | υsCH3 |
| 1658 | 248.28 | 3.58 | 1655 | 1663 | υC=O |
| 1529 | 288.20 | 11.42 | 1563 | – | δNH |
| 1493 | 9.51 | 9.33 | – | – | δasCH3 |
| 1469 | 17.86 | 6.02 | – | – | δasCH3 |
| 1468 | 2.70 | 34.41 | – | 1470 | δasCH3 |
| 1452 | 4.13 | 10.55 | – | – | δasCH3 |
| 1445 | 52.87 | 13.21 | – | – | δsCH3 |
| 1406 | 33.91 | 3.98 | 1412 | 1417 | δsCH3 |
| 1285 | 119.19 | 2.30 | 1299 | 1306 | δNH |
| 1178 | 4.51 | 6.42 | 1151 | 1163 | ρCH3 |
| 1141 | 1.65 | 4.03 | – | – | ρCH3 |
| 1080 | 15.58 | 1.97 | 1096 | 1001 | ρCH3 |
| 1069 | 16.20 | 1.02 | 1042 | – | ρCH3 |
| 979 | 14.53 | 1.72 | 991 | 990 | υC-C |
| 849 | 3.76 | 9.57 | 881 | 865 | υCN |
| 618 | 17.76 | 5.86 | 629 | 630 | γNH |
| 595 | 22.01 | 4.79 | 599 | – | γC=O |
| 521 | 157.06 | 0.60 | – | – | γC=O |
| 412 | 11.63 | 1.08 | 440 | 441 | t=C=O |
| 256 | 8.62 | 0.45 | – | 290 | tCH3 |
| 184 | 5.30 | 0.14 | – | – | tCH3 |
| 50 | 1.16 | 0.28 | – | – | tNH |
|
37 |
1.00 | 0.59 | – | – | tNH |
References
- Ataka, S., Takeuchi, H., and Tasumi, M.J, J. Mol. Struct. 113: 147 (1984).
- Mayne, L.C., and Hudson, B.J., Phys. Chem. 95: 2962 (1991).
- Chen, X.G., Stenner, R.S., Asher, S.A., Mirkin, N.G., and Krimms, S.J., Phys. Chem. 99: 3074 (1995).
- Torri, H., Tasumi, T., and Tasumi, M.J., J. Raman Spectrosc. 29: 537 (1998).
- Kubelka, J., and Keiderling, A.J., Phy. Chem. A 105: 10922 (2001).
- Cueval, G., Krishnan, R., Madrid, G., and Hagler, A.T., Phys. Chem. 4: 1490 (2002).
- Papamokar, G.V., and Demetropovlos, I.N.J., Phys. Chem. A 108: 7291 (2004).
- Zhang, R., Li, H.R., Lei, Y., and Han, S.J.J., J. Mol. Struct. 693 : 17 (2004).
- Senthikumar, L., Ghanty, T.K., and Crhosh, S.K., J. Phys. Chem. A 109: 7575 (2005).
- Jong, H.M., Lei, J., Kun-Jung, K., Hee, J.J., Young-Sang, C., Jeicnghec, P., and Chang-Ju, Y.J., Phys. Chem. A 108: 921 (2004).
- Frisch, M.J., et al. Gaussian03, Revision C.02, Gaussian, Inc., Walling ford CT (2004).
- Foresman, J.B., and Frisch, E., in: Exploring Chemistry will Electronic Structure Methods: A Guide to using Gaussian, Gaussian Pittsburg, PA (1996).
- Bellamy, L.J., The IR spectra of complex molecules, John Wiley and Sons, New York (1975).
- Spire, A., Barthes, M., Hallouai, H., and De Nunzio, G., Physics D 137: 392 (2000).
- Edler, J., Pfister, R., Pouthier, V., Falvo, C., and Hamm, P., Phys. Rev. Lett. 93: 106405 (2004).
- Edler, J., Hamm, P., and Scott, A.C., Phys. Rev. Lett. 88: 067403 (2002).
- Edler, J., and Hamm, P., Phys. Rev., B69: 214301 (2004).
- Barthes, M., DeNunzio, G., and Ribet, G., Synth. Met. 76: 337 (1996).
- Colthup, N.B., Daly, L.H., and Wiberly, S.E., Introduction to Infra red and Raman Spectroscopy, Academic Press, New York (1975).
- Roeges, N.P.G., A Guide to Complete Interpretation of Organic Structures, Wiley New York (1994).
- Silverstein, R.M., Bassler, G.C., and Morill, T.C., Spectrometric Identification of Organic Compounds, 5th.ed.John Wiley and sons Inc. Singapore (1991).
- Naverette, J.T.L., Bencivenni, L., Ramondo, F., Hernandez, V., and Ramirez, F.J., J. Mol. Struct (Theochem), 330: 261 (1995).
- Van Alsenoy, C., Kulp, S., Siam ,K., Klimkowski, V.J., Whank, J.D.E., and Schafer, L., J. Mol. Struct. (Theochem),181: 169 (1998).
- Purkayastha, P., and Chattopadhyay, N., Phys. Chem. Phys. 2: 303 (2003).
- Lijima, K., Tanaka, K., and Onuma, S., J. Mol. Struct. 246: 257 (1991).
- Lijma, K., and Beagley, B., J. Mol. Struct. 248: 133 (1991).


![]()


