Temperature Effect, Activation Energies and Thermodynamics of Adsorption of ethyl 2-(4-(2-ethoxy-2-oxoethyl)-2-pTolylquinoxalin-1(4H)-yl)Acetate on Cu in HNO3
B. Hammouti1*, A. Zarrouk1, S. S. Al-Deyab2 and I. Warad2
1LCAE-URAC18, Faculté des Sciences, Université Mohammed Ier B.P. 717, 60000 Oujda, (Morocco). 2Department of Chemistry, College of Science, King Saud University, B.O. 2455, Riaydh 11451, (Saudi Arabia).
Article Received on :
Article Accepted on :
Article Published : 05 Mar 2011
The detailed study of corrosion behaviour of copper in 2M nitric acid solution in the presence and absence of 2-(4-(2-ethoxy-2-oxoethyl)-2-p-tolylquinoxalin-1(4H)-yl)acetate (Q1) was investigated using weight loss method at various temperatures from 303 to 343 K. The inhibitor showed 97% inhibition efficiency at its optimum concentration 10-3M at 303K and decreased at higher temperatures. The thermodynamic parameters such as, equilibrium constant, adsorption heat and adsorption entropy were obtained. The various parameters of activation determining the kinetic data such as energy, enthalpy and entropy at different concentrations of the inhibitor were evaluated and discussed. The adsorptive behaviour of Q1 followed Langmuir-type isotherm. The standard free energies of adsorption were negative at different temperatures tested, reûecting better inhibition performance.
KEYWORDS:Corrosion; Inhibition; Adsorption; quinoxaline; Activation
Download this article as:| Copy the following to cite this article: Hammouti B, Zarrouk A, Al-Deyab S. S, Warad I. Temperature Effect, Activation Energies and Thermodynamics of Adsorption of ethyl 2-(4-(2-ethoxy-2-oxoethyl)-2-pTolylquinoxalin-1(4H)-yl)Acetate on Cu in HNO3. Orient J Chem 2011;27(1). |
| Copy the following to cite this URL: Hammouti B, Zarrouk A, Al-Deyab S. S, Warad I. Temperature Effect, Activation Energies and Thermodynamics of Adsorption of ethyl 2-(4-(2-ethoxy-2-oxoethyl)-2-pTolylquinoxalin-1(4H)-yl)Acetate on Cu in HNO3. Available from: http://www.orientjchem.org/?p=11636 |
Introduction
The effect of temperature on the corrosion inhibition of various organic compounds was treated by several works [1-4]. Investigations attempt to describe the corrosion phenomena of metals in aggressive media in the presence and absence of inhibitor. In acid corrosion, the inhibitors generally adsorb on the metal surface, forming a structural change of the double layer limiting the rate of the electrochemical partial reaction. Amin et al. [5] stated that temperature dependence of the inhibitor efficiency and the comparison of the values of effective activation energy of the corrosion process both in the absence and in the presence of inhibitors lead to some conclusions concerning the mechanism of the inhibiting action. Temperature increase leads to a decrease in the inhibition efficiency, with the resulting variation of the effective activation energy value (the latter is in general higher than that in the inhibitor’s absence) often interpreted as an indication of the formation of an adsorptive film of a physical (electrostatic) character. The opposite dependence (lower activation energy in an inhibited solution) demonstrates that a chemisorptive bond between the organic molecules and the metal surface is probable [5].
The most effective and efficient inhibitors are organic compounds having heteroatoms and/or p bonds in their structures. The adsorption of inhibitor is influenced by the electronic structure of the inhibiting molecules [6-9] and also by the steric factors, aromaticity, and electron density at the donor atoms and also by the presence of functional groups.
N-heterocyclic compounds are well known to exhibit inhibitory effect against corrosion of various metals [10–12]. Adsorption of inhibitors is facilitated by the nature of molecular structure to create a barrier against aggressive ions to reach metallic surface. It is the principal action of organic inhibitors to minimize or stop the corrosion process. Some studies have presented quinoxaline compounds as effective corrosion inhibitors of metals in acid solution [10-15]. This paper is aimed to develop a detailed study on the temperature effect on the corrosion of copper in HNO3 at different concentrations of 2-(4-(2-ethoxy-2-oxoethyl)-2-p-tolylquinoxalin-1(4H)-yl)acetate (Q1). The activation and adsorption thermodynamic parameters deduced from the varying of both temperature and inhibitor concentration are determined and discussed.
Experimental details
The chemical composition of the copper used is: 99.5 wt.% Cu, 0.001wt.% Ni, 0.019 wt.% Al, 0.004 wt.% Mn, 0.116 wt.% Si and balance impurities. Prior to all measurements, are abraded with a series of emery paper from 180 to 2000 grade. The specimens are washed thoroughly with bidistilled water degreased and dried with acetone. The aggressive solution (2M HNO3) was prepared by dilution of Analytical Grade 67 % HNO3 with double-distilled water. The molecular structure of Q1 is shown in Fig. 1. It was synthesised, purified and characterised as described previously [16].
Gravimetric measurements are carried out in a double walled glass cell equipped with a thermostated cooling condenser. The solution volume is 50 cm3. The copper specimens used have a rectangular form (2cm ´ 2cm ´ 0.20cm). The immersion time for the weight loss is 1h.
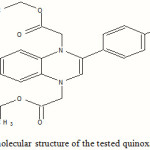 |
Figure 1: The molecular structure of the tested quinoxaline derivative. |
Results and discussion
Effect of temperature
The rate of the corrosion process of copper with the temperature increase (303-343 K) was studied in 2 M HNO3 solutions both in the absence and in the presence of different concentrations (5×10⁻⁵–10-3 M) of Q1. Table 1 collects the results obtained and the corresponding inhibition efficiencies.
It is obvious that the rate of corrosion generally increased with increase in temperature. This increase in the rate of corrosion with the temperature is generally interpreted by the enhancing of the transfer rate of the aggressive ions with increasing temperature, and hence the thermal agitation of ions and consequently the conductivity increases.
In other words, the corrosion rate is affected by the transfer of the aggressive ions (H+) and counter ion (NO3–) of the acid. The major role of each inhibitor is to adsorb forming a barrier against the arrival of H+ by adsorbing on the metal surface. This interaction between metal surface and inhibitor depends on nature and concentration of inhibitor and acid, temperature, stirring…
Table 1: Gravimetric data of Q1 at different concentration in 2M HNO3 at different temperatures.
|
T (K) |
Concentration(M) |
W(mg/cm2.h) |
Ew (%) |
|
303 |
10-3 |
0.0537 |
97.0 |
|
5×10⁻⁴ |
0.0715 |
96.0 |
|
|
10-4 |
0.1559 |
91.2 |
|
|
5×10⁻⁵ |
0.7410 |
58.4 |
|
|
313 |
10-3 |
0.3568 |
95.1 |
|
5×10⁻⁴ |
0.9268 |
87.4 |
|
|
10-4 |
1.0700 |
85.4 |
|
|
5×10⁻⁵ |
4.0623 |
44.6 |
|
|
323 |
10-3 |
2.4755 |
90.1 |
|
5×10⁻⁴ |
4.9442 |
80.2 |
|
|
10-4 |
4.9323 |
80.2 |
|
|
5×10⁻⁵ |
16.0810 |
35.6 |
|
|
333 |
10-3 |
22.7596 |
67.9 |
|
5×10⁻⁴ |
28.6114 |
59.6 |
|
|
10-4 |
31.1161 |
56.1 |
|
|
5×10⁻⁵ |
49.9284 |
29.5 |
|
|
343 |
10-3 |
100.7884 |
46.0 |
|
5×10⁻⁴ |
113.4321 |
39.2 |
|
|
10-4 |
124.7785 |
33.1 |
|
|
5×10⁻⁵ |
154.3299 |
17.3 |
Since 1916, Langmuir introduced the first quantitative theory of the adsorption of a gas, assumed that a gas molecule condensing from the gas phase would adhere to the surface for a short time before evaporating and that the condensed layer was only one atom or molecule thick. If q is the fraction of the surface area covered by adsorbed molecules at any time, the rate of desorption is proportional to q and equal to kd q where kd is a constant at constant temperature. Similarly the rate of adsorption will be proportional to the area of bare surface and to the rate at which the molecules strike the surface (proportional to the gas pressure P). At equilibrium the rate of desorption equals the rate of adsorption ka:
ka q = ka (1 – q) P (1)
and the Langmuir isotherm can be expressed as [17]:
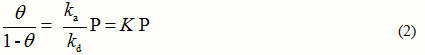
where K is a constant, the Langmuir constant or adsorption coefficient. Similarly, for adsorption of a species from solution, the Langmuir equation may be rearranged to:
![]()
where C is the concentration of the species in solution.
Two limiting cases of the Langmuir isotherm are of interest. When q is very small, as when the concentration is low, or the constant K is small, then equation 2 reduces to:
![]()
and the fraction of the bare surface (1 — q) is inversely proportional to C, and qtends to a limiting value in this region.
To facilitate the fitting, the Langmuir adsorption isotherm written in the rearranged form:

where Cis the concentration of inhibitor, K is the adsorptive equilibrium constant, q is the surface coverage and the standard adsorption free energy (ΔGads).
The Figure 2 regroups the different plots of C/q and C having linear behaviour with slopes equal to unity at all temperatures studied.
The values of K obtained facilitated to evaluate the adsorption enthalpy, DH°ads using the most known Van’t Hoff equation [18]:
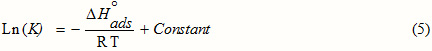
ΔHo adsis deduced from the slope of the straight line obtained between Ln (K) and 1/T in Fig.3. ΔHo ads= -40.64kJ.mol-1.
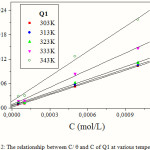 |
Figure 2: The relationship between C/ q and C of Q1 at various temperatures |
The estimated ΔHo ads by Van’t Hoff equation is equal to that estimated otherwise by the Gibbs–Helmholtz equation, expressed by:
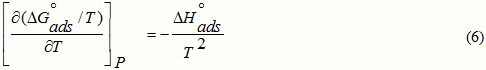
and written in the following equation:
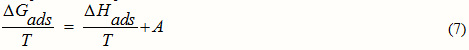
The standard adsorption entropy ΔSo ads may be deduced using the thermodynamic basic equation:
![]() (8)
(8)
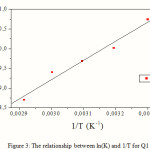 |
Figure 3: The relationship between ln(K) and 1/T for Q1 |
All the obtained thermodynamic parameters are shown in Table 3. The negative values of DG °ads for Q1 indicate the spontaneous of the adsorption of Q1 and stability of the adsorbed layer on the copper surface. More negative value designates that inhibitor is strongly adsorbed on the copper surface. The negative values of DS °ads also show that the adsorption of inhibitor is an exothermic process [19]. It assumed that an exothermic process is attributed to either physical or chemical adsorption but endothermic process corresponds solely to chemisorption. In an exothermic process, physisorption is distinguished from chemisorption by considering the absolute value of a physisorption process is lower than 40 kJ mol−1 while the adsorption heat of a chemisorption process approaches 100 kJ mol−1 [20]. In this study; the standard adsorption heat -40.64kJmol–1 postulates that a physical adsorption is more favoured. The negative values of DS °adsis generally explained an ordered of adsorbed molecules of inhibitor with the progress in the adsorption onto the copper surface [21].
Literature pointed that values of DG °adsaround -20 kJ.mol-1 or lower are related to the electrostatic interaction between the charged molecules and the charged metal (physisorption); those around -40 kJ.mol-1 or higher involve charge sharing or transfer from organic molecules to the metal surface to form a coordinate type of bond (chemisorption) [22, 23]. Based on the calculated values in Table 3, DG °ads were all negative indicating the highest inhibition effect. Values also close to -40 kJ/mol-1 reflecting, that the adsorption of the quinoxaline tested on copper in 2M HNO3 solution may be both physical and chemical adsorption (Table 3) .
The variation of DG °ads/T with 1/T gives a straight line with a slope that equals
DH °ads= -40.64kJ.mol-1 (Fig. 4). It can be seen from the figure that DG °ads/T decreases with 1/T in a linear fashion.
Table 3: Thermodynamic parameters of adsorption of Q1 on the copper surface at different temperatures.
|
T (K) |
Linear regression coefficient (r) |
K |
ΔG °ads(kJ/mol) |
ΔH °ads(kJ/mol) |
ΔS °ads(J/mol.K) |
|
303 |
0.99961 |
58045.04 |
-37.75 |
-40.64 |
-09.54 |
|
313 |
0.99866 |
22412.08 |
-36.52 |
-13.16 |
|
|
323 |
0.99721 |
16039.73 |
-36.79 |
-11.92 |
|
|
333 |
0.99772 |
12135.75 |
-37.15 |
-10.48 |
|
|
343 |
0.99714 |
6006.33 |
-36.26 |
-12.77 |
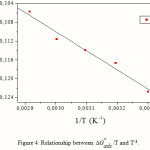 |
Figure 4: Relationship between ΔGo ads/T and T-1. |
Kinetic parameters of activation.
The influence of temperature on the kinetic process of corrosion in free acid and in the presence of adsorbed inhibitor leads to get more information on the electrochemical behaviour of metallic materials in aggressive media. The Arrenhius law may be presented as a straight line of the logarithm of the corrosion rate (W) and 1/T according to the following relation:
![]()
Where Ea represents the apparent activation energy, R is the universal gas constant, T is the absolute temperature and A is the pre-exponential factor.
The linear regression plots between Ln (W) and 1/T are presented in Fig.5. The calculated activation energies, Ea, and pre-exponential factors, A, at different concentrations of the inhibitor are collected in Table 2. The change of the values of the apparent activation energies may be explained by the modification of the mechanism of the corrosion process in the presence of adsorbed inhibitor molecules [24].
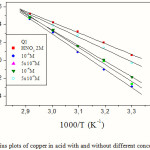 |
Figure 5: Arrhenius plots of copper in acid with and without different concentrations of Q1. |
Literature [24-26] discussed the variation of the apparent activation energy Ea in the presence and absence of inhibitor. Higher values for Ea were found in the presence of inhibitors. Other studies [27-29] showed that in the presence of inhibitor the apparent activation energy was lower than that in the absence of inhibitor. However, in our study, Ea increases with increasing the Q1 concentration, and all values of Ea were higher than that in the absence of quinoxaline compound. This type of inhibitor retards corrosion at ordinary temperatures but inhibition is diminished at elevated temperature.
Arrhenius law predicts that corrosion rate increases with the temperature and Ea and A may vary with temperature (Eq. 1). The obtained values seem that A and Ea increase continuously with the inhibitor’s concentration.
Table 2: Some activation parameters of Cu/HNO3 at different concentrations Q1.
|
Q1 (M) |
Pre-exponential factor (mg/cm2.h) |
Linear regression coefficient (r) |
Ea (kJ/mol) |
ΔHa (kJ/mol) |
ΔSa (J/mol.K) |
Ea – ΔHa (kJ/mol) |
|
Blank |
3.6627×10¹⁷ |
0.9991 |
100.21 |
97.53 |
82.36 |
2.68 |
|
5×10⁻⁵ |
4.1971×10¹⁹ |
0.9984 |
114.23 |
111.55 |
121.78 |
2.68 |
|
10-4 |
1.4243×1024 |
0.9994 |
144.74 |
142.06 |
208.51 |
2.68 |
|
5×10⁻⁴ |
1.3247×1026 |
0.9968 |
157.48 |
154.80 |
246.19 |
2.68 |
|
10-3 |
2.1380×1027 |
0.9988 |
166.15 |
163.48 |
269.32 |
2.67 |
Other kinetic data (enthalpy and entropy of corrosion process) are accessible using the alternative formulation of Arrhenius equation [30]:
![]()
where h is plank’s constant, N is Avogrado’s number,ΔSaand ΔHaare the entropy and enthalpy of activation, respectivel. Fig.6 presents plots of ln (W/T) vs. the reciprocal of temperature showing straight lines with a slope equal to (ΔHa/R) and an intercept of (Ln R/Nh + ΔSa/R). The values of ΔHaand ΔSa are also presented in Table 2.
Inspection of the kinetic data obtained in Table 2 shows that all parameters of corrosion process increases with the inhibitor concentration. Literature postulates that the positive sign of the enthalpy (ΔHa) is an endothermic nature of the copper dissolution process. The entropy of activation ΔHa in the absence of inhibitors is positive and this value increases positively with the Q1 concentration. The increase of ΔSaimplies that an increase in disordering takes place on going from reactants to the activated complex [27].
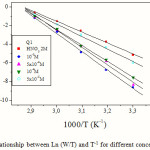 |
Figure 6: The relationship between Ln (W/T) and T-1 for different concentrations of Q1.
|
The increase of Ea and with an increase in the Q1 concentration (Fig. 7) suggests that the energy barrier of corrosion reaction increases with the inhibitor’s concentration. The higher activation energy in the inhibitor’s presence further supports the proposed physisorption mechanism. Unchanged or lower values of Ea in inhibited systems compared to the blank to be indicative of chemisorption mechanism, while higher values of Ea suggest a physical adsorption mechanism. This type of inhibitors retards the corrosion process [11, 31].
It is also interested to verify the known thermodynamic relation between Ea and ΔHa [29]:
Ea – ΔHa = RT (3)
The calculate values are too close to RT is 2.68 kJ/mol. This result shows the inhibitor acted equally on Ea and ΔHa .
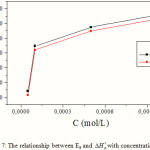 |
Figure 7: The relationship between Ea and with concentration of Q1 Click here to View figure |
Conclusion
Results obtained show that quinoxaline tested is an efficient inhibitor.
Inhibition efficiency increases with the increase of concentration to attain 97 % at 10-3M.
Increase of temperature leads in a decrease of efficiency and an increase of the activation corrosion energy.
Q1 adsorbs according to the Langmuir isotherm model and the negative value of is a sign of spontaneous adsorption on the metal surface.
Kinetic and adsorption parameters were evaluated and discussed.
References
- Noor, E. A., Al-Moubaraki, A.H., Mater. Chem. Phys., 110 (2008) 145.
- M. M. Osman, AntiCorros. Meth. Mater., 45 (1998) 176.
- M. Spah, D.C. Spah, B. Deshwal, S. Lee, Y-K. Chae, J. W. Park , Corros. Sci., 51 (2009) 1293.
- F. Bentiss, M. Lebrini, M. Lagrenée, Corros. Sci., 47 (2005) 2915.
- M.A. Amin, M.A. Ahmed, H.A. Arida, T. Arslan, M. Saracoglu, F. Kandemirli, Corros. Sci., 53 (2011) 540.
- M. Benabdellah, K.Tebbji, B. Hammouti, R. Touzani, A. Aouniti, A. Dafali, S. Elkadiri, Phys. Chem. News., 43 (2008) 115.
- S. S. Abd El Rehim, M. A. M. Ibrahim, K. F. Khalid, J. Appl. Electrochem., 29 (1999) 593.
- I. Zaafarany, M. Abdallah, Int. J. Electrochem. Sci., 5 (2010) 18.
- K. Nageh Allam, Applied Surface Science., 253 (2007) 4570.
- I. El Ouali, B. Hammouti, A Aouniti, Y. Ramli, M. Azougagh, E.M. Essassi, M. Bouachrine, J. Mater. Envir. Sci. 1 N° 1 (2010) 1.
- M. Benabdellah, R. Touzani, A. Aouniti, A. Dafali, S. Elkadiri, B. Hammouti, M. Benkaddour, Phys. Chem. News, 37 (2007) 63.
- I. B. Obot, N. O. Obi-Egbedi, N.W. Odozi, Corros. Sci., 52 (2010) 923.
- I. B. Obot, N. O. Obi-Egbedi, Materials Chemistry and Physics, 122 (2010) 325.
- I.B. Obot, N.O. Obi-Egbedi, Corr. Sci, 52 (2010) 282.
- A. Zarrouk, A. Dafali, B. Hammouti, H. Zarrok, S. Boukhris, M. Zertoubi, Int. J. Electrochem. Sci., 5 (2010) 46.
- C. O. Kappe, D. Dallinger, Nat. Rev. Drug. Discov., 5 (2006) 51
- Corrosion (Vol. 1 & 2), Shreir, Jarman & Burstein, p.2587; 20:23,
- L. B. Tang, G. N. Mu, G. H. Liu, Corr. Sci., 45 (2003) 2251.
- K. C. Emregul, M. Hayvali, Corros. Sci., 48 (2006) 797.
- A. Zarrouk, I. Warad, B. Hammouti, A Dafali, S.S. Al-Deyab, N. Benchat, Int. J. Electrochem. Soc., 5 (2010) 1516.
- M. R. Arshadi, M. Lashgari, Gh. A. Parsafar, Materials Chemistry and Physics., 86 (2004) 311.
- A. Ousslim, A. Aouniti, K. Bekkouch, A. Elidrissi, B. Hammouti, Surface Review and Letters., 16 (2009) 609
- E. Khamis, F. Bellucci, R. M. Latanision, E. S. H. El-Ashry, Corrosion., 47 (1991) 677
- O. Riggs, I. R. Hurd, M. Ray, Corrosion, 23 (1967) 252.
- T. P. Zhao, G. N. Mu, Corros. Sci., 41 (1999)1937.
- B. A. Abd-El-Nabey, E. Khamis, M. Sh. Ramadan, A. El-Gindy, Corrosion., 52 (1996) 671.
- I. N. Putilova, S. A. Balezin, V. P. Barannik, Metallic Corrosion Inhibitors, Pergamon Press, Oxford, (1960)
- S. N. Banerjee, S. Misra, Corrosion., 45 (1989) 780.
- Q. H. Cai, Y. K. Shan, B. Lu, X. H. Yuan, Corrosion., 49 (1993) 486.
- J. O. M. Bockris, A. K. N. Reddy, Modern Electrochem. Plenum Press, New York, 2 (1977) 1267.
- M. Bouklah, B. Hammouti, M. Lagrenée, F. Bentiss, Corros. Sci., 48 (2006) 2831.

This work is licensed under a Creative Commons Attribution 4.0 International License.
![]()
A New Edition of Web of Science
Journal Impact Factor
2022: 0.5
Five Year: 0.8
Journal is Indexed in

Cabells Whitelist
![]()


