Development and Validation of Spectrophotometric Method for Estimation of Cephalexin in Bulk and Tablet Dosage Forms
A.Vyas*, S. S. Shukla, R. Patel, R. Pandey, V. Jain, D. Singh and B. P. Nagori
Institute of Pharmacy, Pt. Ravishankar Shukla University, Raipur, Chhattisgarh Pharmacy wing, Lachoo Memorial College of Science and Technology, Sector A, Shastri Nagar, Jodhpur- 342 005 (India).
A spectrophotometric method has been developed for the quantitative estimation of cephalexin in API and in tablets. The method is based on the analysis of complex, formed on the reaction of cephalexin with 1-floro-2, 4-di nitro benzene. The absorbance maxima (l-max) was found to be 441.2 nm. Factors affecting the reaction viz. reaction time, temperature and effect of reagent were optimized. The proposed method was validated as per ICH guidelines. The recovery studies confirmed the accuracy and precision of the method.
KEYWORDS:Cephalexin; 1-floro-2; 4-di nitro Benzene; Validation; Spectrophotometry
Download this article as:| Copy the following to cite this article: Vyas A, Shukla S. S, Patel R, Pandey R, Jain V, Singh D, Nagori B. P. Development and Validation of Spectrophotometric Method for Estimation of Cephalexin in Bulk and Tablet Dosage Forms. Orient J Chem 2011;27(1). |
| Copy the following to cite this URL: Vyas A, Shukla S. S, Patel R, Pandey R, Jain V, Singh D, Nagori B. P. Development and Validation of Spectrophotometric Method for Estimation of Cephalexin in Bulk and Tablet Dosage Forms. Orient J Chem 2011;27(1). Available from: http://www.orientjchem.org/?p=24904 |
Introduction
Chemically, Cephalexin is 7 -a -D- phenylglycyl amino -3 –methyl -3 –cephem – 4-carboxylic acid monohydrate (1). It is first-generation member of cephalosporins which inhibits mucopeptide synthesis in the bacterial cell wall (2). Cephalexin is official in B.P. but not in I.P. and U.S.P. The method of analysis given in U.S.P. and I.P. is by Iodimetry (3). The other analytical methods reported in the literatures include HPLC [3,4,5,6], RP-HPLC (7), Micellar Electrokinetic Chromatography (8) and Densitometry (9) etc. This paper presents a simple, accurate, sensitive, reproducible and economic method for determination of Cephalexin in bulk and in tablet formulations.
Materials and methods
Instrument
Elico SL 160 Double beam UV-VIS Spectrophotometer with spectral bandwidth of 1.8 nm, wavelength accuracy of 2 nm and matched quartz cells of 10 mm optical path length, GR 200 Analytical weighing balance (A&D Company) and Sonicator (Enertech Electronics).
Chemicals and Reagents
Methanol A.R grade was procured from Loba Chem. Ltd., Mumbai. 1-floro-2, 4-di nitrobenzene was procured from S. D. fine chem. Ltd. Mumbai. Cephalexin was obtained as gift sample from Lupin Ltd., Bhopal (M.P). Cephalexin tablets; Cephadex tablet (125 mg) (Cipla lab), Phexin tablet (125 mg) (GSK) and Sporen tablet (125 mg) (DAY’S) were procured from local market.
Preparation of standard Cephalexin solution
Cephalexin (10 mg) was accurately weighed and dissolved in 100 ml of distilled water to give a stock solution of concentration 100 mg / ml.
Optimization of reaction parameters
Reaction time
Standard solutions of Cephalexin (5 ml) were pipetted into a series of six, 25 ml volumetric flasks. 1 ml of 1-floro-2, 4-di nitro benzene was added to each flask and mixed. 1 ml of hydrochloric acid was added in each flask to maintain the acidic condition and the volumes in each were adjusted up to the mark with methanol. The final solutions were heated at 45 0 for different time intervals (5, 10, 15, 20, 25, and 30 min). The absorbances of the complexes were measured at 441.2 nm against blank. The blank was prepared similarly in which volume of standard solution was replaced by an equal volume of methanol. The results are reported in Figure 1.
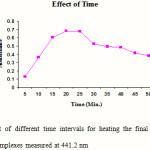 |
Figure 1: Effect of different time intervals for heating the final solutions on the absorbance of complexes measured at 441.2 nm Click here to View figure |
Effect of temperature
Standard solutions of Cephalexin (5 ml) were pipetted into a series of seven, 25 ml volumetric flasks. 1 ml of 1-floro-2, 4-di nitro benzene was added to each flask and mixed. 1 ml of hydrochloric acid was added in each flask to maintain the acidic condition and the volumes were adjusted up to the mark with methanol. The final solutions were heated at different temperatures (5, 15, 25, 30, 40, 45 and 50 0C) for 20 min. The absorbances of the complexes were measured at 441.2 nm against blank. The blank was prepared similarly in which volume of standard solution was replaced by an equal volume of methanol. The results are reported in Figure 2.
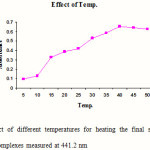 |
Figure 2: Effect of different temperatures for heating the final solutions on the absorbance of complexes measured at 441.2 nm Click here to View figure |
Effects of concentration of reagent
Standard solutions of cephalexin (5 ml) were pipetted into a series of six, 25 ml volumetric flasks. Different volumes (0.5, 1.0, 1.5, 2.0, 2.5 and 3.0 ml) of 1-floro-2, 4-di nitro benzene were added to each flask, mixed and acidified by the addition of 1 ml hydrochloric acid. The volumes in each were adjusted up to the mark with methanol. The absorbance of the complexes was measured at 441.2 nm against blank. The blank was prepared similarly in which volume of standard solution was replaced by an equal volume of methanol. The results are reported in Figure 3.
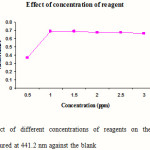 |
Figure 3: Effect of different concentrations of reagents on the absorbance of complexes measured at 441.2 nm against the blank Click here to View figure |
Preparation of calibration curve for Cephalexin
Standard solutions of cephalexin (0.5, 1.0, 1.5, 2.0 and 2.5 ml) were pipetted in series of five, 25 ml volumetric flasks. 1 ml of 1-floro-2, 4-di nitrobenzene was added to each flask and mixed. 1 ml of 1M hydrochloric acid was added to maintain acidic condition. The volume was adjusted with methanol. This mixture was heated at 40 0 for 25 min and cooled. The calibration curve was constructed by plotting absorbance V/s concentration (mg/ml). Co-relation co-efficient was also measured.
Estimation of cephalexin in tablets dosage forms
Twenty tablets (of same respective batch numbers) of three pharmaceutical companies were weighed and ground to fine powder. Quantity of powder (2.487 gm) equivalent to 10 mg of cephalexin for each was transferred to three 100 ml volumetric flasks. The contents were dissolved in 50 ml of distilled water and sonicated for 20 minutes. The solutions were filtered through Whatmann filter paper No. 40 and residues were washed thoroughly with distilled water. The filtrate and washings were combined in a 100 ml volumetric flask and diluted up to the mark with distilled water. From these stock solutions, working sample solutions were prepared by appropriate dilutions and analyzed by proposed method. Recovery studies were carried out those gave satisfactory results.
Recovery studies and validation of the method (As per ICH Q2A Guidelines)
Recovery studies were carried out by adding 1, 2 and 3 mg of pure drug to different samples of tablet powder containing the equivalent of 10 mg of drug. Percentage recovery was calculated from the amount obtained by recovery studies. Precision of the method was studied by carrying out intraday, interday analysis and expressed as % Relative Standard [10].
Results and discussion
In this proposed method, the determining conditions were established by varying one parameter at a time and keeping the other fixed by observing the effect produced on the absorbance of a complex. The parameters involves the maximum complex development viz. concentration of reagent, temperature and time required to yield complex of maximum sensitivity were optimized. Maximum absorbance of Cephalexin was observed in the presence of 1.0 ml of reagent solution. Optimum temperature to obtained maximum complex intensity was found to be 400C in Cephalexin. Maximum absorbance of Cephalexin was obtained after 20 min.
The optical characteristics such as Beer’s law limits, Molar extinction coefficient, Sandell’s sensitivity, Correlation coefficient, Regression equation and Accuracy were calculated for the method and the results are summarized in Table 1.
The proposed method was found to be accurate, simple and rapid for routine analysis of cephalexin. Drug when reacts with 1-floro-2, 4-di nitro benzene reagent forms a complex, which was than analyzed. The results of recovery studies were found to be satisfactory and are reported in Table 2.
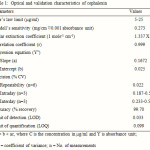 |
Table 1: Optical and validation characteristics of cephalexin Click here to View table |
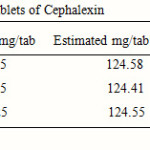 |
Table 2: Results of assays of tablets of Cephalexin |
Acknowledgement
The authors are thankful to Lupin Ltd., Bhopal (M.P.) for providing gift sample of cephalexin to carry out this research work.
References
- Maryadele J. O. Neil, Smith Ann and Heckelman Patricia E., The Merck Index, 13th Edition, Merck Research Laboratories, NJ (USA), 339 (2001).
- Hardman J. G. and Limbird L. E., Goodman Gilman’s, The Pharmacological Basis of Therapeutics, McGraw-Hill Publication, 10th Edition, 1210 (2001).
- Pharmacopoeia of India. Vol-I, 4th ed. Published by Controller of Publications, New Delhi (India) 72-75 (1996).
- British Pharmacopoeia, Vol-I, 4th ed. Controller of her Majesty’s Stationary office, London 179 (2004).
- Samanidou V.F., Hapeshi E.A. and Papadoyannis I.N., J. Chromatogr. B Biomed Sci., 788 (1), 147 (2003).
- Gallo Martinez L., Campins Falco P. and Sevillano Cabeza, J. Pharm. Biomed. Anal., 29(3), 405 (2002).
- Wu Z.J., Guo W.B., Zhang Q.G., Ni K.Y. and Lin Y.S. Se Pu, 17(6), 518 (1999).
- Steppe M., Prado M.S., Tavares M.F., Kedor-Hackmann E.R. and Santoro M. J. Capillary Electrophor., 7(3-4), 81 (2002).
- Coran S.A., Bambagiotti-Alberti M., Giannellini V., Baldi A., Picchioni G. and Paoli F. J. Pharm. Biomed. Anal., 18 (1-2), 271 (1998).
- Bolton Sanford and Charlis Bon, Pharmaceutical Statistics Practical & Clinical Application, 3rd Edition, Marcel Dekker, New York, 200-210 (1997).

This work is licensed under a Creative Commons Attribution 4.0 International License.
![]()
A New Edition of Web of Science
Journal Impact Factor
2022: 0.5
Five Year: 0.8
Journal is Indexed in

Cabells Whitelist
![]()


