Comparison of Langmuir and Harkins-Jura Adsorption Isotherms for the Determination of Surface Area of Solids
S.Shanavas1*, A. Salahuddin Kunju2, Hema Tresa Varghese3 and C. Yohannan Panicker4
1Department of Chemistry, Government Arts College, Thiruvananthapuram, Kerala (India). 2Department of Chemistry, University College, Thiruvananthapuram, Kerala (India). 3Department of Physics, Fatima Mata National College, Kollam, Kerala (India). 4Department of Physics, TKM College of Arts and Science, Kollam, Kerala (India).
Batch experiments were carried out for the adsorption of aniline on activated charcoal and titanium dioxide from toluene at 35, 40, 45, 50 and 55°C. The adsorption of aniline on charcoal from toluene (ACT) was of L3 type and aniline on titanium dioxide from toluene (ATT) was of L2 type as per Giles classification. The experimental data were analyzed with Langmuir and Harkins-Jura adsorption isotherms. The Harkins-Jura equation was obeyed by all systems for the entire concentration range studied, where the Langmuir equation fails. All Harkins-Jura plots contained two intersecting straight lines. The point of intersection of the two lines relate to completion of a monolayer. From these monolayer values the specific surface areas of adsorbents were calculated. By Harkins-Jura relative method the surface areas of the adsorbents were also obtained by comparison of the slopes of the straight lines, without resorting to the ambiguous parameters like molecular area and unreliable monolayer values.
KEYWORDS:Langmuir; Harkins-Jura; Surface area; Aniline; Toluene; Charcoal; Titanium dioxide
Download this article as:| Copy the following to cite this article: Shanavas S, Kunju A. S, Varghese H. T, Panicker C. Y. Comparison of Langmuir and Harkins-Jura Adsorption Isotherms for the Determination of Surface Area of Solids. Orient J Chem 2011;27(1). |
| Copy the following to cite this URL: Shanavas S, Kunju A. S, Varghese H. T, Panicker C. Y. Comparison of Langmuir and Harkins-Jura Adsorption Isotherms for the Determination of Surface Area of Solids. Orient J Chem 2011;27(1). Available from: http://www.orientjchem.org/?p=24831 |
Introduction
The most characteristic property of the surface of a solid is its ability to adsorb gases and vapours. Activated charcoal, Alumina, Titanium dioxide, Silica gel, etc. are the widely used materials in industry for separation of ions and removal of toxic and hazardous particles. The wide use of these adsorbents are due to their non-hazardous nature, large surface area, micro porosity, high adsorption capacity, stability towards radiation and purity1-6.
Determination of the specific surface area of solids is very important in many industries, especially in those cases where the solid is used as catalyst or pigment. Adsorption method is the most widely used technique for the measurement of surface area of solids. Such methods involve the experimental determination of the monolayer value from which the surface area can be calculated, if the molecular area is available. Apart from the inaccuracies introduced in the determination of specific surface area from unreliable values of molecular area, in many cases difficulties are encountered in the correct determination of the monolayer values. Langmuir isotherm is now widely used for the determination of surface area of adsorbents. The Langmuir equation has only limited applicability, for it is valid only to the type I isotherm of Brunauer’s classification7 and to L1, L2, H1 and H2 isotherms according to Giles classification8. The equation fails completely when the isotherm is of any other type or if there is a rising tendency after the plateau. The present work is an attempt for the estimation of surface area of titanium dioxide at different temperatures from the adsorption of aniline from toluene on charcoal and titanium dioxide without resorting to the inaccurate monolayer location and to any assumption regarding molecular areas.
Experimental
E.Merck “Active Carbon – Pure dry” is heated at 1000C in an air oven for about four hours with occasional stirring. E.Merck “Titanium dioxide (Technical)” was repeatedly washed with water till the washings are neutral. It was then washed with methanol for several times to free it from water. It was dried and heated in a slow current of air at 2000C for seven hours. Activated adsorbents were cooled and stored in a vacuum desicator over fused calcium chloride. Analytical grade chemicals were used throughout the experiment. Stock solution was prepared from redistilled aniline. Batch experiments are carried out for the determination of equilibrium concentration. For each experiment nearly 0.5g of activated charcoal or 2.5g of titanium dioxide were weighed accurately and transferred into 100mL stoppered conical flask. From the stoke solution of aniline adequate volumes were measured out, diluted to 50mL and 25mL of this solution was pipetted out into the conical flask containing adsorbent. The remaining solution was kept as blank.
The contents of the conical flask were then placed in an electronic water bath with electrical shaker at (35 ± 0.1)°C for two days with constant shaking. The blanks were also kept in the bath at the same temperature. After attaining the equilibrium, the solutions were centrifuged rapidly. 2mL of the initial centrifuge is discarded. Aliquot amounts of the centrifugate were pipetted into 1:1 hydrochloric acid. Hot air is blown into the solution till toluene was completely evaporated. The solution was then quantitatively transferred into an iodine value flask. The solute was estimated by bromate-bromide method. The process was repeated with the blank solution. The experiments were then repeated at 40, 45, 50 and (55 ± 0.1)0C also. The sodium thiosulphate solution was standardized with AR potassium dichromate. The specific surface area of charcoal was determined by the iodine adsorption method of Puri and Bansal9.
Results and Discussion
Adsorption isotherms and classification
Adsorption isotherms of aniline on charcoal and titanium dioxide from toluene have been examined at different temperatures varying from 35 to 55oC. The isotherms obtained for these systems are given in figures 1 and 2. According to the Giles classification8, adsorption of ACT is of L3 type and ATT is of L2 type of isotherm.
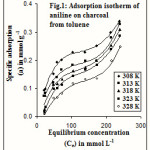 |
Figure 1 Click here to View figure |
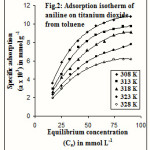 |
Figure 2 Click here to View figure |
Application of Langmuir equation
Systems obeying the Langmuir equation will give a linear graph when Ce/a is plotted against Ce, according to the equation.
![]()
where Ce is the equilibrium concentration, a is the specific adsorption, am is the monolayer value and KL is the Langmuir constant. The Langmuir equation cannot be applied to L3 type of isotherms as no linear graph is obtained. The Langmuir plots obtained by the least square method for ATT are represented in figure 3. The monolayer values are tabulated in Table 1.
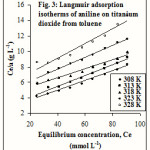 |
Figure 3 Click here to View figure |
Table 1: Langmuir monolayer values
| Systems | Temperature (K) | Monolayer value am
(mmol/g) |
Correlation coefficient |
|
Aniline Toluene Titanium dioxide |
308 | 0.0159 | 0.9941 |
| 313 | 0.0142 | 0.9919 | |
| 318 | 0.0169 | 0.9874 | |
| 323 | 0.0131 | 0.9978 | |
| 328 | 0.0095 | 0.9872 |
The quantity am obtained from the Langmuir equation is the monolayer value which can be used to determine the specific surface area of adsorbents by the equation.
![]()
where N is the Avogadro number and is the molecular area. Unfortunately, reliable values of molecular areas are not available and hence specific surface areas calculated from the monolayer values will be inaccurate. In addition to this, the monolayer values themselves are often incorrect which also leads to unreliable values of specific surface. A number of workers have reported the limitation of Langmuir equation to be used as a general isotherm10-12. Phosphate adsorption data for calcite plotted according to Langmuir equation is reported to show three distinct sections with two different linear portions13 giving two monolayer values.
Harkins-Jura adsorption isotherm
The aforesaid difficulties are overcome in the gas-solid systems by the adsorption equation proposed by Harkins and Jura14,15. They have proved that the adsorptive film is of the condensed type and hence its surface pressure, the difference of the surface tensions of the bare surface and film covered surface, is a linear function of the area per molecule. It is surprising to note that attempts have not been made to extend the Harkins-Jura equation to the solution-solid systems at different temperatures. A theoretical deduction of the modified Harkins-Jura equation as applicable to solute adsorption has been attempted16. The isotherm analogous to the Harkins-Jura isotherm, derived for the adsorption of solutes from dilute and ideal solutions on solid surface is given by
![]()
where Ce is the equilibrium concentration, a is the specific adsorption and a and b are constants. According to equation (3), a plot of log Ce against 1/a2 should give a straight line having a slope b, which is related to the specific surface area of the adsorbent by the equation
![]()
where S is the specific surface area, R is the universal gas constant, T is the absolute temperature, N is the Avogadro number and q is a constant independent of the nature of the adsorbent. Then the surface area of the adsorbent can be calculated from this expression as
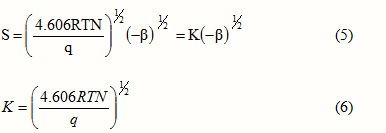
K is the constant, which depends on the nature of the solute and probably on the solvent, but independent of the nature of the adsorbent. Hence the surface area of the adsorbent can be obtained by comparison of the slopes of the straight line plots without resorting to the ambiguous parameters like molecular area and unreliable monolayer values. Harkins-Jura plots applied to the two systems are given in figures 4 and 5. In these figures specific adsorption is in mol g-1 and equilibrium concentration in mol L-1.
All the plots contain two intersecting straight lines and thus conform to the Harkins-Jura solute adsorption equation. The Harkins-Jura equation is obeyed by these systems for the entire concentration range studied, where the Langmuir equation fails. The slopes b1 and b2 of the Harkins – Jura plots are summarised in Table 2.
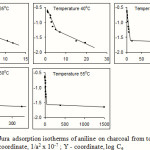 |
Figure 4: Harkins-Jura adsorption isotherms of aniline on charcoal from toluene at different temperatures: X – coordinate, 1/a2 x 10-7 ; Y – coordinate, log Ce |
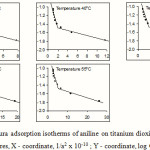 |
Figure 5: Harkins-Jura adsorption isotherms of aniline on titanium dioxide from toluene at different temperatures, X – coordinate, 1/a2 x 10-10 ; Y – coordinate, log Ce |
Table 2: Harkins-Jura Constants
___________________________________________________________________________
Correlation Coefficients
| System | Temperature | -b1 | -b2 | Lower portion | Upper
portion |
| Aniline Toluene Charcoal | 308 | 4.7970 x 10⁻⁹ | 3.3605 x 10⁻⁸ | 0.9999 | 0.9591 |
| 313 | 3.0182 x 10⁻⁹ | 1.6360 x 10⁻⁸ | 0.9831 | 0.9582 | |
| 318 | 3.1857 x 10⁻¹¹ | 1.0150 x 10⁻⁸ | 1.0000 | 0.9884 | |
| 323 | 2.1981 x 10⁻¹¹ | 6.9231 x 10⁻⁹ | 1.0000 | 0.9893 | |
| 328 | 5.5079 x 10⁻¹² | 2.8380 x 10⁻⁹ | 1.0000 | 0.9641 | |
| Aniline Toluene Titanium dioxide | 308 | 4.6042 x 10⁻¹² | 5.1352 x 10⁻¹¹ | 0.9649 | 0.9503 |
| 313 | 3.1140 x 10⁻¹² | 4.4784 x 10⁻¹¹ | 0.9836 | 0.9707 | |
| 318 | 2.4525 x 10⁻¹² | 2.3553 x 10⁻¹¹ | 0.9676 | 0.9568 | |
| 323 | 2.0240 x 10⁻¹² | 1.6790 x 10⁻¹¹ | 0.9953 | 0.9722 | |
| 328 | 1.4456 x 10⁻¹² | 1.4307 x 10⁻¹¹ | 0.9865 | 0.9373 |
The experimental data agree fairly well with the Harkins-Jura adsorption equation at all temperatures and this proves its validity to solute adsorption. The existence of two intersecting straight lines in the Harkins-Jura plot indicates that there are two isotherms corresponding to each of these lines with different values for the constants a and b. This type of behaviour is obtained in the cases of nitrogen on Spheron 6, argon and pentane on rutile17. The two linear portions correspond to two equations of state of the film. Such a change from one equation of state to another would correspond to a transition of the second order18. Bangham et al. obtained similar results for the adsorption of alcohol vapours on charcoal19. It is argued that the two straight lines correspond to two different orientations of the adsorptive molecules; the greater slope corresponding to a flat orientation and the smaller slope to a near vertical orientation20. This view has been supported by the work of Soriaga et al. who, using thin layer electrochemical techniques, has shown that admolecules assume orientation parallel to the solid surface when adsorbed from solutions of low concentrations and edgewise orientation when adsorbed from solutions of higher concentrations21,22. Hence it can be inferred that the straight line with a greater slope in the Harkins-Jura plot corresponds to a flat orientation, which changes to a near vertical orientation at higher concentration. The change from the flat orientation to the vertical orientation is a second order phase change of the film. The point of intersection of the two straight lines would therefore give the value of the monolayer capacity.
Determination of surface area
The specific surface area of charcoal, determined by the iodine adsorption method of Puri and Bansal9, at temperatures 308, 313, 318, 323 and 328 K are respectively 898.38, 914.40, 935.16, 946.64 and 953.54 m2g-1. Then from monolayer values of charcoal obtained from Harkins-Jura plots of ACT system, the molecular areas of aniline at different temperatures are calculated by equation (2). Using these molecular areas and from the monolayer values of titanium dioxide obtained from Harkins-Jura plots of ATT system, the specific surface area of titanium dioxide are determined. All these values are tabulated in Table 3.
Table 3: Surface area of titanium dioxide from the monolayer values Harkins-Jura plots
| Temperature (K) | Specific surface area (S) of charcoal by iodine adsorption method (m2g-1) | Monolayer
Value (am) of charcoal from Harkins-Jura plots (mol/g) |
Molecular area (Am) of aniline from Monolayer value of charcoal
(2) |
Monolayer
Value (am) of titanium dioxide from Harkins-Jura plots (mol/g) |
Specific surface area (S) of titanium dioxide from monolayer value
(m2g-1) |
| 308 | 898.38 | 1.8671 x 10⁻⁴ | 798.88 | 7.7892 x 10⁻⁶ | 37.48 |
| 313 | 914.40 | 1.4128 x 10⁻⁴ | 1074.59 | 7.2095 x 10⁻⁶ | 46.66 |
| 318 | 935.16 | 9.6850 x 10⁻⁵ | 1603.15 | 5.8785 x 10⁻⁶ | 56.76 |
| 323 | 946.64 | 8.2648 x 10⁻⁵ | 1901.70 | 4.9938 x 10⁻⁶ | 57.20 |
| 328 | 953.54 | 5.5164 x 10⁻⁵ | 2869.91 | 4.3853 x 10⁻⁶ | 75.80 |
According to Harkins-Jura adsorption equation, for the same solute-solvent system on different adsorbents, we can show that,
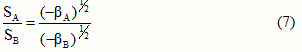
where SA and SB are the specific surface areas of the adsorbents A and B and bA and bB are the slopes of the respective Harkins-Jura plots. Hence if the specific surface area of one of the adsorbents is known, that of the other can be calculated. Using the specific surface area of charcoal, determined by the iodine adsorption method at different temperatures and from higher or lower concentration slopes of ACT and ATT plots, the specific surface areas of titanium dioxide can be calculated by Harkins-Jura relative method. The specific surface areas of titanium dioxide obtained from higher concentration slopes are summarised in Table 4.
Table 4: Specific surface area of titanium dioxide by the Harkins-Jura relative method
| Temperature (K) | Specific surface area of charcoal (m2 g-1) | -b for titanium dioxide | -b for charcoal | Specific surface area of titanium dioxide (m2 g-1) |
| 308 | 898.38 | 5.1352 x 10⁻¹¹ | 3.3605 x 10⁻⁸ | 35.12 |
| 313 | 914.40 | 4.4784 x 10⁻¹¹ | 1.6360 x 10⁻⁸ | 47.84 |
| 318 | 935.16 | 2.3553 x 10⁻¹¹ | 1.0150 x 10⁻⁸ | 45.05 |
| 323 | 946.64 | 1.6790 x 10⁻¹¹ | 6.9231 x 10⁻⁹ | 46.62 |
| 328 | 953.54 | 1.4307 x 10⁻¹¹ | 2.8380 x 10⁻⁹ | 67.70 |
From lower concentration slopes of these systems the values obtained are 27.83, 29.37, 259.47, 287.26 and 488.50m2g-1. Since the areas calculated at higher concentration slopes of Harkins-Jura plots are in good agreement with the areas determined from Harkins-Jura monolayer values, these values are taken into account. Thus apart from the validity of the Harkins-Jura solute adsorption isotherm to systems, it can be used for the determination of the specific surface area of solids, without resorting to the ambiguous molecular area and unreliable monolayer values. Moreover, the experimental difficulties usually met with in gas adsorption methods are not encountered in this procedure.
Conclusion
Langmuir isotherm has only limited applicability. The calculation of surface area of solids by Langmuir isotherm requires the unreliable values of molecular area and monolayer value. All Harkins-Jura plots contain two intersecting straight lines, of which the branch at lower concentrations corresponds to the flat orientation and the branch at higher concentrations corresponds to near vertical orientation. The point of intersection of the two branches relate to completion of a monolayer. From these monolayer values, the molecular area can be calculated for different solutes. The specific surface areas of other adsorbents can be calculated from the molecular areas thus calculated and the specific adsorption at the point of intersection of the Harkins-Jura plot for the same solute-solvent pair on different adsorbents. In Harkins-Jura relative method the surface area of the adsorbent can be obtained by comparison of the slopes of the straight line plots without resorting to the ambiguous parameters like molecular area and unreliable monolayer values. Moreover, the experimental difficulties usually met with in gas adsorption methods are not encountered in this procedure. The Harkins-Jura equation is obeyed by all systems for the entire concentration range studied, where the Langmuir equation fails.
References
- Bhatt, D.J., Bhargava, D.S., and Pansar, P.S., Asian Environ. 6: 21 (1984).
- Vo Toan, P., and Frot, T. Jr., J. Phys. Chem. 91: 6638 (1987).
- Quadeer, R. and Hanif, J., Carbon 33: 215 (1995).
- Brahim, K., Abdessalam, M., and Rafael, B., J. Chem. Tech. and Bio Tech. 64: 153 (1995).
- Kruk, M., Jaroniec, M., and Gadkaree, K.P., J. Colloid Interface Sci. 192: 250 (1997).
- Choma, J., and Jaroniec, M., Langmuir 13: 1026 (1997).
- Brunauer, S., Deming, L.S., Deming, W.S. and Teller, E., J. Am. Chem. Soc. 62: 1723 (1940).
- Giles, C.H, Mac Ewen, T.H., Nakhwa, S.N., and Smith, D., J. Chem. Soc., 786: 3973 (1960).
- Puri, B.R., and Bansal, R.C., Carbon 3: 227 (1966).
- Philip, S.C., and Yen-Chen-Yu, Act. Carbon Adsorption Org. Aq. Phase., 1: 167 (1980).
- Novela, C.E., Pardo, C.E., Alvarzchopez, J., Santiago, M. L., Derenas, C.L., and Diaz, Z.J., Rev R. Acad. Ciene, Exactas Fis. Nat Madrid. 77(4): 804 (1983).
- Zhao, Z., Zhao, Z., and Gu, I., Hauxue xue bao., 43: 813 (1985).
- Cruz, S.F., Bolarin, M.C., Roig, A., and Caro, M., An Edafol Agrobiol., 39(9-10): 1641 (1980).
- Harkins, W.D., and Jura, G., J. Am. Chem. Soc., 68: 1941 (1946).
- Harkins, W.D., and Jura, G., J. Chem. Phys.,11: 430 (1943).
- Iyer, K.P.D., and Warier, N.S., Inst. of Chemists (India) XLIV (IV): 111 (1972).
- Corrin, M.L., J. Am. Chem. Soc., 73: 4061 (1951).
- Mayer, J.E., and Streater, S.F., J. Chem. Phys., 7: 1019 (1939).
- Bangham, D.H., Fakhoury and Mohammed, A.F., Proc. Roy. Soc., 147A: 178 (1934).
- Gregg, S.J., Surface Chemistry of Solids, Chapman and Hall Ltd., London p.66 (1961).
- Soriaga, M.P., Peggy, W.H, Arthur, H.T, Benton and Clifford S., J. Electrianal. Chem. Interfacial Electrochem., 142(1-2): 317 (1982).
- Soriaga, M.P., and Arthur, H.T., J. Phy. Chem., 88(6): 1094 (1984).

This work is licensed under a Creative Commons Attribution 4.0 International License.
![]()
A New Edition of Web of Science
Journal Impact Factor
2022: 0.5
Five Year: 0.8
Journal is Indexed in

Cabells Whitelist
![]()


