A Theoretical Study of Spectroscopic Properties of a Hemiacetal by TDDFT Method
Download this article as:
![]()
Hemiacetals being unstable compounds are difficult to isolate and it is difficult to establish their structure and spectroscopic properties by experiment. IR and NMR experimental data are available in the literature only for the hemiacetal 1-methoxy ethanol in a reaction mixture. The objective of the present work is to investigate how the methods based on density functional theory (DFT) and its time dependant version (TDDFT) can predict structural and spectroscopic properties of this unstable compound. Geometry optimization and frequency calculations have been carried out by DFT method at 6-31+G(d) and 6-31++G(d,p) levels. The UV-Vis spectra in a number of solvents have been calculated by the TDDFT method under the polarizable continuum model and the variation of the calculated UVvis absorption peak with two solvent polarity indices (namely, ET(30) and Z-values) has been studied in these solvents; electronic transition energies at the λmax values in the theoretically calculated spectra increase with solvent polarity. The calculated infrared absorption bands and NMR chemical shifts (1H and 13C) are in good agreement with reported experimental data. In case of IR, consideration of anharmonicity effect yields better agreement with experiment.
KEYWORDS:Hemiacetal; 1-Methoxy ethanol; Solvent polarity indices; TDDFT; Anharmonicity
Introduction
The formation of acetals as a result of reaction between aldehydes and alcohols is known to proceed through the formation of the corresponding hemiacetals (structure I, Figure 1). These hemiacetals are highly unstable and difficult to isolate and therefore it is not possible to record the spectra of pure hemiacetals. Their existence in reasonable concentration in solutions, however, has been postulated in a number of cases 1-3 and spectroscopic data of some of such compounds in reaction medium have been reported.2, 3 The proposed hemiacetal structure and the reported spectra in reaction mixture can only be justified by theoretical calculation. The density functional theory (DFT) 4, 5 is currently being applied for carrying out a variety of quantum chemical calculations ranging from geometry optimization of large clusters6 to the study of reaction rates.7, 8 For theoretical prediction of spectroscopic properties (transition energy, oscillator strength etc.), the time dependent density functional theory (TDDFT) has been developed 9- 11 and is now being widely used.12- 13 The objective of the present work is to calculate the infrared absorption frequencies, UV-vis absorption maxima and NMR chemical shifts of the unstable molecule, 1-methoxy ethanol (Structure II, Figure 1) by applying the computational method of TDDFT and comparing them with available experimental data.2, 3 Effect of change in solvent polarity on the UV-vis spectrum has also been studied theoretically and the results are expected to have some predictive value for spectroscopic investigations of similar compounds which may be formed in situ during chemical reactions.
Computational details
All computations were performed on a Pentium computer with Gaussian 03 Revision D.01 suite of programmes.14 DFT calculations were done by using the Becke’s three parameter hybrid15 exchange potential with the correlation function of Lee, Yang and Parr 16 (B3LYP). The basis sets 6-31+G(d), 6-31++G(d,p) and 6-311+G(d,p) were used. Optimization of the ground state geometry of the molecule at B3LYP level was carried out in vacuum and also in Tetrahydrofuran (THF), Chloroform (CHCl3), acetonitrile (CH3CN), dimethylsulfoxide (DMSO) and methanol (MeOH) solutions by the polarizable continuum model 17, 18 (PCM). Using the ground state optimized geometry, the vibrational frequencies, 1H and 13C NMR chemical shifts and electronic transition energies were calculated. Similarly by using the TDDFT method under the PCM formalism the electronic transition energies in THF, CHCl3, CH3CN, DMSO and MeOH medium were calculated. In the PCM, the solute is placed in the solvent reaction field cavity created by a series of overlapping spheres initially devised by Tomasi et. al. 17, 18 and implemented by Barone et. al. 19- 20 also by Tomasi and co-workers 21, 22.
Results and Discussions
Optimized Geometry
The optimized geometry of the hemiacetal of acetaldehyde (compound II, Figure 1) computed at B3LYP/6-31++G(d,p) level in vacuo and in dimethyl sulfoxide (DMSO) is shown in Figure 2 along with the necessary atom labels. The calculated structural details are summarized in Table 1. Such optimization has also been carried out in four other solvents of varying polarity and also using the 6-31+G(d) basis set; these results are given as supplementary material.
Results of thermo-chemical calculation, as given in Table 2, indicate that in going from vacuum to solution phase the stability of the hemiacetal increases and that too, with increase in solvent polarity (dielectric constant, ε). This suggests that the hemiacetal molecule should be polar, and this is substantiated by the calculated dipole moment of about 3.2 D (Table 1 and also in supplementary material). It is also to be noted that change of basis set from 6-31+G(d) to 6-31++G(d,p) brings about an increase in stabilization energy of about 9.5 kcal mol-1 (Table – 2).
 |
Figure 1: Formation of (I) hemiacetal by reaction between an aldehyde (RCHO) and an alcohol (R1OH); hemiacetal (II) formation by reaction between acetaldehyde and methanol. |
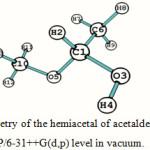 |
Figure 2: The optimized geometry of the hemiacetal of acetaldehyde (compound II, Figure 1) computed at B3LYP/6-31++G(d,p) level in vacuum. |
Table 1: Main structural features (bond length, bond angle, dipole moment) of the optimized geometries in vacuum and in DMSO solvent calculated with 6-31+G(d) and 6-31++G(d,p) basis set. Atom labels refer to Fig. 2.
|
Geometrical Parameter |
B3LYP/6-31+G(d) |
B3LYP/6-31++G(d,p) |
||
|
Vacuum |
DMSO |
Vacuum |
DMSO |
|
|
R(C1-O5) / Å |
1.426 |
1.433 |
1.426 |
1.434 |
|
R(O5-C10) / Å |
1.419 |
1.425 |
1.419 |
1.426 |
|
R(O3-H4) / Å |
0.972 |
0.988 |
0.968 |
0.984 |
|
A(O3-C1-O5) / deg |
107.1 |
107.3 |
107.1 |
107.3 |
|
A(O3-C1-C6) / deg |
107.7 |
108.1 |
107.7 |
108.1 |
|
A(O5-C1-C6) / deg |
113.0 |
112.1 |
113.0 |
112.0 |
|
A(C1-O3-H4) / deg |
107.7 |
108.6 |
107.7 |
108.7 |
|
A(C1-O5-C10) / deg |
114.9 |
114.5 |
114.9 |
114.4 |
|
Dipole moment / Debye |
2.3164 |
3.2535 |
2.2908 |
3.2386 |
Table 2: Variation of ground state energy of the hemiacetal with solvent polarity calculated at DFT /B3LYP level using two basis sets; the absolute energies include zero-point correction.
|
Medium |
Dielectric constant of solvent |
Absolute energy / Ha |
Energy relative to vacuum (kcal mol-1) |
||
|
6-31+G(d) |
6-31++G(d,p) |
6-31+G(d) |
6-31++G(d,p) |
||
|
Vacuum |
– |
-269.465167 | -269.480562 |
0.00 |
0.00 |
|
CHCl3 |
4.9 |
-269.475150 | -269.490404 |
-6.26443 |
-6.17595 |
|
THF |
7.58 |
-269.476783 | -269.492023 |
-7.28915 |
-7.19189 |
|
MeOH |
32.63 |
-269.479858 | -269.495075 |
-9.21874 |
-9.10705 |
|
CH3CN |
36.64 |
-269.479918 | -269.495133 |
-9.25640 |
-9.14344 |
|
DMSO |
46.70 |
-269.480087 | -269.495292 |
-9.36244 |
-9.34222 |
UV-vis spectra
The electronic transitions were calculated by the TDDFT method in vacuum and in five different solvents, namely, tetrahydrofuran (THF), chloroform (CHCl3), acetonitrile (CH3CN), methanol (MeOH) and dimethylsulfoxide (DMSO) at the B3LYP level of theory with basis sets 6-31+G(d) and 6-31++G(d,p), using 30 singlet states in each case. The PCM formalism was used for calculation in solution phase and the respective optimized ground state geometries in the above mentioned solvents were used as input. Five absorption bands were found to have reasonable oscillator strength within the region of 150 nm. Some more absorption bands with strong oscillator strength were observed below 150 nm, but such bands fall deep within the vacuum UV region and were discarded as they might not be observed experimentally. Changing the medium from vacuum to different solvents causes a blue shift for all the calculated absorption bands. Some important transitions are shown in Table 3. A representative UV-vis spectrum of 1-Methoxy ethanol in CHCl3 medium calculated at TDDFT/B3LYP/6-31++G(d,p) level is given in Figure 3.
Electronic transitions in the long wavelength region (above 150 nm) with the maximum oscillator strengths are found to follow a certain trend with change in solvent polarity. For example, the transition energies shown in Table 4 increase with two important solvent polarity indices, namely, ET(30) and Z-value of the solvents (introduced by Reichardt 23 and Kosower 24 respectively) with an exception in case of chloroform. The variation of electronic transition energy (Kcal mol-1)with two solvent polarity indices, ET(30) and Z is shown in Figure 4. This indicates a specific type of interaction between molecule II and chloroform. However, the slow overall increase of transition energy with solvent polarity hints at an uneven distribution of electronic charge in the ground state which gives rise to an appreciable dipole moment of the hemiacetal molecule.
Table 3: Transition energies (eV), wave lengths of absorption maxima (nm) and oscillator strengths (f) of electronic transitions of 1-Methoxy ethanol in different media calculated by TDDFT method using two basis sets.
|
Medium |
B3LYP/6-31+G(d) |
B3LYP/6-31++G(d,p) |
|
Vacuum |
eV nm f
6.901 179.66 0.0137 7.2611 170.75 0.0326 7.4144 167.22 0.0424 |
eV nm f
6.6189 187.32 0.0136 6.9064 179.52 0.0305 7.041 176.09 0.0416 |
|
CHCl3 |
eV nm f
7.0542 175.76 0.0144 7.3004 169.83 0.0536 7.5102 165.09 0.0247 |
eV nm f
6.7551 183.54 0.0139 6.9499 178.4 0.0434 7.1042 174.52 0.0405 |
|
THF |
eV nm f
7.0787 175.15 0.0142 7.3027 169.78 0.055 7.5365 164.51 0.0228 |
eV nm f
6.7781 182.92 0.0136 6.9537 178.3 0.0438 7.1117 174.34 0.0382 |
|
MeOH |
eV nm f
7.1276 173.95 0.0141 7.3164 169.46 0.0559 7.5945 163.25 0.0228 |
eV nm f
6.8265 181.62 0.0132 6.9729 177.81 0.0437 7.1326 173.83 0.0339 |
|
CH3CN |
eV nm f
7.1292 173.91 0.0145 7.3142 169.51 0.0565 7.596 163.22 0.0227 |
eV nm f
6.8271 181.61 0.0134 6.9719 177.84 0.0441 7.1319 173.84 0.0338 |
|
DMSO |
eV nm f
7.128 173.94 0.0149 7.3124 169.55 0.0593 7.594 163.27 0.0245 |
eV nm f
6.8277 181.59 0.0139 6.971 177.86 0.0463 7.1312 173.86 0.035 |
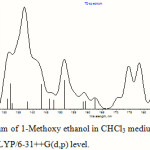 |
Figure 3: UV-vis spectrum of 1-Methoxy ethanol in CHCl3 medium calculated by TDDFT method at B3LYP/6-31++G(d,p) level. |
Table 4: Variation of transition energy of UV absorption maximum of 1-methoxy ethanol with solvent polarity.
|
Solvent |
ET(30) / kcal-mol-1 |
Z / kcal-mol-1 |
E / kcal-mol-1 |
|
THF |
37.4 |
– |
160.35 |
|
CHCl3 |
39.1 |
63.2 |
160.26 |
|
DMSO |
45.1 |
71.1 |
160.74 |
|
CH3CN |
45.6 |
71.3 |
160.76 |
|
MeOH |
55.4 |
83.6 |
160.79 |
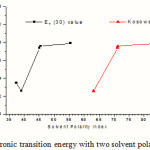 |
Figure 4: Variation of electronic transition energy with two solvent polarity indices, ET(30) and Z. |
Infrared spectra
With the optimized geometries obtained at B3LYP level in vacuum, THF, CHCl3, CH3CN, DMSO and MeOH the vibrational frequencies were calculated with 6-31+G(d) and at 6-31++G(d,p) basis sets and compared with the reported experimental results of the IR absorption bands of the hemiacetal of acetaldehyde. Anharmonicity effects were also taken into account at five different temperatures and the thermochemical results are given in the supplementary materials. Both harmonic and anharmonic frequencies are given in Table 5 along with reported experimental values 5, 6 in methanol medium. The theoretical calculated frequencies are in good agreement with the experimentally observed values, particularly if anharmonicity effect is considered.
The absorption around the region of 345 cm-1 is due to various bending vibrations present in the molecule, the absorption within the region between 1150 cm-1 to 1000 cm-1 is due to different O-C stretching and bending of the ether linkage present in the molecule, the absorption region around 3100 cm-1 is due to C-H stretching vibrations, and the absorption region in between 3800 cm-1 and 3300 cm-1 is due to O-H stretching. Table 5 lists the important vibrations observed in the hemiacetal molecule in different media. One calculated IR spectrum of 1-methoxy ethanol is also shown in Figure 5. The displacement vectors corresponding to the predicted vibrational mode at 1104 cm-1 in CHCl3 medium, calculated at TDDFT/B3LYP/6-31++G(d,p) level, is represented in Figure 6.
Table 5: Vibrational frequency data of 1-Methoxy ethanol calculated at 6-31+G(d) and 6-31++G(d,p) basis sets with and without connection for anharmonicity
|
Medium |
Frequency (cm-1) |
||||
|
B3LYP/6-31+G(d) |
B3LYP/6-31++G(d,p) |
Experimental (in MeOH) |
|||
| Harmonic | Anharmonic | Harmonic | Anharmonic | ||
| Vacuum |
939 1119 1125 1169 1233 3734 |
921 1093 1140 1157 1204 3556 |
935 1112 1121 1164 1227 3810 |
917 1087 1150 1136 1250 3637 |
920,1100 – 1150 (with a peak at 1140), 1210 |
| CHCl3 |
840 1105 1111 1155 1280 3508 |
943 972 1042 1038 1061 3244 |
929 1028 1100 1104 1149 3569 |
978 1080 1117 1147 1254 3321 |
|
| THF |
931 1103 1153 1230 3464 |
931 1160 1133 1198 3146 |
927 1148 1173 1223 3531 |
911 1173 1200 1232 3220 |
|
| MeOH |
1098 1106 1118 1149 1276 3382 |
931 999 1229 1082 1235 3019 |
1030 1110 1143 1174 1265 3447 |
917 953 1222 1178 1216 3083 |
|
| CH3CN |
928 1099 1105 1148 1228 3380 |
985 1077 1149 1139 1206 3016 |
1030 1095 1096 1143 1222 3444 |
1010 1110 1033 952 1167 3092 |
|
| DMSO |
838 1036 1098 1103 1149 3374 |
937 947 916 1017 1047 3194 |
924 1094 1143 1173 1222 3439 |
1040 1052 1120 1140 1215 3293 |
|
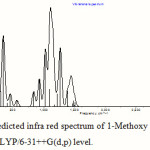 |
Figure 5: Theoretically predicted infra red spectrum of 1-Methoxy ethanol in CHCl3 medium calculated at B3LYP/6-31++G(d,p) level. |
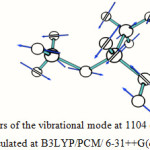 |
Figure 6: Displacement vectors of the vibrational mode at 1104 cm-1 of 1-Methoxy ethanol in CHCl3 medium calculated at B3LYP/PCM/ 6-31++G(d,p) level |
1H and 13C NMR spectra
For calculation of NMR chemical shifts the structure was optimized at B3LYP/6-311G(2d,p) level in CHCl3 medium by the PCM formalism 16- 18 and the optimized geometry was subjected to NMR calculations by the guage-independent atomic orbital method. Results are given in Table 6 where the atom labels refer to Fig.1. The 13C NMR spectrum is represented in Figure 7. The calculated 13C NMR spectrum shows three distinct signals (Fig. 7), corresponding to three different carbon environments in the hemiacetal molecule as evident from the optimized structure (Figure 2); the theoretically obtained chemical shifts are in accordance with the electronic charge distribution obtained by natural population analysis. The calculated chemical shifts for 1H NMR are clustered in the region 0.8 – 5.02 δ as shown in Table 6. The reported experimental values 2 are also in this range. Moreover, it is noteworthy (from Table 6) that the 1H NMR shifts vary in accordance with the natural charges on the H-atoms – higher electronic charge resulting in upfield resonance.
Table 6: 1H and 13C NMR chemical shifts (δ, ppm) and electronic charge distribution of 1-methoxy ethanol calculated at DFT/B3LYP/6-311+G(2d,p) level in CHCl3 solvent.Atom labels are in accordance with Figure 2.
|
Atom type |
GIAO NMR Isotropic shielding with respect to TMS (δ, ppm) |
Electronic Charge distribution |
|
H2 |
5.02 |
0.13943 |
|
H4 |
2.29 |
0.49775 |
|
H7 |
1.35 |
0.20429 |
|
H8 |
1.19 |
0.21238 |
|
H9 |
0.80 |
0.21024 |
|
H11 |
3.29 |
0.16282 |
|
H12 |
3.60 |
0.18792 |
|
H13 |
3.21 |
0.16274 |
|
C1 |
103.40 |
0.43955 |
|
C6 |
18.21 |
-0.61136 |
|
C10 |
55.16 |
-0.20759 |
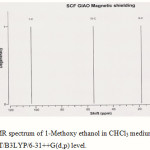 |
Figure 7: 1H NMR spectrum of 1-Methoxy ethanol in CHCl3 medium calculated at TDDFT/B3LYP/6-31++G(d,p) level. |
Summary
Attempts have been made to circumvent the difficulty in experimental detection and characterization of unstable hemiacetals by DFT- and TDDFT-based computational predictions. One such hemiacetal of interest, namely, 1-methoxy ethanol has been considered. Its structural and spectroscopic properties (UV-vis, IR, 1H and 13C NMR) in vacuum and in a series of solvents with varying solvent polarity have been calculated. The computed results are in good agreement with reported experimental data. In case of IR, consideration of anharmonicity effect yields better agreement with experiment. The UV-vis spectra are predicted to show somewhat regular blue shift with increase in solvent polarity.
Acknowledgement
P. D. thanks the UGC, New Delhi for the financial assistance extended through a minor research project (Project No. F.PSW-006/09-10).
References
- Meadows, G. W.; Darwent, B. DeB. Can. J. Chem., 30: 501-506 (1952).
- Fujiwara, Y.; Fujiwara, S. Bull. J. Chem. Soc., 36: 1106-1109 (1963).
- Isaksson, D.; Lindmark-Henriksson, M.; Manoranjan, T.; Sjödin, K.; Högberg, H.-E. J. Mol. Cat.,31: 31-37 (2004).
- Hohenberg, P., Kohn, W. Phys. Rev. B, 136: 864-871 (1964).
- Kohn, W.; Sham, L. J. Phys. Rev. A, 140: 1133-1138 (1965).
- Blair, S. A.; Thakkar, A. J. Chem. Phys. Lett. 450: 258-262 (2008).
- Gonzalez, C.; Schlegel, H. B. J. Phys. Chem., 94: 5523-5527 (1990).
- Zhao, Y. L.; Garrison, S. L.; Gonzalez, C.; Thweatt, W. D.; Marquez, M.J. Phys. Chem. A, 111: 2200-2205 (2007).
- Ghosh, S. K.; Dhara, A. K. Phys. Rev. A, 38: 1149-1158 (1988).
- Stratmann, R. E.; Scuceria, G. E.; Frisch, M. J. J. Chem. Phys., 109: 8218-8224 (1998).
- Casida, M. E.; Jamorski, C.; Casida, K. C.; Salahub, D. R. J. Chem. Phys., 108:4439-4449 (1998).
- Jensen, L.; van Duijnen, P. Th.; Snijders, J. G.; Chong, D. P. Chem. Phys. Lett., 359:524-529 (2002).
- Tiwary, A. S.; Mukherjee, A. K. J. Mol. Struct. (Theochem), 859: 107-112 (2008).
- Frisch, M. J. et. al., GAUSSIAN 03, Revision D.01, Gaussian, Inc., Wallingford, CT,(2004).
- Becke, A. D. J., Chem. Phys., 98: 5648-5652 (1993).
- Lee, C.; Yang, W.; Parr, R. G., Phys. Rev., B, 37: 785-789 (1988).
- Cossi, M.; Barone, V.; Cammi, R.; Tomasi, J. Chem. Phys. Lett., 255: 327-335 (1996).
- Canĉes, M. T.; Mennucci, B.; Tomasi, J. J. Chem. Phys., 107: 3032-3041 (1997).
- Cossi, M.; Barone, V. J., Chem. Phys., 115: 4708-4717 (2001).
- Cossi, M.; Scalmani, G.; Rega, N.; Barone, V. J., Chem. Phys., 117: 43-54 (2002).
- Mennucci, B.; Canĉes, E.; Tomasi, J. J. Phys. Chem. B, 101: 10506-10517 (1997).
- Cammi, R.; Mennucci, B.; Tomasi, J. J. Phys. Chem. A, 104: 5631-5637 (2000).
- Reichardt, C. Chemical Reviews, 94: 2319-2358 (1994).
- Malavolta, L.; Poletti, E. F.; Silva, E. H.; Schreier, S.; Nakaie, C. R., Int. J. Mol. Sci.,9: 1321-1332 (2008).


![]()


