Validated, Reversed Phase High Performance Liquid Chromatography Method for the Estimation of Atazanavir Sulfate in Pharmaceutical Formulations
M. Padmalatha1, K. Vanitha Prakash2 And Eranna Dopadally3
1Vijaya College of Pharmacy, Munganoor, Hayathnagar, Hyderabad (India).
2SSJ College of Pharmacy, V.N.Pally, Gandipet, Hyderabad (India).
3Sultan-Ul-Uloom College of Pharmacy, Banjara Hills, Hyderabad (India).
Reversed phase high performance liquid chromatographic method was developed and validated for estimation of Atazanavir Sulfate in tablet dosage form. A Sunfire C18, 250x4.6 mm i.d, 5 μm partical size, with mobile phase consisting of a buffer of 0.05 M ammonium dihydrogen orthophosphate in water and acetonitrile in the ratio of 30:70 v/v was used. The flow rate was 1.0 ml/min and the effluents were monitored at 252 nm. The retention time was 4.78min. The detector response was linear in the concentration of 80-240mcg/ml, with the regression coefficient of 0.9999. Quantification was done by calculating area of the peak and the detection and quantitation limits were 0.04 and 0.12 mcg/ml respectively. The percentage assay of Atazanavir Sulfate was 98.73%. The method was validated by determining its accuracy, precision and system suitability. The results of the study showed that the proposed RP-HPLC method can be applied for the determination of Atazanavir Sulfate in quality control samples and formulations without interferences of the excipients present.
KEYWORDS:Atazanavir sulfate; RP-HPLC; estimation and capsules
Download this article as:| Copy the following to cite this article: Padmalatha M, Prakash K. V, Dopadally E. Validated, Reversed Phase High Performance Liquid Chromatography Method for the Estimation of Atazanavir Sulfate in Pharmaceutical Formulations. Orient J Chem 2010;26(1). |
| Copy the following to cite this URL: Padmalatha M, Prakash K. V, Dopadally E. Validated, Reversed Phase High Performance Liquid Chromatography Method for the Estimation of Atazanavir Sulfate in Pharmaceutical Formulations. Orient J Chem 2010;26(1). Available from: http://www.orientjchem.org/?p=23488 |
Introduction
Atazanavir Sulfate1 is a peptidomimetic transition state inhibitor that targets HIV-1 protease and reduces the viral replication and thus the virulence of HIV-1. The drug is used in combination with reverse transcriptase inhibitors to produce excellent efficacy in patients with AIDS. The chemical name2 of atazanavir sulfate is Dimethyl(3S, 8S, 9S,12S)- 9-Benzyl-3, 12- di- tert – Butyl-8-hydroxy – 4,11 – dioxo – 6 – (p – 2 – pyr idylbenzyl) – 2,5,6,10,13 – pentaaza – tetradecanedioate sulfate(1:1) with a molecular formula C38H52N6O7.H2SO4 and a molecular weight3 of 802.93. Atazanavir Sulfate2 is azapeptide HIV protease inhibitor with antiviral activity against HIV.
Atazanavir is given with food by mouth as the sulfate, but doses are expressed in terms of atazanavir. 228mg of atazanavir sulfate is equivalent to 200mg of atazanavir. The usual adult dose is 400 mg once daily. The drug1 is well absorbed when administered orally with food(bioavailability 68%) . The drug is highly bound to plasma proteins(86%) and is metabolized by CYP3A isozyme. It is a moderate inhibitor of CYP3A. It has been suggested that atazanavir may not adversely affect the lipid profile to the extent seen with other HIV protease inhibitors. Literature survey reveals few Chromatographic methods for the determination of Atazanavir Sulfate in biological matrix like plasma4-7, human peripheral blood mononuclear cells8-9, human dried blood spots10-11 etc. However so far, no assay procedure has been reported for the estimation of Atazanavir Sulfate from pharmaceutical dosage forms. The availability of an HPLC method with high sensitivity and selectivity will be very useful for the determination of Atazanavir Sulfate in pharmaceutical formulations. The aim of the study was to develop a simple, precise and accurate reversed-phase HPLC method for the estimation of Atazanavir Sulfate in bulk drug samples and in pharmaceutical dosage form.
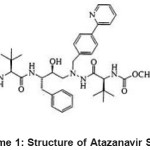 |
Scheme 1: Structure of Atazanavir Sulfate Click here to View Scheme |
Experimental
Materials and Methods
Atazanavir Sulfate was obtained as a gift sample from Hetero Drugs, Hyderabad. Ammonium dihydrogen orthophosphate was of analytical grade, and supplied by M/s S.D.Fine Chem Limited, Mumbai. Acetonitrile, methanol and water used were of HPLC grade (Qualigens). Commercially available Atazanavir Sulfate tablets (Emcure, 300 mg) were procured from local Pharmacy.
Instrument
Quantitative HPLC was performed on liquid Chromatograph, Waters separation 2996, PDA detector module equipped with automatic injector with injection volume 20 µl, and 2693 pump. A RP C-18 Sunfire column (250×4.6 mm i.d; particle size 5 µm) was used. The HPLC system was equipped with Empower Software.
HPLC Conditions
The mobile phase consisting of a buffer of 0.05 M ammonium dihydrogen orthophosphate in water and acetonitrile in the ratio of 30: 70 v/v was used. The mobile phase was filtered before use through a 0.45 µm membrane filter, and pumped from the respective solvent reservoirs to the column at a flow rate of 1.0 ml/min. The run time was set at 10.0 min and the column temperature was ambient. Prior to the injection of the drug solution, the column was equilibrated for at least 30 min with the mobile phase flowing through the system. The eluents were monitored at 252 nm.
Preparation of Standard Stock solution
A standard stock solution of the drug was prepared by dissolving 200 mg of Atazanavir Sulfate in 100 ml volumetric flask containing 60 ml of diluent (50:50 v/v methanol: water), sonicated for about 15 min and then made up to 100 ml with diluent to get a 2 mg/ml standard stock solution.
Working Standard solution
5 ml of the above stock solution was taken in 50 ml volumetric flask and thereafter made up to 50 ml with diluent to get a concentration of 200 µg/ml.
Preparation of Sample solution
Ten Capsules (Emcure, 300 mg) were weighed, and then powdered. A sample of the powdered tablets, equivalent to 200 mg of the active ingredient, was mixed with 60 ml of diluent. The contents of the flask was sonicated to ensure complete solubility of the drug, and then filtered through a 0.45 µm membrane filter, followed by adding diluent to obtain a stock solution of 2.0 mg/ ml. An aliquot of this solution was transferred to a 10 ml volumetric flask and made up to sufficient volume with mobile phase to give a concentration of 200 mcg/ml.
Linearity
Aliquots of standard Atazanavir Sulfate stock solution were taken in different 10 ml volumetric flasks and diluted up to the mark with the diluent such that the final concentrations of Atazanavir Sulfate are in the range of 80-240mcg/ ml. Each of these drug solutions (20 µL) was injected three times into the column, and the peak area and retention time were recorded.Evaluation was performed with PDA detector at 252 nm and a Calibration graph was obtained by plotting peak area versus concentration of Atazanavir Sulfate (Fig 2). The plot of peak area of each sample againstrespective concentration of Atazanavir Sulfate was
found to be linear in the range of 80-240 mcg/ml with correlation coefficient of 0.9999. Linear regression least square fit data obtained from the measurements are given in table I. The respective linear regression equation being Y= 42141x +59536. The regression characteristics, such as slope, intercept, and correlation co-efficientwere calculated for this method and given in Table I.
Assay
20 µl of sample solution was injected into the injection port of liquid chromatograph. The retention time was found to be 4.78mins. The amount of drug present per tablet was calculated by comparing the peak area of the sample solution with that of the standard solution. The data are presented in Table 2.
Recovery Studies
Accuracy was determined by recovery studies of Atazanavir Sulfate, known amount of standard was added to the preanalysed sample and subjected to the proposed HPLC analysis. Results of recovery study are shown in Table 2. The study was done at three different concentration levels.
Results and Discussion
The system suitability tests were carried out on freshly prepared standard stock solution of Atazanavir Sulfate. Parameters that were studied to evaluate the suitability of the system are given in Table 3.
Limit of Detection (LOD) and Limit of Quantification (LOQ)
The limit of detection (LOD) and limit of quantification (LOQ) for Atazanavir Sulfate were found to be 0.04 and 0.12 µg/ml respectively. The signal to noise ratio is 3 for LOD and 10 for LOQ. From the typical chromatogram of Atazanavir Sulfate as shown in fig 1, it was found that the retention time was 4.78min. A buffer of 0.05 M ammonium dihydrogen orthophosphate in water was found to be most suitable to obtain a peak well defined and free from tailing. In the present developed HPLC method, the standard and sample preparation required less time and no tedious extraction were involved. A good linear relationship (r=0.9999) was observed between the concentration range of 80-240mcg/ml. Low values of standard deviation are indicative of the high precision of the method. The assay of Atazanavir Sulfate tablets was found to be 98.73%. From the recovery studies it was found that about 98.95% of Atazanavir Sulfate was recovered which indicates high accuracy of the method. The absence of additional peaks in the chromatogram indicates non-interference of the common excipients used in the tablets. This demonstrates that the developed HPLC method is simple, linear, accurate, sensitive and reproducible. Thus, the developed method can be easily used for the routine quality control of bulk and tablet dosage form of Atazanavir Sulfate within a short analysis time.
Table 1: Linear regression data for calibration curves
| Drug | Atazanavir Sulfate |
| Concentration range (mcg/ml) | 80-240 |
| Slope (m) | 42141.0 |
| Intercept (b) | 59536 |
| Correlation coefficient | 0.9999 |
Table 2: Results of HPLC assay and Recovery studies
| Sample | Amount claim | % found by the | % Recovery* |
| (mg/tablet) | proposed method | ||
| 1. | 400 | 101.85 | 100.16 |
| 2. | 400 | 100.95 | 98.95 |
| 3. | 400 | 99.35 | 99.75 |
*Average of three different concentration levels.
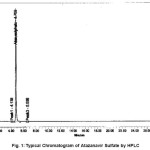 |
Figure 1: Typical Chromatogram of Atazanavir Sulfate by HPLC Click here to View figure |
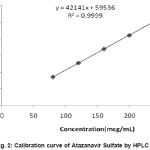 |
Figure 2: Calibration curve of Atazanavir Sulfate by HPLC Click here to View figure |
Table 3: Validation Summary
| Validation Parameter | Results |
| System Suitability | |
| Theoretical Plates (N) | 11569 |
| Tailing factor | 1.12 |
| Retention time in minutes | 4.78 |
| LOD (mcg/ml) | 0.04 |
| LOQ (mcg/ml) | 0.12 |
Acknowledgements
The authors are grateful to M/s Hetero Drugs, Hyderabad for the supply of Atazanavir Sulfate as a gift sample and to the Principal, Sultan-Ul-Uloom college of Pharmacy, Hyderabad, for providing the necessary facilities to carry out the research work.
References
- Thomas L. Lemke; David A. Williams; Foye’s Priniciples of Medicinal Chemistry, 6th Edition, Chapter 43, Pg. 1223. Lippincott Williams and Wilkins.
- Sean C. Sweetman; Martindale- The Complete Drug Reference, 34th Edition, Pharmaceutical Press, London, Chicago, Pg.629 (2005).
- The Merck Index, XIV edition, Merck Research Laboratories, (Monograph No 858) 142 (2006).
- Colombo, S.; Guignard,N.; Marzolini, C.;Telenti A.; Biollaz, J.; Decostered, L. A.; Journal of Chromatography B:Analytical Technologies in the Biomedical and Life Sciences, 810(1): 25- 34 (2004).
- Cateau, Estelle.; Tournier, Nicolas.; Dupius Antoine.; Le Moal, Gwenael.; Venisse, Nicolas.; Jounal of Pharmaceutical & Biomedical Analysis, 39(3-4): 791- 795 (2005).
- Sparidans, Rolf W.; Dost, Frits.; Crommentyn, Kritel M. L.;Huitema, Alwin D. R.; Schellens, Jan H. M.; Beijnen Jos H.; Biomedical Chromatography, 20(1): 72- 76 (2006).]
- Cattaneo, Dario.; Maggiolo Franco.; Ripamonti. Diego,; Perico, Norberto.; Journal of Chromatographic Science, 46(6): 485- 489 (2008).
- Jemal, Mohammed.; Rao, Satish.; Gatz, Michael; Whigan, Daisy.; Journal of Chromatography B:Analytical Technologies in the Biomedical and Life Sciences, 795(2): 273-289 (2003).
- Colombo, S.; Beguin, A.; Telenti A.; Biollaz, J.; Buclin, T.; Rochat, B.; Decostered, L. A.; Journal of Chromatography B:Analytical Technologies in the Biomedical and Life Sciences, 819(2): 259- 276 (2005).
- Koal, Therese.; Burhenne Heike.; Roemling, Regina.; Svoboda, Michal.; Resch, Klaus.; Kaever, Volkhard; Rapid Communications in Mass Spectrometry, 19(21): 2995-3001 (2005).
- Ter Heine, R.; Rosing, H.; van Gorp, E. C. M.; Mulder, J. W.; van der Steeg, W. A.; Beijnen, J. H.; Huitema, A. D. R.; Journal of Chromatography, B: Analytical Technologies in the Biomedical and Life Sciences, 867(2): 205-212 (2008).

This work is licensed under a Creative Commons Attribution 4.0 International License.
About The Author
![]()
A New Edition of Web of Science
Journal Impact Factor
2022: 0.5
Five Year: 0.8
Journal is Indexed in

Cabells Whitelist
![]()


