Spatial and temporal bottom sediment characteristics of Pahang River-Estuary, Pahang, Malaysia
A. Siti Waznah1, B. Y. Kamaruzzaman1*, M. C. Ong2, S. Z .Rina1
1Institute of Oceanography and Maritime Studies, International Islamic University Malaysia, Jalan Sultan Ahmad Shah, Bandar Indera Mahkota, 25200 Kuantan, Pahang, (Malaysia).
2Faculty of Maritime Studies and Marine Science Universiti Malaysia Terengganu- 21030 Kuala Terengganu, Terengganu, (Malaysia).
Article Received on :
Article Accepted on :
Article Published : 02 Mar 2010
Bottom sediment samples from Pahang river- estuary were analyzed for the sediment characteristics in order to understand better sedimentation processes in the estuary. The mean, sorting, skewness and kurtosis values of each sample were determined by the Moment’s method. This study showed that the sediment characteristics were not significantly differ (p > 0.05) with the seasonal changes, except for sorting (p < 0.05). The sediment mean size becomes finer towards the estuarine area with the range of very coarse sand to fine silt. This indicates that the characteristics of deposited sediments at each station are much dependant upon the combination of physical forces such as freshwater run-off, tidal currents and waves.
KEYWORDS:Pahang river-estuary; sediment characteristics; mean size; sorting; skewness; kurtosis; pre-monsoon; post-monsoon
Download this article as:| Copy the following to cite this article: Waznah A. S, Kamaruzzaman B. Y, Ong M. C, Rina S. Z. Spatial and temporal bottom sediment characteristics of Pahang River-Estuary, Pahang, Malaysia. Orient J Chem 2010;26(1). |
| Copy the following to cite this URL: Waznah A. S, Kamaruzzaman B. Y, Ong M. C, Rina S. Z. Spatial and temporal bottom sediment characteristics of Pahang River-Estuary, Pahang, Malaysia. Available from: http://www.orientjchem.org/?p=11503 |
Introduction
Estuaries and rivers are often regions of high sedimentation, serving as traps for minerals from inland sources transported seaward by rivers, and materials from the coastal ocean transported landward. Determinations of the relative contributions of inland and marine sources of sediments in estuaries are necessary for predicting and controlling sedimentation in habours, and becoming the sites of major discharges of urban and industrial pollutants. Grain size analysis is a classical sedimentological method which has been widely used in the studies of sedimentary environment and sedimentary process. In the recent 20 years, many geologists tried to recover transport directions and paths of sediments according to the spatial distributions of sediment grain size parameters (Shi Xuefa et al., 2002). McLaren (1981), McLaren and Bowles (1985) demonstrated that there is a relationship between net transport direction of sediments and certain spatial variation of grain size parameter, and four grain size parameters; average grain size (Xφ), sorting coefficient (σφ), skewness (Skφ), and kurtosis (Kφ) were commonly used to recover the transport direction of sediments. Gradually, the method of grain size trend analysis has been set up (Gao and Collins, 1992; 1994). At present, this method has been widely used in the study of coarse-grained sedimentary environments such as estuary, coastal zone and tidal channel, but it is relatively seldom applied to continental shelf (Gao and Collins, 1998; Cheng Peng and Gao, 2000).
In Malaysia, there is little research done regarding spatial and temporal variation of bottom sedimentation along the river. The information about sedimentation rate or erosion aspects is very limited. Nevertheless, detailed investigation concerning both spatial and temporal variability are required in order to better understand the sedimentation processes in the estuaries and along the Kuala Pahang river. In view of the importance of the bottom sedimentation data to various aspects of the environment, this study was carried out. The aim of this research is to determine the sediment characteristics such as mean size, sorting, skewness and kurtosis as well as their distribution patterns.
Material and Methods
Sampling sites
The study was carried out at Pahang river-estuary (Figure 1). Pahang river- estuary located at Pekan, which is situated about 50km south of Kuantan. This area has a humid tropical climate with two monsoon periods, characterized by bimodal patterns: southwest and northeast monsoons. Pahang river- estuary is mostly influenced by the semidiurnal tides with two high tides and two low tides within a lunar day. A total of 62 bottom sediments which lies between longitude 103o25’56.48″ E to 103o29’10.55″ E and latitude 03o33’01.78″ N to 03o30’50.38″ N, were collected during pre-monsoon (August) and post-monsoon (April) seasons using Ponar grab.
Analytical Methods
Grain sizes of the sediments were determined using the standard dry and wet sieving techniques (Folk, 1974). Samples which consists of more than 90% sand were analysed using the dry sieving method, while samples having more than 90% fine sediments were analysed using the laser diffraction method. The median grain size of the sediment was estimated by linear interpolation of the distribution curve. Both median and mean grain size were used in the preliminary data analysis, although only the mean is presented in this study because both parameters show equivalent results. Sedimentological characteristics are reported in phi units using the conversion factor of Folk (1974) as below. By using the negative value, coarse grain size will have a lower phi (Ø) value which tend to increase when the particles size become finer.
Ø = -log2 D
where D is diameter of particle in mm.
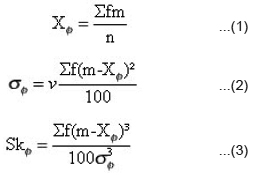
The mean, standard deviation and skewness of each sample were calculated by the moments method using equations defined by McBride (1971). The method of moments uses data from every grain plot data to obtain statistical information concerning the sedimentary population. The formula proposed by McBride (1971) used to calculate the sedimentological characteristics of mean, skewness and sorting are as follows:
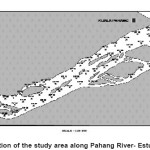 |
Figure 1: Location of the study area along Pahang River- Estuary, Pahang Click here to View figure |
where
X ø = mean size
σ ø = sorting
Sk ø = skewness
φ = weight % or volume % (frequency) of each size class
n = number of sample
m = mid-point of each size class
Silt and clay content of the bottom sediment were analyzed using the laser diffraction method. The laser diffraction technique is based on the principle of laser ensemble light scattering. Briefly, samples were prepared by first dissolving all carbonates using 4M hydrochloric acid (HCl) solution. Then the organic components were removed by adding 20% hydrogen peroxide (H2O2) solution, and finally with calgon (dispersing agents) solution to break up the flocs that may have formed with clays. The solution was stirred, and measured using the subjected ultrasonic bursts of 10 to 15 seconds duration, before being poured into the Particle Size Analyzer (PSA) system.
Results and Discussion
Figs. 2, 3, 4 and 5 showed the distribution patterns of sediment mean size, sorting, skewness and kurtosis for both pre- monsoon and post-monsoon seasons, respectively. Mean size usually serves a simple indication of the force applied to the sediment to move the grains, or a very rough indicator of energy state. In this study, stations at the upstream area were much coarser compared to the downstream area for both seasons. This phenomenon was also proved by the spatial statistical analysis (p < 0.05); where the sediment was dominantly coarsely type (Figure 2). The mean size indicate that the fine sand were deposited at a moderately low energy conditions and the coarse sand were deposited at a high energy conditions. The variation in phi mean size, therefore, reveals the differential energy conditions leads to the deposition of these kinds of sediments in different locations.
In general, sorting identifies sediment in terms of the variability in the size of its particles. Sorting commonly occurs throughout the process of weathering, erosion and deposition (Briggs, 1977; Dyer, 1985). This study shows that most of the stations were occupied by the poorly sorted sediment, with the ranges of 0.74 to 2.37Ø and 0.74 to 1.70Ø for both pre- monsoon and post-monsoon seasons (Figure 3). This indicates a wide range of particle size had been occurred. These ranges of grain size typically result from fluctuations in the velocity of the transporting agents, such as water or wind. The greater the speed and energy involved, the larger or heavier are the particles that can be transported. These conditions also explained the reasons of the significant differences observed among the stations and seasons (p < 0.05) for the sorting distribution.
Skewness is the measure of the degree of symmetry to provide a measure of the tendency of the data to spread preferentially to one side of the average value. The average of skewness values for pre- monsoon and post- monsoon seasons are 0.10 ± 0.45Ø and 0.13 ± 0.32Ø, respectively (Figure 4). The symmetry of the samples varies from strongly fine skewed to strongly coarse skewed nature for both seasons. The strongly fine skewed and fine skewed sediments (which are dominant in this study) generally imply the introduction of fine material or removal of coarser fraction (Friedman, 1961) or winnowing of sediments (Duane, 1964). The predominant fine skewed nature of sediments indicates excessive riverine input. The positive skewness of sediments also indicates the unidirectional transport or the deposition of sediments in sheltered low energy environment (Brambati, 1969).
Kurtosis is a statistical value measuring the degree of peakedness of a normal distribution curve for mean size distribution and is associated with standard deviation (sorting) value. According to this study, majority of the samples falls under leptokurtic to very leptokurtic nature of distributions, which varied from 1.83 to 5.77Ø and 1.75 to 5.32Ø for both pre-monsoon and post-monsoon seasons (Figure 5). Friedman (1962) suggested that extreme high or low values of kurtosis imply that part of the sediment achieved its sorting elsewhere in a high energy environment. The variation in the kurtosis values is a reflection of the flow characteristics of the depositing medium (Seralathan and Padmalal, 1994; Baruah et al., 1997). Finer in size and dominant leptokurtic nature of sediments typically reflect maturity of the sand and variation in the sorting values are likely due to continuous addition of finer or coarser materials in varying proportions (Prabhakara Rao et al., 2001).
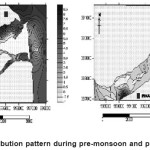 |
Figure 2: Mean size distribution pattern during pre-monsoon and post-monsoon seasons Click here to View figure |
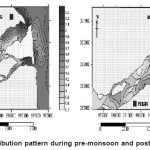 |
Figure 3: Sorting distribution pattern during pre-monsoon and post-monsoon seasons Click here to View figure |
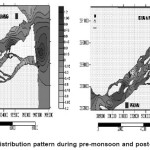 |
Figure 4: Skewness distribution pattern during pre-monsoon and post-monsoon seasons Click here to View figure |
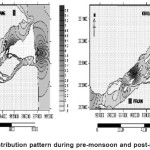 |
Figure 5: Kurtosis distribution pattern during pre-monsoon and post-monsoon seasons Click here to View figure |
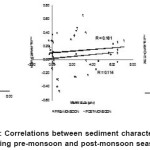 |
Figure 6: Correlations between sediment characteristics during pre-monsoon and post-monsoon seasons Click here to View figure |
Figure 6 shows the correlations between mean size and sorting, skewness, and also kurtosis for both seasons. Most researchers proposed that the employment of mean size & sorting value as a tool of an indicator to the sediment distribution pattern. Therefore, this study indicates that the transformation of sediment transport was most probably happen with the proportion of coarse sand poorly sorted sediment. The correlation between mean size & skewness indicated that the symmetry of skewness tended to be positively skewed with the increasing of mean size. Besides, the correlation among mean size and kurtosis showed that the leptokurtic of sediment decreasing as the mean size in phi increasing.
Conclusion
The statistical analyses for all four sediment parameters implied that there were no significant differences observed with the changes of seasons, except sorting. However, spatially there were significant differences obtained for the all four parameters; mean size, sorting, skewness and kurtosis. Thus, it can be concluded that sediment characteristics in the study area are not much influenced by the monsoon seasons. The characteristics of deposited sediments at each station are possibly dependant upon the combination of physical forces such as freshwater run-off, tidal currents and waves, even thought those combinations were not discussed in this study
Reference
- Baruah J. Kotoky.P. and Sarma. J.N., textural and geochemical study on river sediments: A case study on the Jhanji river, Assam. Jour. Indian Assoc. Sedimentologists. 16:195-206 (1997):
- Brambati. A., Stratigraphy and sedimentation of Siwaliks of North Eastern India. Proc. Inter. Sem. Intermontane Basins: Geology and Resources, Chiang Mai, Thailand. 427-439 (1969).
- Cheng Peng, Gao Shu, Characteristics of grain size parameters and net transport trend of seabed sediments in the North Yellow Sea, Oceanologia et Limnologia Sinica (in Chinese), 31(6): 604 (2000).
- Dixit, S.S. and Witcomb, D. Heavy Metal Burden in Water, Substrate and Microinvertebrate Body Tissue of a Polluted River Irwell (England). Environmental Pollution (Series B). 6: 161-172 (1983).
- Duane, D.B., Significance of skewness in recent sediments, western Pamlico Sound, North Carolina; Jour. Sed. Pet., 34: 864-874 (1964).
- Friedman, G.M., distinction between (sic) dune, beach, and river sands from their textural characteristics: Jour. Sed. Pet., 31: 514-529 (1961).
- Friedman, G.M., On sorting, sorting coefficients and the log normality of the grain-size distributions of sandstones. Jour. Geol. 70: 737-753 (1962).
- Gao Shu, Collins, M., Sediment grain size trend and marine sediment dynamics, Chinese Scientific Foundation (in Chinese),12(4): 241 (1998).
- Gao, S., Collins, M., Analysis of grain size trends, for defining sediment transport pathways in marine environments, Journal Coastal Research, 10: 70 (1994).
- Gao, S., Collins, M., Net sediment transport patterns inferred from grain-size trends, based upon definition of “transport vectors”- reply, Sedimentary Geology, 81: 47 (1992).
- Mclaren, P., An interpretation of trends in grain size measurements, Journal of Sedimentary Petrology, 51: 611 (1981).
- Mclaren, P., Bowles, D., The effects of sediment transport on grain size distribution, Journal of Sedimentary Petrology, 55: 457 (1985).
- Prabhakara Rao.A., Anilkumar.V., Yugandhar Rao.A., Ravi.G.S. and Krishnan.S., Grain size parameters in the interpretation of deposistional environments of coastal sediments between Bendi Creek and Vamsadhara river, East Coast, India. Jour. Indian Assoc. Sedimentologists. 20(1): 106-116 (2001).
- Seralathan.P. and Padmalal.D., Textural studies of the surficial sediments of Muvattupuzha river and central Vembanad Estuary, Kerala. Jour. Geol. Soc. India. 43: 179-190 (1994).
- Shi Xuefa, Chen Chunfeng, Liu Yanguang, Ren Hong & Wang Huiyan, Trend analysis of sediment grain size and sedimentary process in the central South Yellow Sea, (in Chinese Science Bulletin), 47(14 ) (2002).

This work is licensed under a Creative Commons Attribution 4.0 International License.
![]()
A New Edition of Web of Science
Journal Impact Factor
2022: 0.5
Five Year: 0.8
Journal is Indexed in

Cabells Whitelist
![]()


