Spectrofluorimetric Determination of Flutamide in Pharmaceutical Preaparations
A. Anton Smith1*, R. Manavalan1, K. Kannan1 and N. Rajendiran2
1Department of Pharmacy, Annamalai University, Annamalainagar - 608 002 India. 2CAS in Marine Biology, Annamalai University, Parangipettai - 608 502 India. Corresponding Author E-mail: auantonsmith@yahoo.co.in
A simple and reliable spectrofluorimetric method has been developed for the determination of flutamide in the pharmaceutical preparation. The fluorescence of the product was found to have excitation at lmax 255 nm and emission lemi at 375 nm. The method shows high sensitivity with linearity range from 0.1 to 0.6 μg/ml. The lower limit of detection (LOD) was found to be 1.972.
KEYWORDS:Flutamide; Fluorimetry; Reduction
Download this article as:| Copy the following to cite this article: Smith A. A, Manavalan R. Kannan K, Rajendiran N. Spectrofluorimetric Determination of Flutamide in Pharmaceutical Preaparations. Orient J Chem 2008;24(1). |
| Copy the following to cite this URL: Smith A. A, Manavalan R. Kannan K, Rajendiran N. Spectrofluorimetric Determination of Flutamide in Pharmaceutical Preaparations. Orient J Chem 2008;24(1). Available from: http://www.orientjchem.org/?p=23196 |
Introduction
Flutamide chemically 2 – methyl – N – [4 – nitro – 3 – (trifluoromethyl) phenyl] propanamide is used as antineoplastic and antiandrogen drug [1]. Flutamide is a powerful nonsteroidal androgen antagonist which is used to treat prostate cancer, is believed to block androgen receptor sites. This drug and its primary hydroxy metabolite decreases metabolism of C – 19 steroids by the cytochrome P – 450system at the target cells in the secondary sex organ [2]. A survey of literature reveals that there are not many methods for the assay of the drug. The reported methods include polarography [3], gas chromatography [4], and high performance liquid chromatography [5]. The polarographic, UV spectrophotometric and HPLC determination of flutamide in tablets has been reported [6]. The spectrophotometric methods available for the determination of flutamide include the formation of yellow color with hydrochloric acid with λmax of 380 nm suffers from various drawbacks [7], using promethazine hydrochloride or resorcinol, or N – (1 – naphthyl) ethylenediamine dihydrochloride (NEDA) [8], two more spectrophotometric methods which do not give much information about the optical characteristics makes use p – dimethylamino cinnamaldehyde or NEDA or resorcinol [9,10],using chromotropic acid alone as coupling agent [11, 12]. The authors have made some attempts in this direction, and succeeded to develop a new method by reducing the nitro group to amino group. This method offers the advantages of sensitivity, selectivity, rapidity and more stability when compared to other existing method without any need for extraction.
Experimental
Chemicals and Reagents
Flutamide sample was supplied by M/s Cipla Ltd, India as gift sample and used as such. Methanol used was spectro grade from S.D fine chemicals Ltd, India. Hydrochloric acid used was Analytical Reagent grade from Merck Ltd., India. Water used was HPLC grade generated from Milli-RO 10 plus Milli-Q purification system. (Milli Q Academic from Millipore (India) Pvt. Ltd. All other chemicals used were of analytical reagent grade supplied by M/S Fisher Inorganics and Aromatics Ltd, India.
Standard Solutions
Stock Solution
Flutamide (50 mg) was accurately weighed transferred and dissolved in 100 ml of standard flask containing 4 ml of methanol, 0.5 g of Zinc dust and 1 ml of concentrated hydrochloric acid for reduction [12]. The mixture was kept aside for 30 min, and at the end of 30 min sodium bicarbonate was added to neutralize the above solution, till the effervescence subside and made up to the volume with water. Then the solution was filtered. Further dilutions were made with water to get required concentration. For linearity study, serial dilutions were made for flutamide in the range of 0.1 to 0.6 mcg/ml concentrations were prepared by diluting the stock solution with water. For each concentration six replicates were made by individual weighing. The solutions were investigated in spectrofluorimeter by keeping the excitation as 255 nm and emission as 375 nm.
For Formulation
The average weight of the tablets were determined by weigh 20 tablets and powdered. Tablet powder equivalent to 50 mg of flutamide was weighed and transferred to a 100 ml volumetric flask containing 4 ml of methanol, 0.5 g of Zinc dust and 1 ml of concentrated hydrochloric acid, sonicated for 15 minutes for the complete dissolution of drugs. The mixture was kept aside for 30 min and at the end of 30 min sodium bicarbonate was added to neutralize the above solution, till the effervescence subside and made up to the volume with water. Then the solution was filtered, further dilutions were made with water to get required concentration of 0.4 µg/ml. Six replicates of analysis were carried out with sample weighed individually. The average weight of the tablet was found to be 0.75185 g.
Method Validation
Method validation was performed in terms of specificity and selectivity, precision and accuracy, linearity and stability.
Specificity and Selectivity
The interference from endogenous compounds was investigated by the analysis of six different blank matrices.
Precision and Accuracy
Method validation regarding reproducibility was achieved by replicate injections of extracted standard solutions at low, medium and high concentration levels, where Intensity of fluorescence were measured in comparison to the Intensity of fluorescence of the standard.
Intermediate precision study (day – to – day reproducibility) was conducted during routine operation of the system over a period of six consecutive days. Statistical evaluation revealed relative standard deviations at different values of six replicates. Within – day repeatability was studied by six replicate at three concentration levels.
Results and Discussion
Calibration curves
Calibration standards for flutamide, covering the range 0.1 – 0.6 μg/ml, were prepared by the method mentioned above and serial dilutions were made with water. The calibration curve was obtained by plotting the intensity of fluorescence of the flutamide versus analyte concentration. The slope and intercept of the calibration line was determined by linear regression using the least squares method. In Figure 1 regression analysis of the calibration curve showed a linear relationship between the intensity of fluorescence of flutamide and the concentration, with correlation coefficients higher than 0.9934 in all the curves assayed in pure form. The precision and accuracy of the assay are presented in Table 1 and 2.
Table 1: Analysis of tablet formulation
|
Formulation |
||
|
Sl no. |
Drug Content (mg/tab) |
%Label claim |
|
1 |
250.4027 |
100.1611 |
|
2 |
250.9793 |
100.3917 |
|
3 |
250.7668 |
100.3067 |
|
4 |
251.4233 |
100.5693 |
|
5 |
249.4786 |
99.79145 |
|
6 |
251.9764 |
100.7906 |
|
Mean |
250.8379 |
100.3351 |
|
SD |
0.860354 |
0.344142 |
Table 2: Accuracy of Flutamide
|
Level added (%) |
Recovery (%)* |
SD |
|
25% |
100.6319
|
0.3430
|
|
50% |
98.6827
|
0.6988
|
|
75% |
99.2839
|
0.5431
|
* Mean of three determinations
Selectivity and Specificity
The drug flutamide in the formulation was well identified under this condition. There is no interferences was observed in six different blank samples of flutamide. Figure 1 shows the regression analysis of the calibration curve for flutamide in pure form showed a linear relationship between the intensity of fluorescence and the concentration, with correlation coefficients higher than 0.9934 in all the curves assayed. Figure 2 shows the absorption Spectrum of flutamide, Figure 3 shows absorption Spectrum of flutamide (reduced form) and Figure 4 shows fluorescence spectrum of flutamide (reduce form) at 255nm as excitation.
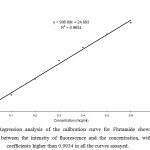 |
Figure 1: Regression analysis of the calibration curve for Flutamide showed a linear relationship between the intensity of fluorescence and the concentration, with correlation coefficients higher than 0.9934 in all the curves assayed. Click here to View Figure |
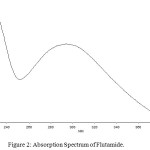 |
Figure 2: Absorption Spectrum of Flutamide. Click here to View Figure |
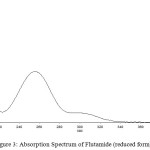 |
Figure 3: Absorption Spectrum of Flutamide (reduced form). |
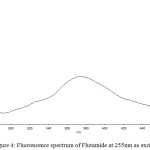 |
Figure 4: Fluorescence spectrum of Flutamide at 255nm as excitation. |
Limit of Detection (LOD) and Limit of Quantification (LOQ)
The LOD determined as the amount of drug was found to be 1.972 x 10⁻³ µg/ml and the LOQ was determined as the lowest concentration was found to be 5.975 x 10⁻³ µg/ml in formulation.
Robustness
The method has been used by two different analysts, with between person variability, within the range of inter – assay variabilities observed for the same analyst. For the lack of resources, the method could not be repeated in a different laboratory or using different equipment.
Accuracy was estimated as the deviation to the observed mean concentration from actual concentration and found to be less than 2% for all the concentrations.
Conclusions
A spectrofluorimetric method for quantifying flutamide in formulation has been developed and validated. The assay is selective, precise, accurate and linear over the concentration range studied. The concentration of flutamide is as low as 5.975 x 10⁻³µg/ml in formulation could be precisely quantified and LOD was approximately 1.972 x 10⁻³ µg/ml in formulation. The method is simple and suitable for the determination of flutamide in pharmaceutical preparations.
Acknowledgement
We thank Cipla Ltd., Goa for the generous gift of flutamide for the support towards this research work.
References
- Budavari.S, O’Neil, M.J.Smith, A., Heckelman, P.E, Merck Index, XI ed. Merck and Co. Inc., Rathway, NJ, USA, 658 (1989).
- Osol, A., Hoover, J.E., Remington’s Pharmaceutical Sciences, XVIII ed., Marck publishing company, Easton, PA, 1152 (1996).
- Snycerski, A., Polarographic determination of flutamide, J. Pharm. Biomed. Anal. 7: ,1513-1518 (1989).
- Sane, R.T., Gangrade, M.G., Bapat, V.V., Surve, S.R., Chonkar, N.L., Gas choromatographic determination of flutamide, nimodipine and ticlopidine hydrochloride from their pharmaceutical preparations, Indian drugs, 30: 147-151 (1993).
- Farthing, D., Sica, D., Fakhry, I., Walters, D.L., Cefali, E.A., Allan, G., Determination of flutamide and hydroxyflutamide in dog plasma by a sensitive high-peerformance chromatography method utilizing mid-bore chromatography, Biomed. Chromataography, 8(8): 251-254 (1994).
- Alvarez-Lueje, A., Pena, C., Nunez-Vergara, L.J., Squella, J.A., Electrochemical study of flutamide, an anti cancer drug and its polarographic, uv spectrophotometric and HPLC determination in tablets, Electroanalysis, 15: 1043-1055 (1998).
- Zarapkar, S.S., Damie, C.D., Halkar, U.P., Spectrophotometric determination of flutamide and its pharmaceutical formulations, Indian Drugs, 33: 193-194 (1996).
- Rangappa, K.S., Nagaraja, P., Srinivasamurthy, K.C., New extractive spectrophotometric determination of flutamide in pure and pharmaceutical formulations, Anal. Sci.16: 637-639 (2000).
- Reddy, M.N., Murthy, T.K., Reddy, M.D., Sankar, D.G., New spectrophotometric methods for the determination of flutamide, Asian J. Chemistry, 13: 241-243 (2001).
- Reddy, M.N., Murthy, T.K., Reddy, M.D., Sankar, D.G., Spectrophotometric estimation of flutamide in pharmaceutical dosage forms, Asian J. Chemistry, 13: 1261-1262 (2001).
- Kanchugarakoppal S. Rangappa, Padmarajaiah Nagaraja,and Kodagahalli Channaiah Srinivasa Murth, New Extractive Spectrophotometric Determination of Flutamide in Pure and Pharmaceutical Formulations, Analytical Sciences, Vol. 16: 637 (2000).
- Reddy K.M, Suvardhan .K,Suresh .K,Prabahar .S, Chiranjeevi .P, New spectrophotometric method for the determination of flutamide in pharmaceutical preparation using chromotropic acid as a coupling agent, Proceedings of the third International Conference on Environmental and Health, Chennai, India, 15-17 December, 2003.Chennai: Department of Geography, University of Madras and Faculty of Environmental Studies, York University. Pages 410 – 416.

This work is licensed under a Creative Commons Attribution 4.0 International License.
![]()
A New Edition of Web of Science
Journal Impact Factor
2022: 0.5
Five Year: 0.8
Journal is Indexed in

Cabells Whitelist
![]()


