A new homogeneous liquid-liquid extractive-spectrophotometric method for determination of diclofenac in urine
¹Department of Chemistry, Lorestan University, Khoramabad Iran.
²Quality Control Department, Exir Pharmaceutical Co., Boroojerd Iran.
³Department of Chemistry, Urmia University, Urmia Iran.
Corresponding Author E-mail: a_ghiasvand@yahoo.com
Download this article as:
![]()
A new, simple and reliable extractive-spectrophotometric method for the preconcentration and determination of diclofenac (DCF) was developed. In a strong nitric acid medium, diclofenac produced a yellowish compound in a water / tetrahydrofuran / perfluorooctanoic acid homogeneous phase that could be extracted into a sedimented microdroplet. The concentration of the extracted colored compound in the microdroplet was determined by measuring its absorbance at 376 nm. The effective experimental parameters for spectrophotometric determination of diclofenac in water and methanol were optimized, so that DCF could be sensitively determined in an aqueous or organic medium. The maximum absorbance was achieved in 1.5 and 7.0 M aqueous and methanolic solutions of nitric acid. The absorbance of DCF solutions in water and methanol obeyed Beer’s law, over the range of 1.0 - 30.0 µg cm-3 and 0.5 - 40.0 µg cm-3, with molar absorptivities of 7.4×10³ and 1.3×10⁴ dm3 mol-1 cm-1 respectively. Additionally, different experimental parameters for homogeneous liquid-liquid extractions of diclofenac were investigated. The limit of detection (LOD) achieved with the proposed method was 0.03 ng cm-3. The maximum concentration factor obtained was 6667-fold. The reproducibility of 10 replicate measurements was found to be 2.3%. Finally, the proposed method was successfully applied to the extraction and determination of diclofenac in pharmaceutical preparations and urine samples.
KEYWORDS:Diclofenac; homogeneous liquid-liquid extraction; spectrophotometric determination; urine
Introduction
Homogeneous liquid-liquid extraction (HLLE) is an efficient preconcentration method that extracts the solute from a homogeneous phase into a micro-scale sedimented liquid phase. This is produced by a phase-separation phenomenon, such as a change in the pH, temperature or ionic strength of the solution. Homogeneous phase ordinary, establishes by the ternary component solvent or perfluorinated surfactant system. Because of the homogeneity of the initial mixture that contains the solute and the extractant, there is no interface between the aqueous phase and the organic phase. Thus, initially the surface area of the interface is infinitely large. Accordingly, vigorous mechanical shaking is not necessary. In addition, the extraction time, disposal costs, consumption of, and exposure to organic solvents are reduced. The HLLE procedure is simple and requires only the addition of reagents (1). Recently, HLLE was successfully applied to the extraction of some organic and inorganic analytes in different matrices (2-6).
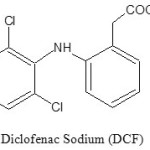
Diclofenac sodium (2-[2,6-dichlorophenyl] amino-benzeneacetic acid monosodium salt, DCF) is a non-steroidal anti-inflammatory drug (NSAID) that is used for the treatment of painful and inflammatory rheumatic and certain non-rheumatic conditions. It is administered orally, rectally or intramuscularly. The drug has a relatively short elimination half-life, which limits the potential for drug accumulation. As an analgesic it has a fast onset and long duration of action. Extensive clinical experience has been gained with diclofenac, clearly establishing its safety profile. It is well-tolerated and rarely produces gastrointestinal ulceration or other serious side effects. Thus, diclofenac can be considered one of the few NSAIDs of “first choice” in the treatment of acute and chronic painful and inflammatory conditions (7).
Different analytical methods have been reported in the scientific literature for the determination of diclofenac in human urine and in pharmaceutical preparations. These methods include: GC (8), HPLC (9), thin-layer chromatography (10), spectrofluorometry (11), H-NMR (12), potentiometry (13), and capillary electrophoresis (14). Some of these methods are not suitable for routine analysis because they require sophisticated instruments that are not yet available in many laboratories. Some of the methods involve numerous steps and tedious processes, resulting in insufficient sensitivity. Spectrophotometric methods offer practical and economical advantages over other methods, providing sensitive, precise and accurate results. Diclofenac is determined indirectly by most of the spectrophotometric methods. Colored species are formed with reagents such as copper(II) acetate (15), methylene blue (16), methylene violet (17), ferric chloride (18) and 2,2,-bipyridine (19) or via oxidation (20). In addition to interference effects and spectrum complication that occur from the presence of complexation or oxidation reagents, these methods are time consuming and usually involve a solvent extraction step with a poor concentration factor. In the present work, we report on the development of a simple, sensitive and interference free homogeneous liquid-liquid extractive-spectrophotometric method for the preconcentration and determination of diclofenac sodium in urine. A perfluorinated surfactant system and a simple modified spectrophotometric method (21) were applied for the extraction and the direct determination of diclofenac in the resulting microdroplet.
 |
Scheme 1 Click here to View Scheme |
Materials and Methods
Reagents and Apparatus
Ethanol, methanol, acetonitrile, dimethyl formamide (DMF), dimethyl sulfoxide (DMSO) and tetrahydrofuran (THF) were purchased in analytical reagent-grade from Merck or Fluka. All acids were of the highest purity available from Merck. Reagent-grade perfluorooctanoic acid (HPFOA) was purchased from Merck. Diclofenac sodium was obtained from Amoli Organics Ltd. (Gujarat, India). Doubly distilled deionized water was used for all analyses. A standard 1000 μg cm-3 diclofenac stock solution was prepared and Diclofenac sodium working solutions were prepared from the stock solution. The stock and working solutions were stored at 4˚C. Absorbance measurements were carried out with a Shimadzu UV-1650PC double-beam spectrophotometer and a 0.2 cm3 quartz cell at 380 nm (λmax, in aqueous media) and 376 nm (λmax, in methanolic solution). An Eppendorf 5810 centrifuge was used for centrifugation.
Homogeneous Liquid-Liquid Extraction and Determination of Diclofenac
A sample solution (7 cm3) containing 0.1-200 μg of diclofenac sodium, 3 cm3 of THF and 3 cm3 of 0.02 M HPFOA were placed in a 50.0 cm3 cylindrical Teflon vial fitted with a plastic cap. The mixture was left to stand for 3 minutes at room temperature. Then, 1.5 cm3 of concentrated nitric acid was added and the mixture ([HNO3]T = 1.5 M, [THF]T = 20.7% v/v, and [HPFOA]T = 4.1×10⁻³ M) was centrifuged at 3000 rpm for 10 min. After an oily sedimented liquid phase was formed, its volume was determined with a 50 μL micro-syringe and transferred to a 0.2 cm3 cell after appropriate dilution using 7.0 M nitric acid in methanol. The concentration of diclofenac was then determined at 376 nm against a reagent blank with an external linear calibration curve (1.0 – 30.0 μg cm-3; r = 0.998). To determine the remaining diclofenac in the aqueous solution (if it was necessary) 0.1 cm3 of concentrated nitric acid was added to 1 cm3 of the extracted aqueous solution. The concentration of diclofenac was then measured at 376 nm (linear calibration curve 0.5 – 40.0 μg cm-3; r = 0.997).
Determination of Diclofenac in Pharmaceutical Capsules
Ten tablets from each sample were weighed individually to obtain representative average weights. The tablets were ground into a fine powder, mixed in 200 cm3 of distilled water and shaken. Further dissolution was achieved with an ultrasonic bath (5 min). Filtration through a 0.45 μm membrane filter (Millipore) was performed to remove any remaining insoluble matter. The membrane filter was then washed three times with water. The filtrate and washing solutions were transferred into a 250 cm3 volumetric flask and diluted to the mark with distilled water. Finally 7 cm3 of the solution was then centrifuged.
Results and Discussion
Preliminary experiments illustrated that DCF reacts with strong nitric acid solution at room temperature, resulting in a yellowish product. In a weak acidic condition, DCF undergoes an intramolecular cyclization (22) and is transformed to a product that does not absorb light within the visible spectrum region. The yellow color on strong nitric acid solution may be due to nitration of benzylic acid ring in para position relative to NH group (23). The presence of NO2 in the ring induced a red shift in maximum absorption wavelength (λmax). The absorption spectra of DCF in water and methanol and in their nitric acid solutions are shown in Fig. 1. The spectra illustrate that the maximum absorbance of the yellowish product in water and methanol acidic solutions occurs at 380 and 376 nm respectively, whereas DCF does not show any absorbance at these wavelengths. Thus, 380 and 376 nm were selected as the λmax to determine the absorbance level of DCF in aqueous and organic media, respectively.
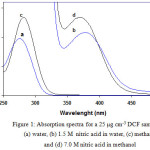 |
Figure 1: Absorption spectra for a 25 μg cm-3DCF sample in (a) water, (b) 1.5 M nitric acid in water, (c) methanol and (d) 7.0 M nitric acid in methanol |
Effect of the Acid Concentration
Different organic solvents, including ethanol, acetone, DMSO, acetonitrile and THF, were used to develop spectrometric determinations of DCF in different solutions. The acid solution of DCF in acetonitrile and DMSO did not exhibit significant color development and the color formation of DCF in the other solutions was unstable. Among the organic solvents analyzed, the acidic solution of methanol showed the greatest color development and satisfactory stability and reproducibility. Hence, methanol was selected as the organic media for dilution of sedimented liquid phase resulted from HLLE and subsequent spectrophotometric determination of DCF.
Different acid solutions were used to assess the color development of DCF in water and methanol by spectrophotometric determination. Among the acid solutions studied (H2SO4, HCl and HNO3), nitric acid was most efficient for eliciting color development. Furthermore, the concentration of nitric acid in methanol and water for the determination of DCF in the sedimented liquid phase and the extracted aqueous sample solution were studied (Fig. 2). As the results show, by increasing the concentration of nitric acid the absorbance of the colored product increases and then remains constant, in both water and methanol matrices. It is interesting to note that complete color development in methanol occurred at much higher concentrations of nitric acid (7.0 M) than water (1.5 M). From the comparison of the acidic dissociation constants, it can be concluded that acid character of water is greater than methanol and thus lower concentrations of hydrogen ions in water can induced the nitration of DCF molecule for complete color development.
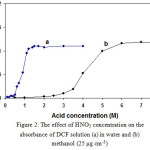 |
Figure 2: The effect of HNO3 concentration on the absorbance of DCF solution (a) in water and (b) methanol (25 μg cm-3) Click here to View Figure |
Calibration Curve for Spectrophotometric Methods
To demonstrate the linear ranges of the proposed spectrophotometric method, the DCF concentrations in aqueous and methanolic nitric acid solutions were varied and two calibration curves were constructed (Fig. 3). Absorbance of the colored system obeyed Beer’s law between 1.0 – 30.0 and 0.5 – 40.0 μg cm-3 of DCF in water and methanol, respectively. Considering the concentration factor of the proposed HLLE method (6667), these ranges extend to 0.15 – 4.5 and 0.08 – 6.0 ng cm-3 respectively. Molar absorptivities were found to be about 7.4×10³ dm3 mol-1 cm-1 for water and about 1.3×10⁴ dm3 mol-1 cm-1 for methanol.
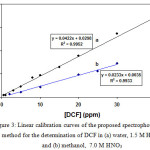 |
Figure 3: Linear calibration curves of the proposed spectrophotometric method for the determination of DCF in (a) water, 1.5 M HNO3 and (b) methanol, 7.0 M HNO3
|
Effect of the Type and Concentration of the Water-miscible Organic Solvent
Ethanol, methanol, acetonitrile, acetone, THF, DMF and DMSO were tested as the water-miscible organic solvents for the extraction of DCF using a perfluorinated homogeneous system. The results show that the addition of THF resulted in a proper oily sedimented liquid phase and the highest DCF extraction percentage. On the other hand, its application causes a complete phase-separation with the least amount of the solvent. Thus, THF was selected for subsequent experiments. Furthermore, the volume percent of THF, in the initial homogeneous phase, was optimized. From the results (Table 1) it was observed that 20.7% THF was optimal for the generation of an initial homogeneous system and subsequent phase-separation. On the other hand, this concentration provided a viscose spherical sedimented liquid phase, with a reasonable volume, suitable for handling with a micro-syringe. A delayed phase-separation was observed by using a THF volume percent higher than 26, while application of volume percents lower than 9 produced a permanent homogeneous phase. Hence, 20.7 volume percent was selected as the optimal concentration of THF for further HLLE studies.
Table 1: Effect of the THF concentration on the extraction percentage of DCF and volume of the sedimented liquid phasea
| THF concentration (v/v%) |
9.1 |
16.7 |
20.7 |
25.9 |
| Extraction percent of DCF |
76.9 |
84.0 |
99.0 |
76.2 |
| Sedimented phase volume (dm-6) |
1 |
4 |
12 |
7 |
a Conditions: 25 μg of DCF in 7 cm3 of sample solution, [HNO3]T = 1.5 M.
Effect of the HPFOA Concentration
In order to investigate the optimum amount of HPFOA for the quantitative homogeneous liquid-liquid extraction of DCF, extraction of 25 μg of DCF from 7 cm3 of a sample solution under optimal experimental conditions was conducted by varying the concentration of HPFOA (Fig. 4). As the results show, the extraction of DCF is quantitative above 4.1×10⁻³ M of HPFOA. Hence, subsequent homogeneous liquid-liquid extraction experiments were carried out using 4.1×10⁻³ M of HPFOA.
![Figure 4: Effect of the HPFOA concentration on the extraction percentage of DCF and volume of the sedimented liquid phase. Conditions: 25 μg of DCF in 7 cm3 of sample solution, [HNO3]T = 1.5 M, [THF]T = 20.7% (v/v](https://www.orientjchem.org/wp-content/uploads/2008/04/Vol24No1_new_Ghia_fig4-150x150.jpg) |
Figure 4: Effect of the HPFOA concentration on the extraction percentage of DCF and volume of the sedimented liquid phase. Conditions: 25 μg of DCF in 7 cm3 of sample solution, [HNO3]T = 1.5 M, [THF]T = 20.7% (v/v Click here to View Figure |
The optimal centrifugation time and speed were also studied. The results showed that a centrifuge speed of 2500 rpm for greater than 10 minutes resulted in quantitative extraction. Hence, the optimum centrifugation condition (10 min at 2500 rpm) was used throughout this study.
Analytical Performance
When 25 μg of DCF was added to 7, 10, 15 and 20 cm3 of the sample solution and examined under the optimal experimental condition using the proposed method, the DCF was quantitatively extracted in all cases. The results illustrate that by increasing the volume of the sample solution (increasing the volume percent of water) the volume of the sedimented liquid phase decreased. Application of the 20 cm3 sample solution produced a 3 μL sedimented liquid phase. Thus, the maximum concentration factor of the proposed method was determined to be 6667-fold. The limit of detection (LOD), 0.03 ng cm-3, for DCF was determined from 3s of 7 replicate measurements of the blank and division of the resulting value by the concentration factor (i.e. 6667). The reproducibility of the proposed method for HLLE and the spectrophotometric determination of DCF were also studied. The results obtained for 10 replicate measurements of a 7 cm3 sample solution containing 25 μg of DCF resulted in a RSD of 2.3%.
To demonstrate the applicability of the proposed method to pharmaceutical preparations, it was used for the extraction and determination of DCF in tablets from different pharmaceutical corporations. The results in Table 2 indicate a satisfactory agreement between the results obtained by the proposed method and those reported by the official HPLC method24. The proposed HLLE method was also applied for the determination of DCF in urine samples (Table 3). The results illustrate that the addition of 25 µg of DCF to 0.5 cm3 blank urine samples A, B and C were recovered quantitatively with RSDs of 3.6%, 1.2% and 2.7%, respectively.
Table 2: Determination of DCF in commercial tablets from different pharmaceutical corporationsa
|
Sample |
DCF amount (mg / tablets) |
DCF determined (mg / tablets) |
|
|
Proposed method |
Official Method |
||
| Exir Co. |
25.0 |
25.4 ± 0.6 |
26.1 ± 0.2 |
| Ramin Co. |
25.0 |
24.8 ± 0.3 |
25.0 ± 0.4 |
| Hakim Co. |
25.0 |
25.7± 0.5 |
25.3± 0.2 |
| Rooz darou Co. |
25.0 |
24.6 ± 0.4 |
24.9± 0.1 |
a 7 cm3 of sample solution, Conditions: [HNO3]T = 1.5 M, [THF]T = 20.7% (v/v), [HPFOA]T = 4.1×10⁻³ M.
Table 3: Results of the analysis of DCF in urine samplesa
|
Urine sample |
DCF determined (µg cm-3) |
||
|
After 2 hrs |
After 12 hrs |
After 24 hrs |
|
| Sample A |
3.73±0.15 |
0.85±0.13 |
0.146±0.07 |
| Sample B |
3.1±0.14 |
0.78±0.09 |
0.22±0.05 |
| Sample C |
4.38±0.12 |
0.59±0.07 |
0.114±0.02 |
a 0.5 cm3 of sample solution, Conditions: [HNO3]T = 1.5 M, [THF]T = 20.7% (v/v), [HPFOA]T = 4.1×10⁻³ M.
For evaluation of precision of the data found by proposed method with those of the reference method, tow-sided F-test, at 95 % probability level, was applied. The results are summarized in Table 4. The results show good agreement between the data of the proposed and reference method.
Table 4: Comparison of results of the proposed and reference methods, using tow-sided F-test, for the determination of DCF
|
Sample |
n |
S1 |
S2 |
FCrit. (P = 0.05) |
FExp. |
| Lorestan Co. |
5 |
0.152 |
0.052 |
9.61 |
8.33 |
| Ramin Co |
5 |
0.100 |
0.074 |
9.61 |
1.88 |
| Hakim Co |
5 |
0.129 |
0.050 |
9.61 |
6.60 |
| Roozdarou Co |
5 |
0.098 |
0.074 |
9.61 |
1.76 |
Conclusion
New and simple extractive-spectrophotometric methods for concentration and determination of diclofenac in water and methanol solutions using homogeneous liquid-liquid extraction were developed. In a strong nitric acid medium, diclofenac produced a yellowish compound in a homogeneous phase that could be extracted into a sedimented microdroplet. The concentration of the extracted colored compound in the microdroplet was determined by measuring its absorbance at 376 nm. The proposed method was successfully applied to the preconcentration and determination of diclofenac in pharmaceutical preparations and urine samples.
References
- Takagai Y. and Igarashi S., American Laboratory, Jul, 551 (2001).
- Sudo T. and Igarashi S., Talanta, 43, 233 (1996).
- Oshite S., Furukawa M. and Igarashi S., Analyst, 126, 703 (2001).
- Ghiasvand A.R. and Mohagheghzadeh E., Anal. Sci., 20, 917 (2004).
- Ghiasvand A.R., Shadabi S., Mohagheghzadeh E. and Hashemi P., Talanta, 66, 912 (2005).
- Ghiasvand A.R., Moradi F., Sharghi H. and Hasaninejad A.R., Anal. Sci., 20, 917 (2004).
- Todd P.A. and Sorkin E.M., Drugs 35, 244 (1988).
- Sioufi A., Pommier F. and Godbillon J., J. Chromatogr., 571, 87(1991).
- Beaulieu N., Lovering E., Lefrancois J. and Ong H., J. Assoc. Off. Anal. Chem., 73, 698 (1990).
- Sarbu C., Marutoiu C., Vlassa M.: Chromatographia, 599, 600 (1986).
- Arancibia J.A., Boldrini M.A. and Escandar G.M., Talanta, 52, 261 (2000).
- Abdel Fattah S.A., El-Khateeb S.Z., Abdel Razeg S.A. and Tawakkol M.S., Spectrosc. Lett., 21, 533 (1988).
- Pimenta A.M., Araujo A.N. and Montenegro M.C.B.S.M., Anal. Chim. Acta, 470, 185(2002).
- Hassan S.S.M., Abdel-Aziz R.M. and Abdel Samad M.S., Analyst, 119, 1993 (1994).
- Other A.N., Kustrin A., Zivanovic L.J., Radulivic D. and Vasiljevic M., Analyst, 166, 753 (1991).
- Botello J.C. and Perez Caballero G., Talanta, 42, 105 (1995).
- Sastry S.P., Prasad Tirpeneni A.S.R. and Suryanarayama M.V., Analyst, 114, 513 (1989).
- Agarwal Y.K. and Shivramchaudra K., J. Pharm. Biomed. Anal., 9, 97 (1991).
- Kamath B.V. and Shivramchaudra K., Anal. Lett., 26, 903 (1993).
- Ortega-Barrales P., Ruiz-Medina A., Fernandez de Cordova M.L. and Molina-Diaz A., Anal. Sci., 15, 985 (1999).
- Matin A.A., Farajzadeh M.A. and Jouyban A., Il Farmaco, 60, 855 (2005).
- Muangsin N., Prajuabsook M., Chimsook P., Chantarasiri N., Siraleartmukul K., Chaichitc N. and Hannongbuaa S., J. Appl. Cryst., 37, 288 (2004).
- Diclofenac Tablets. In: British Pharmacopoeia, Volume III, Monographs, Formulated Preparations, London (2003).


![]()


