Ultrasonic and UV Analysis on Aqueous Non-Ionic Surfactants
N. Chithralekha1 and A. Panneerselvam2*
1Research Scholar, R and D Centre, Bharathiar University, Coimbatore-641046, Tamilnadu, India.
2Department of Physics, Paavai Engineering College, Pachal-637018, Tamilnadu, India.
Corresponding Author E-mail: panneer.phy@gmail.com
DOI : http://dx.doi.org/10.13005/ojc/35Specialissue104
Article Received on : 02-01-2019
Article Accepted on : 22-03-2019
Article Published : 25 Mar 2019
The evaluation of various acoustical and thermo dynamical parameters which provide an idea into the nature of molecular interactions in aqueous non-ionic surfactant solutions. The measurement of ultrasonic velocity in aqueous solutions an important tool for the calculation of various acoustical parameters. These parameters have been computed through velocity, density and viscosity measurements of non-ionic surfactants (Saponin, Glucopon and Sorbitan sesquioleate) in aqueous medium. This above work was done for different concentration ranges at three different temperatures 303, 313 and 323K using Ultrasonic interferometer. The Critical Micelle Concentration (CMC) was determined to be 1.0% of Water-Saponin, Water - Glucopon, 0.8% of Water - Sorbitan sesquioleate system. These samples were characterised by UV studies.
KEYWORDS:Acoustical Parameters; Glucopon and Sorbitan Sesquioleate; Molecular Interactions; Saponin; Ultrasonic Study
Download this article as:| Copy the following to cite this article: Chithralekha N, Panneerselvam A. Ultrasonic and UV Analysis on Aqueous Non-Ionic Surfactants. Orient J Chem 2019;35(Special Issue 1 Spectroscopy March 2019). |
| Copy the following to cite this URL: Chithralekha N, Panneerselvam A. Ultrasonic and UV Analysis on Aqueous Non-Ionic Surfactants. Orient J Chem 2019;35(Special Issue 1 Spectroscopy March 2019). Available from: https://bit.ly/2UUAgpW |
Introduction
Ultrasonics is a very interesting subject during the recent years.1 To understand the nature and strength of molecular interactions the ultrasonic study of liquids is very important.2 The study of propagation of ultrasonic waves in liquids and liquid mixtures is extremely abundant helpful for examining the character of inter and intra molecular interactions. Physicochemical properties can be understood among the interfacing parts from ultrasonic velocity estimations and it may be combined with other exploratory information, such as density and viscosity to calculate different acoustical parameters. These are adiabatic compressibility, free length, acoustic impedance, relaxation time, free volume and internal pressure. This parameter values are important in understanding the molecular interactions in paired blends3,4. Ultrasonic velocity is a vital physical parameter having physical dependency.3,4 In recent years studies on acoustic parameters have become an evolving hid.5,6 Acoustic parameters are sensitive to changes and are useful in explaining the solute-solvent interaction. Furthermore the ultrasonic velocity measurements have been successfully employed to detect and assess weak and strong molecular interactions.7
Surfactants are dispersed in aqueous solution it adsorbs at interface and self-assemble in bulk solution. Surface active agents also aggregate in solution forming micelles.8,9 Physico -chemical studies of surfactant solutions are important from theoretical as well as applied points of view.10 Surfactants are classified either by their use such as soaps, detergents, wetting, foaming agents, corrosion inhibitor or by the structure they are able to build.
In aqueous solution, non-ionic surfactant did not ionise any form of ions and achieving dissolution by hydrogen bonding with water.11 The solubility of most of the non-ionic surfactants in water decreases with increasing temperature. Due to their structural features, non-ionic surfactants have different physicochemical properties than ionic surfactants. Surfactants are to make a significant decrease in surface tension or to reduce the surface tension between two liquids. In aqueous solutions, surfactant molecule start to collect and form micelle in concentration known as Critical Micelle Concentration (CMC) which is one of the most important physical parameters of surfactants.
Saponin is a kind of non-ionic natural surfactant that can be found in many plant species. They are glycosides with high molecular weight.12 The name ‘saponin’ comes from soap and traditionally used as a natural detergent. Glucopon is a surfactant which is used in laundry and manual dish applications. It shows superior wetting, dispersing and interfacial tension reduction properties. Sorbitan sesquioleate is used in a range of products with skin care products, skin cleansing products, moisturizers, eye makeup and other makeup. In this paper, the effect of non-ionic surfactants (Saponin, Glucopon and Sorbitan sesquioleate) in aqueous medium at various temperatures have been reported. These studies are important in the field of medicinal preparations, agrochemicals and detergents.
Material and Methods
Non-ionic surfactants were obtained from Bio-corporals Chennai, Tamil Nadu, India. The experimental solutions were prepared by adding a known weight of non-ionic surfactants to the distilled water and then stirring under reflux until clear solutions were obtained. Double distilled water is used to prepare the stock solution. The ultrasonic velocity measurements in the Saponin, Glucopone and Sorbitan sesquioleate with water were made in the ultrasonic interferrometer (model F81, Mittal Enterprises, New Delhi, India) at a fixed single frequency of 2 MHz and at different temperatures (303, 313 and 323K). The temperature is maintained constant using circulating water from a thermostatically controlled (± 0.1K) water bath. The values of densities at different temperatures were measured using specific gravity bottle by standard procedure and the viscosity was measured using Ostwald’s viscometer with an accuracy of ± 0.001% standardized with double distilled water.
Computational Aspects of Physical Parameters
The various physical parameters were calculated by using the standard formulae listed below.
Adiabatic compressibility β = 1/U2 ρ (1)
The Intermolecular free length Lf = KT β1/2 (2)
Where KT is the Jacobson’s constant (KT=2.131×10⁻⁶),
Internal pressure πi = bRT [K η/u]1/2 ρ2/3/M7/6 (3)
(Where, b = cubic packing)
T- absolute temperature (K), Where Meff – the effective molecular weight of the mixture 13.
Rao’s constant Ra = (M/ ρ) (u)1/3 (4)
Absorption coefficient α/f2 = (8π2 η/3ρu2) (5)
Free Volume Vf = (Meff u/K η)3/2 (6)
Cohesive energy CE = Vf πi (7)
Relaxation time τ =4/3β η (8)
Acoustic impedance za = ρ u (9)

Where M1, M2 are the molecular weight of the solvent and solute, β and βo are the adiabatic compressibility of solution and solvent.
Results and Discussion
The values of Ultrasonic velocity, density and viscosity of aqueous non-ionic surfactants at 303, 313 and 323K are presented in tables 1, 2 and 3. The value of ultrasonic velocity increase with increase of concentration up to Critical Micelle Concentration (CMC) and then it decreases. This indicates the association in the component molecules. This suggests that there is a disruption of water structure occurred due to the addition of non-ionic surfactants. There is a strong association between solute and solvent which is confirmed by the increase of velocity with increase in concentration and temperature (Fig. 1, 4 and 7). From the study, the CMC of Sorbitan sesquioleate occurs quickly (CMC occurs at 0.8 % concentration) than other two non-ionic surfactants (CMC occurs at 1.0 % concentration). This is because of higher molecular weight of Sorbitan sesquioleate (1175.7 g/mol). The Sugandha. V.and the group stated that when the temperature increases, a lot of bonds are broken or a lot of bonds are elongated which ends in dilution of non-ionic surfactants.14 At CMC the velocity is high because the aggregation to form micelles takes place at this concentration.15
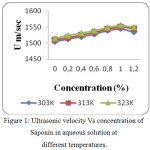 |
Figure 1: Ultrasonic velocity Vs concentration of Saponin in aqueous solution at different temperatures. |
In all the three mixtures, the density and viscosity increases with concentration and decreases with temperature (tables 1, 2 and 3). When the number of particles increases, the electrostriction and density increases. It is also observed that density for Water–Sorbitan sesquioleate is greater than that for other two systems. To understand the structure and molecular interaction occurred in the solution viscosity is one more main parameter. It is quite higher for Water – sorbitan sesquioleate system than Water – Saponin and Water–Glucopon systems due to strong interaction.
Table 1: Ultrasonic velocity and related acoustical parameters in aqueous Saponin solution at different temperatures.
|
Temp K |
Conc % |
U ms-1 |
ρ kgm-3 |
η x10-3 Nsm-2 |
β X10 -10 N-1m2 |
Lf Å |
πi X106 Pascal |
R
|
α/f2 X10-15 Np m-1s2 |
Vf X10-12 m3mol-1 |
Cohesive energy X10-6 |
τ X10-12 Sec. |
za x106 kgm-2 s2 |
Sn |
| 303 | 0 | 1505 | 998 | 0.795 | 4.423 | 0.419 | 0.816 | 0.206 | 6.144 | 0.357 | 0.291 | 0.468 | 1.501 | – |
| 0.2 | 1512 | 1053 | 0.826 | 4.154 | 0.406 | 0.084 | 1.436 | 5.966 | 7.57 | 0.637 | 0.457 | 1.592 | 7434 | |
| 0.4 | 1519 | 1061 | 0.842 | 4.084 | 0.403 | 0.049 | 2.275 | 5.953 | 15.8 | 0.781 | 0.458 | 1.611 | 9933 | |
| 0.6 | 1528 | 1073 | 0.873 | 3.991 | 0.398 | 0.038 | 2.868 | 5.996 | 24.1 | 0.922 | 0.464 | 1.639 | 12085 | |
| 0.8 | 1539 | 1086 | 0.892 | 3.887 | 0.393 | 0.032 | 3.303 | 5.924 | 31.6 | 1.028 | 0.462 | 1.671 | 13954 | |
| 1.0 | 1545 | 1098 | 0.917 | 3.815 | 0.389 | 0.029 | 3.632 | 5.954 | 38.7 | 1.137 | 0.466 | 1.696 | 14654 | |
| 1.2 | 1534 | 1109 | 0.935 | 3.831 | 0.390 | 0.027 | 3.876 | 6.140 | 44.3 | 1.213 | 0.477 | 1.701 | 13200 | |
| 313 | 0 | 1510 | 992 | 0.782 | 4.421 | 0.419 | 0.832 | 0.207 | 6.019 | 0.35 | 0.291 | 0.460 | 1.497 | – |
| 0.2 | 1517 | 1041 | 0.804 | 4.174 | 0.407 | 0.850 | 1.454 | 5.816 | 7.3 | 0.621 | 0.447 | 1.579 | 6823 | |
| 0.4 | 1525 | 1050 | 0.832 | 4.095 | 0.403 | 0.503 | 2.302 | 5.874 | 15.6 | 0.785 | 0.454 | 1.601 | 9574 | |
| 0.6 | 1533 | 1061 | 0.853 | 4.010 | 0.399 | 0.386 | 2.903 | 5.867 | 23.4 | 0.905 | 0.456 | 1.626 | 11506 | |
| 0.8 | 1544 | 1069 | 0.881 | 3.923 | 0.395 | 0.330 | 3.359 | 5.886 | 31.2 | 1.028 | 0.460 | 1.650 | 12961 | |
| 1.0 | 1551 | 1082 | 0.898 | 3.841 | 0.391 | 0.296 | 3.691 | 5.848 | 37.8 | 1.120 | 0.459 | 1.678 | 16768 | |
| 1.2 | 1545 | 1096 | 0.918 | 3.822 | 0.390 | 0.277 | 3.931 | 5.971 | 43.6 | 1.207 | 0.467 | 1.693 | 18726 | |
| 323 | 0 | 1515 | 988 | 0.687 | 4.409 | 0.419 | 0.801 | 0.208 | 5.257 | 0.29 | 0.232 | 0.403 | 1.496 | – |
| 0.2 | 1524 | 1031 | 0.716 | 4.176 | 0.407 | 0.820 | 1.470 | 5.158 | 6.18 | 0.507 | 0.398 | 1.571 | 6457 | |
| 0.4 | 1531 | 1039 | 0.748 | 4.106 | 0.404 | 0.488 | 2.330 | 5.274 | 13.4 | 0.653 | 0.409 | 1.590 | 8923 | |
| 0.6 | 1539 | 1052 | 0.774 | 4.013 | 0.399 | 0.377 | 2.932 | 5.306 | 20.4 | 0.768 | 0.414 | 1.619 | 11121 | |
| 0.8 | 1548 | 1060 | 0.807 | 3.936 | 0.395 | 0.323 | 3.391 | 5.396 | 27.4 | 0.887 | 0.423 | 1.640 | 12346 | |
| 1.0 | 1556 | 1073 | 0.835 | 3.849 | 0.391 | 0.293 | 3.726 | 5.431 | 34 | 0.997 | 0.428 | 1.669 | 16251 | |
| 1.2 | 1550 | 1085 | 0.862 | 3.836 | 0.390 | 0.274 | 3.975 | 5.609 | 39.8 | 1.094 | 0.440 | 1.681 | 17965 |
Table 2: Ultrasonic velocity and related acoustical parameters in aqueous Glucopon solution at different temperatures.
|
Temp |
Conc % |
U ms-1 |
ρ kgm-3 |
η x10-3 Nsm-2 |
β X10 -10 N-1m2 |
Lf Å |
πi X106 Pascal |
R |
α/f2 X10-15 Np m-1s2 |
Vf X10-12 m3mol-1 |
Cohesive energy X10-6 |
τ X10-12 Sec. |
za x106 kgm-2 s2 |
Sn |
| 303 | 0 | 1505 | 998 | 0.795 | 4.423 | 0.419 | 0.816 | 0.206 | 6.144 | 0.357 | 0.291 | 0.468 | 1.501 | – |
| 0.2 | 1514 | 1036 | 0.812 | 4.211 | 0.409 | 0.100 | 1.236 | 5.938 | 5.76 | 0.577 | 0.455 | 1.568 | 4958 | |
| 0.4 | 1521 | 1049 | 0.835 | 4.120 | 0.405 | 0.066 | 1.762 | 5.947 | 10.50 | 0.698 | 0.458 | 1.595 | 6797 | |
| 0.6 | 1526 | 1053 | 0.859 | 4.078 | 0.402 | 0.055 | 2.090 | 6.035 | 14.20 | 0.787 | 0.466 | 1.606 | 6914 | |
| 0.8 | 1531 | 1061 | 0.872 | 4.021 | 0.400 | 0.049 | 2.301 | 6.021 | 17.00 | 0.846 | 0.467 | 1.624 | 7143 | |
| 1.0 | 1537 | 1073 | 0.894 | 3.945 | 0.396 | 0.046 | 2.438 | 6.033 | 19.70 | 0.921 | 0.470 | 1.649 | 7576 | |
| 1.2 | 1534 | 1086 | 0.917 | 3.913 | 0.394 | 0.045 | 2.528 | 6.150 | 21.97 | 0.991 | 0.478 | 1.665 | 7272 | |
| 313 | 0 | 1510 | 992 | 0.782 | 4.421 | 0.419 | 0.832 | 0.207 | 6.019 | 0.35 | 0.291 | 0.460 | 1.497 | – |
| 0.2 | 1519 | 1028 | 0.801 | 4.215 | 0.409 | 0.102 | 1.247 | 5.845 | 5.67 | 0.579 | 0.450 | 1.561 | 4799 | |
| 0.4 | 1527 | 1039 | 0.827 | 4.127 | 0.405 | 0.068 | 1.782 | 5.877 | 10.40 | 0.706 | 0.455 | 1.586 | 6597 | |
| 0.6 | 1533 | 1047 | 0.845 | 4.064 | 0.402 | 0.056 | 2.105 | 5.889 | 14.00 | 0.787 | 0.457 | 1.605 | 7158 | |
| 0.8 | 1538 | 1055 | 0.862 | 4.007 | 0.399 | 0.050 | 2.317 | 5.904 | 16.90 | 0.855 | 0.460 | 1.622 | 7357 | |
| 1.0 | 1544 | 1064 | 0.886 | 3.942 | 0.396 | 0.047 | 2.463 | 5.948 | 19.60 | 0.933 | 0.465 | 1.642 | 9107 | |
| 1.2 | 1539 | 1071 | 0.904 | 3.942 | 0.396 | 0.045 | 2.566 | 6.088 | 21.60 | 0.988 | 0.475 | 1.648 | 9566 | |
| 323 | 0 | 1515 | 988 | 0.687 | 4.409 | 0.419 | 0.801 | 0.208 | 5.257 | 0.29 | 0.232 | 0.403 | 1.496 | – |
| 0.2 | 1526 | 1021 | 0.724 | 4.205 | 0.409 | 0.099 | 1.257 | 5.246 | 4.90 | 0.488 | 0.405 | 1.558 | 4764 | |
| 0.4 | 1534 | 1032 | 0.743 | 4.117 | 0.404 | 0.066 | 1.797 | 5.243 | 8.89 | 0.588 | 0.407 | 1.583 | 6566 | |
| 0.6 | 1540 | 1040 | 0.762 | 4.054 | 0.401 | 0.054 | 2.123 | 5.274 | 12.00 | 0.661 | 0.411 | 1.601 | 7132 | |
| 0.8 | 1546 | 1049 | 0.789 | 3.988 | 0.398 | 0.049 | 2.335 | 5.351 | 14.90 | 0.740 | 0.419 | 1.621 | 7496 | |
| 1.0 | 1551 | 1055 | 0.807 | 3.940 | 0.396 | 0.046 | 2.488 | 5.390 | 17.10 | 0.798 | 0.423 | 1.636 | 8944 | |
| 1.2 | 1546 | 1064 | 0.825 | 3.932 | 0.395 | 0.044 | 2.587 | 5.517 | 18.965 | 0.896 | 0.432 | 1.644 | 9550 |
Table 3: Ultrasonic velocity and related acoustical parameters in aqueous Sorbitan sesquioleate solution at different temperatures.
|
Temp |
Conc % |
U ms-1 |
ρ kgm-3 |
η x10-3 Nsm-2 |
β X10 -10 N-1m2 |
Lf Å |
πi X106 Pascal |
R |
α/f2 X10-15 Np m-1s2 |
Vf X10-12 m3mol-1 |
Cohesive energy X10-6 |
τ X10-12 Sec. |
za x106 kgm-2 s2 |
Sn |
| 303 | 0 | 1505 | 998 | 0.795 | 4.423 | 0.419 | 0.816 | 0.206 | 6.144 | 0.357 | 0.291 | 0.468 | 1.501 | – |
| 0.2 | 1515 | 1060 | 0.834 | 4.110 | 0.404 | 0.076 | 1.560 | 5.949 | 8.800 | 0.673 | 0.456 | 1.605 | 9447 | |
| 0.4 | 1524 | 1076 | 0.856 | 4.001 | 0.399 | 0.041 | 2.623 | 5.909 | 20.519 | 0.861 | 0.456 | 1.639 | 14457 | |
| 0.6 | 1532 | 1084 | 0.879 | 3.930 | 0.395 | 0.030 | 3.492 | 5.929 | 33.337 | 1.010 | 0.460 | 1.660 | 16958 | |
| 0.8 | 1544 | 1095 | 0.891 | 3.830 | 0.390 | 0.024 | 4.199 | 5.812 | 45.899 | 1.123 | 0.454 | 1.690 | 19763 | |
| 1.0 | 1540 | 1107 | 0.923 | 3.809 | 0.389 | 0.021 | 4.764 | 6.002 | 59.295 | 1.268 | 0.468 | 1.704 | 19602 | |
| 1.2 | 1537 | 1118 | 0.948 | 3.786 | 0.388 | 0.019 | 5.236 | 6.140 | 72.038 | 1.392 | 0.478 | 1.718 | 19353 | |
| 313 | 0 | 1510 | 992 | 0.782 | 4.421 | 0.419 | 0.832 | 0.207 | 6.019 | 0.350 | 0.291 | 0.460 | 1.497 | – |
| 0.2 | 1521 | 1049 | 0.814 | 4.120 | 0.405 | 0.077 | 1.579 | 5.798 | 8.536 | 0.660 | 0.447 | 1.595 | 9077 | |
| 0.4 | 1534 | 1063 | 0.836 | 3.997 | 0.398 | 0.042 | 2.661 | 5.728 | 20.000 | 0.847 | 0.445 | 1.630 | 14522 | |
| 0.6 | 1545 | 1075 | 0.858 | 3.897 | 0.393 | 0.030 | 3.531 | 5.690 | 32.56 | 0.997 | 0.445 | 1.660 | 18051 | |
| 0.8 | 1559 | 1086 | 0.870 | 3.788 | 0.388 | 0.024 | 4.247 | 5.558 | 44.932 | 1.111 | 0.439 | 1.693 | 21115 | |
| 1.0 | 1555 | 1097 | 0.893 | 3.769 | 0.387 | 0.021 | 4.823 | 5.692 | 57.254 | 1.230 | 0.448 | 1.705 | 24955 | |
| 1.2 | 1549 | 1108 | 0.924 | 3.761 | 0.386 | 0.019 | 5.297 | 5.899 | 70.134 | 1.368 | 0.463 | 1.716 | 28079 | |
| 323 | 0 | 1515 | 988 | 0.687 | 4.409 | 0.419 | 0.801 | 0.208 | 5.257 | 0.289 | 0.232 | 0.403 | 1.496 | – |
| 0.2 | 1526 | 1040 | 0.724 | 4.129 | 0.405 | 0.074 | 1.594 | 5.150 | 7.196 | 0.538 | 0.398 | 1.587 | 8481 | |
| 0.4 | 1538 | 1052 | 0.756 | 4.018 | 0.399 | 0.041 | 2.691 | 5.193 | 17.266 | 0.711 | 0.404 | 1.617 | 13432 | |
| 0.6 | 1557 | 1065 | 0.789 | 3.873 | 0.392 | 0.030 | 3.574 | 5.160 | 29.047 | 0.872 | 0.407 | 1.658 | 18508 | |
| 0.8 | 1564 | 1074 | 0.816 | 3.806 | 0.389 | 0.024 | 4.299 | 5.221 | 41.011 | 1.004 | 0.414 | 1.679 | 20172 | |
| 1.0 | 1560 | 1086 | 0.848 | 3.783 | 0.388 | 0.021 | 4.877 | 5.407 | 53.237 | 1.141 | 0.427 | 1.694 | 24031 | |
| 1.2 | 1555 | 1098 | 0.874 | 3.766 | 0.387 | 0.019 | 5.352 | 5.566 | 64.894 | 1.260 | 0.438 | 1.707 | 27428 |
The increase in speed and reduction in compressibility were attributed to formation of chemical element bonds between matter and solvent molecules. The compressibility seems to be decreasing with increasing bond strength shaped by matter and solvent molecules. The increase in ultrasonic velocity (U) and corresponding decrease in adiabatic compressibility (β) with concentration indicate that the molecules are forming a more tightly bound system.16 Fig. 2, 5 and 8 shows the variations of adiabatic compressibility with concentration at various temperatures. The adiabatic compressibility is found to decrease with increase in the concentration of Sorbitan sesquioleate upto 0.8%, Saponin and Glucopon upto 1.0%. Beyond this concentration, when the Sorbitan sesquioleate, Saponin and Glucopon concentration is increased the velocity tends to decrease and adiabatic compressibility is found to increase. This indicate the breaking of water-surfactants beyond the saturation point of 0.8% (Sorbitan sesquioleate), 1.0% (Saponin and Glucopon) and cause the intermolecular free length (Lf) to increase beyond this concentration. The ultrasonic velocity increases, the intermolecular free length decreases with increase in concentration. This leads to decrease the gap between two molecules which is mentioned by intermolecular free length. This indicates the important interaction between the solute and solvent molecules. When the temperature is increased, there is an increase in free length.17 It shows that there is an increase of dipole induced dipole attraction occuring in the solution.18 The nature and strength of forces existing between the molecules the internal pressure decreases with increase of concentration.19 The non-linear variation of Rao’s constant and the gradual increases of acoustic impedance in all the three systems clearly indicate the solute solvent interaction exist in the system but it is dominant in water – Sorbitan sesquioleate system than other two systems. The absorption Coefficient (α/f2) of all the three aqueous non-ionic surfactant values are non – linear variations with increase in concentration as shown in Fig. 3,6 and 9. As the temperature increases the absorption coefficient decreases. This indicates the week interaction between solute and solvent.
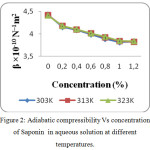 |
Figure 2: Adiabatic compressibility Vs concentration of Saponin in aqueous solution at different temperatures. |
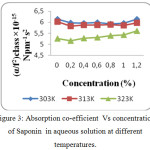 |
Figure 3: Absorption co-efficient Vs concentration of Saponin in aqueous solution at different temperatures. |
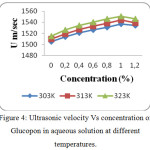 |
Figure 4: Ultrasonic velocity Vs concentration of Glucopon in aqueous solution at different temperatures. |
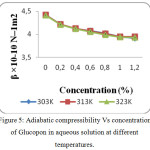 |
Figure 5: Adiabatic compressibility Vs concentration of Glucopon in aqueous solution at different temperatures. |
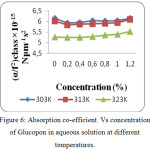 |
Figure 6: Absorption co-efficient Vs concentration of Glucopon in aqueous solution at different temperatures. |
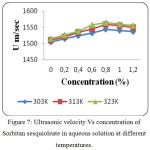 |
Figure 7: Ultrasonic velocity Vs concentration of Sorbitan sesquioleate in aqueous solution at different temperatures. |
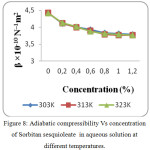 |
Figure 8: Adiabatic compressibility Vs concentration of Sorbitan sesquioleate in aqueous solution at different temperatures. |
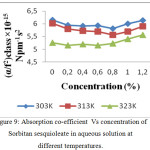 |
Figure 9: Absorption co-efficient Vs concentration of Sorbitan sesquioleate in aqueous solution at different temperatures. |
Free volume is the average volume in which the centre of molecule can move due to the repulsion of the surrounding molecules. The free volume increases with increases in concentration. The decrease in molecular association causes a rise in free volume. Thus free volume is an inverse function of internal pressure.20 However, with the increase of non-ionic surfactant content in water- non-ionic surfactant mixtures, free volume increases. The increase in the concentration of water-non-ionic surfactant mixture, increase of cohesive energy values are attained and shows that solute-solvent bonding is very strong. The relaxation time, which is in the order of 10-12 sec, is due to structural relaxation process21 and in such situation it is suggested that the molecules gets rearranged due to co-operative process.22 Further relaxation time decreases with increase in temperature (tables 1, 2 and 3). With rise in temperature, thermal energy of the system increases causing an increase in excitation energy and hence, falls in values of relaxation time at higher temperature.
There is a variation of pressure from particle to particle occurs, when an acoustic wave travels in a medium. To examine specific acoustic impedance in relation to concentration and temperature is very important. In this present studies, the acoustic impedance value is increased with increasing concentration of non-ionic surfactant in these solutions. It further supports the possibility of molecular interactions between the water and non-ionic surfactant molecules.23 The structure forming tendency of the non-ionic surfactants are indicated by the positive values of solvation number.24 A change in post micellization area exhibited by the values of solvation number, which may be credited to greater consumption of solvent molecules. This reduces the repulsive forces acting between polar heads of ionic micelles.25
UV Analysis
UV-Visible spectrum of the aqueous solution of non-ionic surfactants are shown in figures 10 to 12. The spectrum shows a peak with absorbance value increasing with increase in concentration of non-ionic surfactants. A typical Lambert – Beer behaviour has been followed. In all the cases, polarization increases with increase in absorption as shown in table 4. The plot concentration versus absorbance is drawn and linear regression analysis has also been carried out as shown in figures 10 to 12. From the absorption study, the mixture of water – Sorbitan sesquioleate has extremely good correlation of absorbance with concentration, R2 = 0.9848 (Fig. 12), but poorer correlation in the mixture of water – Glucopon, R2 = 0.9377 (Fig. 11) and the mixture of water – Saponin, R2 = 0.9483 (Fig. 10). Aqueous mixture of sorbitan sesquioleate has higher polarization power than the other two systems. In all the cases, polarization increases with increase in absorption as shown in table 4.
Table 4: UV –Vis absorbance values of Saponin, Glucopone and Sorbitan Sesquioleate.
|
Compounds Name |
Concentration (×10-3 ) mol dm-3 |
Absorbance nm |
|
Saponin |
0.05 |
2.45 |
|
0.10 |
2.51 |
|
|
0.15 |
2.81 |
|
|
0.20 |
3.01 |
|
|
Glucopon |
0.05 |
2.17 |
|
0.10 |
2.21 |
|
|
0.15 |
2.41 |
|
|
0.20 |
2.61 |
|
|
Sorbitan Sesquioleate |
0.05 |
3.6 |
|
0.10 |
4.04 |
|
|
0.15 |
4.42 |
|
|
0.20 |
5.08 |
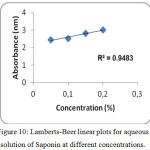 |
Figure 10: Lamberts-Beer linear plots for aqueous solution of Saponin at different concentrations. |
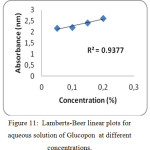 |
Figure 11: Lamberts-Beer linear plots for aqueous solution of Glucopon at different concentrations. |
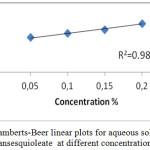 |
Figure 12: Lamberts-Beer linear plots for aqueous solution of Sorbitansesquioleate at different concentrations. |
Conclusion
The linear variation in ultrasonic velocity with increasing concentration suggests the miscibility of non-ionic surfactant with water. Ultrasonic velocity measurement have been extensively applied for assessing the molecular interactions in pure binary liquid mixture. It also determines the elasticity of the medium. Thermo-acoustic parameters can be used to analyze a broad range of molecular processes. Ultrasonic study of non-ionic surfactant is used to determine the intermolecular interactions and different types of forces exist in the medium. This result was confirmed by the UV studies. From the UV results water–sorbitan sesquioleate mixture has high regression value compared to other two mixtures.
Conflict of Interest
The authors declare that there is no conflict of interests regarding the publication of this article.
References
- Yadava. S.S.; Aniruddh Yadav, Ultrasonics, 2005, 43(9), 732.
- Jean-Louis Salager. VersiónII, Mérida-Venezuela, 2002, E300-A.
- Rajathi. K.; Askar Ali. S.J.;.Rajendran. A, J. Chem. Pharm. Res., 2011, 3, 348.
- Palaniappan. L.; Asian Journal of Material Science., 2012, 4, 21.
- Bhandakkar V D; Ind. J. Pure & Appl. Phy. 2011 49, 250.
- Ishwara Bha. J; Shivakumar. H.R; Indian J. Chem A., 1998 37, 252.
- Ishwara Bhat. J; .Shivakumar. H.R; Indian J. Pure and Applied Physics, 2000 38, 306.
- Holmberg. K; Jonsson. B.; Kornberg. B.; Lindman. B. 2nd edition.John Wiley & Sons, Inc., New York, 2003 121-124.
- Jitendra. M.; Dharmesh. V.; Prashant. B., Journal of Thermochimica Acta, 2005, 147-155.
- Hailu Demissie; Ramesh Duraisamy. Journal of Scientific and Innovative Research, 2016, 5(6), 208-214.
- Sh Im; Yh Jeong. Anal.Chim.Acta, 2008 619, 129-136.
- Bahramian. A.; Golafshan. S.; Sohrabi.; Rashidi. M.; Extraction of Nonionic Natural Surfactants (Saponin) From Ginseng Medical Plant.
- Palani. R.; Srinivasan. G.; Geeta Lakshmi. B.; International Journal of Chem Tech Research, 2011, 3 (1) 284-289.
- Sugandha. V.; Omprakash P. Chimankar; Bhandakkar. V.D. Global Journal for Research Analysis, 2014, 3(6), 73-76.
- Patil. A.A. Journal of Chemical and Pharmaceutical Research, 2013, 5 (3), 19.
- R. Spickler, F. Ibrahim, S. Yun and F.B. Stumpf. J.Acoust. Soc Am., 83, 1388, (1998).
- Punitha. S.; Uvarani. R.; Panneerselvam. A.; Nithiyanantham. S. Journal of Saudi Chemical Society, 2014, 18, 657-665.
- Karikalan.V.; Panneerselvam. A.; Vallalperuman. K. Digest Journal of Nanomaterials and Biostructures, 2018, 13(1),115-128.
- Bhandakkar. V. D. IOSR Journal of Applied Physics, 2012, 1(5) 38-43.
- Punitha. S.; Uvarani. R.;.Panneerselvam. A. International Journal of Chem Tech Research, 2014-2015, 7(2), 629-638.
- Kinser L.E. and Fray A.R. 1989. Fundamentals of acoustics. New Delhi Wiley Eastern.
- Ali Hyder. S.; Nain. A.K. J. Phys. 2000, 74B1, 63-67.
- Thirumaran.S.; Jayalakshmi.K.; Job Sabu K. Rasayan journal of chemistry, 2009, 2(2), 424-435.
- Kagathara. V.M.; Sanariya. M.R.; Parsania. P.H. Eur. Poly. J. 2000, 36(11), 2371-2374.
- Rodric. D.; Upadhyaya. S. K. World Journal of Pharmacy and Pharmaceutical Sciences, 2015, 4 (11), 1656-1663.

This work is licensed under a Creative Commons Attribution 4.0 International License.
![]()
A New Edition of Web of Science
Journal Impact Factor
2022: 0.5
Five Year: 0.8
Journal is Indexed in

Cabells Whitelist
![]()


