Synchrotron X-Ray Absorption Spectra of Iron Oxides Synthesized by Co-precipitation at Varying Temperatures

1Faculty of Science and Technology, Nakhon Si Thammarat Rajabhat University, Nakhon Si Thammarat, Thailand.
2Academy for the Study of Science, Technology and Language Learning, Suranaree University of Technology, Nakhon Ratchasima, Thailand.
3Functional Materials and Nanotechnology Center of Excellence, Walailak University, Nakhon Si Thammarat, Thailand.
4Division of Physics, School of Science, Walailak University, Nakhon Si Thammarat, Thailand.
Corresponding Author E-mail: chitnarong.siri@gmail.com
DOI : http://dx.doi.org/10.13005/ojc/35Specialissue105
Download this article as:
![]()
Synchrotron X-ray absorption near edge spectroscopy (XANES) and extended X-ray fine structure (EXAFS) are used to study the effect of temperature in the co-precipitation synthesis of iron oxides. Nanoparticles are rod-like and agglomerate into microscale aggregates. XANES spectra complement X-ray diffractometry in the phase identification of inverse spinel structured maghemite (γ-Fe2O3). In addition to the smallest crystallite size, EXAFS analysis revealed the highly distorted structure in the sample synthesized at 90°C. The samples synthesized at lower temperatures (25°C, 60°C) are ferrimagnetic with much larger magnetizations. The variation in magnetic properties with the synthetic temperature is related to the differences in crystallite size and distortion in the structure of γ-Fe2O3 nanoparticles.
KEYWORDS:Co-Precipitation; EXAFS Spectroscopy; Maghemite; Synchrotron X-Ray Absorption; XANES Spectroscopy
Introduction
X-ray absorption spectroscopy (XAS) has successfully been used to analyze a variety of nanostructured materials including iron oxides. Iron oxides have extensive applications based on their polymorphic forms. Amorphous Fe2O3 and hematite (a-Fe2O3) are employed as catalysis and pigments whereas magnetite (Fe3O4) and maghemite (γ-Fe2O3) nanoparticles have been implemented in ferrofluids, recording and biomedical applications.1–4 Conventional phase identification by X-ray diffraction (XRD) cannot distinguish between Fe3O4 and γ-Fe2O3 nanoparticles since XRD peaks of these two phases are close together and often overlap due to the peak broadening.
Spectroscopic XAS is divided into two energy regimes, namely X-ray absorption near-edge structure (XANES) and extended X-ray absorption fine structure (EXAFS). XANES spectra provide information on the oxidation state of the absorbing atoms and the electronic environment. Corresponding to a higher energy, EXAFS data indicate the type, the number and the distance to the nearest neighbor shells.5 Several reports confirmed the difference between Fe3O4 and γ-Fe2O3 by the finger print approach using XANES and EXAFS spectra.6-13 Other researchers also employed XAS to studies α-Fe2O3 nanoparticles.14-16
In the presence research, iron oxides synthesized using different temperatures in the co-precipitation were characterized by synchrotron XANES and EXAFS. Previous reports already suggested that the additions of pressure and sonication in the co-precipitation synthesis influenced structures of iron oxides linking to their magnetic properties.17,18
Materials and Methods
Nanoparticles were synthesized by the co-precipitation at three different temperatures, i.e. 25°C, 60°C, 90°C and respectively referred to as samples A25, A60 and A90 as listed in Table 1. All chemical reagents are analytical grade and purchased from Sigma-Aldrich and used without further purification. Ten ml of 1.0 M NaOH solution was dropwise added into the mixture of the iron salts aqueous solutions in the stoichiometric ratio of 1:2 of FeSO4×7H2O (0.125 mmol) and Fe(NO3)3·9H2O (0.250 mmol). After the reaction was completed, ethanol was added to the suspension and then the dark brown product was precipitated by the centrifugation. The supernatant was discarded. The precipitates were washed by deionized water and centrifuged again to precipitate the particles. To obtain the samples in a powder form, samples were dried at 120°C for 2 h.
<p”>The morphology of the samples was investigated using SEM model Zeiss MERLIN compact. Vibrating sample magnetometry (VSM) was used to measure the magnetic properties the nanoparticles. The samples in a powder form were covered by sticky tape and then attached to the sample holder. The magnetization of the nanoparticles was measured by the lock-in amplifier as a function of varying magnetic field from 0 to 5 kOe produced by an electromagnet in opposite directions to complete M-H curves. From these M-H curves, the coercivity (Hc) is obtained from the x-intercept and the remanent magnetization (Mr) is obtained from the y-intercept. To examine the phase of iron oxide nanoparticles, XRD was carried out from 2q =10°C to 80°C using a Bruker D2 PHASER desktop diffractometer with CuKα radiation (l=1.54 Å). The X-ray generator was operated at 30 kV and 10 mA with step time 0.5 sec/step. The average crystallite sizes of the particles are calculated by using Debye-Scherrer equation:
where D is the crystallite size of the particles and λ is the X-ray wavelength (1.54 Å). θ is the diffraction angle and β is the full width at half maximum.
To verify the phase of iron oxide and investigate the local structure around Fe atoms, the XAS experiment was carried out at BL8, Synchrotron Light Research Institute (SLRI), Nakhon Ratchasima, Thailand with electron energy of 1.2 GeV and a maximum electron current of 150 mA. Samples were prepared by grinding dried powder in a mortar to reduce the particle size and then thinly casted on the frame and covered by polyimide tape. The edge-jump was firstly measured to ensure that the uniform optical thickness was obtained. All spectra were collected at room temperature in the transmission mode with the ion chamber detectors. In the XANES measurement, the photon energy was scanned from -100 eV below the edge to 100 eV above the edge. The XANES spectra and the extracted EXAFS signals were respectively analyzed using Athena program and Artemis program.19 The spectrum data processing included a pre-edge, post-edge background subtraction and normalization.
Table 1: Crystallite size (D), magnetization in 5 kOe field (M5kOe), remanent magnetization (Mr) and coercivity (Hc) of iron oxides synthesized at varying temperatures.
| Sample | Synthetic temperature (°C) | D (nm) | M5kOe (emu/g) | Mr (emu/g) | Hc (Oe) |
| A25 | 25 | 8.1 | 25.8 | 0.37 | 5.6 |
| A60 | 60 | 7.9 | 20.8 | 0.32 | 8.2 |
| A90 | 90 | 1.9 | 0.2 | 0.01 | 0 |
Results and Discussion
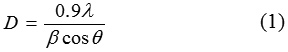
Magnetic properties of three samples are compared by M-H curves in Figure 1 and magnetic parameters in Table 1. Samples A 25 and A 60 exhibit very narrow hysteresis loops with magnetization approaching the saturation in 5 kOe field referred to as M5kOe in Table 1. The inset magnifying Figure 1 at low magnetic field confirms that the samples are not hysteresis-free super paramagnetic, but soft ferrimagnetic. As listed in Table 1, samples A60 has the highest coercivity where as samples A 25 synthesized at the lowest temperature has the highest magnetization. On the other hand, sample A90 synthesized at the highest temperature has paramagnetic properties with minimal magnetization. The result suggests that the magnetic properties is decreased with increasing temperature in the co-precipitation.
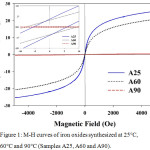 |
Figure 1: M-H curves of iron oxides synthesized at 25°C, 60°C and 90°C (Samples A25, A60 and A90). |
The inset shows their magnification in the low magnetic field regime.
The SEM micrograph of sample A60 is exemplified in Figure 2. The micro-sized aggregates are composed of nanoparticles with rod-like morphology. The lengths range between 200 and 300 nm and the diameters are around 20 – 50 nm. The agglomeration of these nanoparticles is due to their ferrimagnetic behaviors without surface modification.20
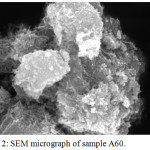 |
Figure 2: SEM micrograph of sample A60. |
According to XRD patterns in Figure 3, the diffraction peaks of all samples can be indexed to crystalline planes of iron oxides with the inverse spinel structure. The phase is either γ-Fe2O3 (PDF card no. 39-1346) or Fe3O4 (PDF card no. 75-0449). Because of their similar structure and peak broadening, Fe3O4 and γ-Fe2O3 nanoparticles cannot be distinguished from XRD patterns but can further be identified by XAS. The synthetic temperature affects the crystallite size shown in Table 1. Whereas samples A25 and A60 have comparable crystallite size between 7.9 and 8.1 nm, sample A90 has a much smaller size only around 1.9 nm indicating the lack of long-range periodicity in this sample. This is attributed to the high energy from the high temperature process (90°C in this case) disrupting the crystal growth in Lamer mechanism. This smallest crystallite size can be used to explain the minimal magnetization previously obtained in sample A90.
 |
Figure 3: XRD patterns of iron oxides synthesized at 25°C, 60°C and 90°C (Samples A25, A60 and A90). |
The phase of iron oxides can be identified by using fingerprinting XANES in Figure 4. Each iron oxide phase has a unique spectrum whose absorption edge is shifted to a higher energy due to an increase in oxidation state of Fe. Normally, the energy of the absorption edge is increased by ~ 3 eV when the oxidation state increases from +2 to +3.21 In the inverse spinel structure, Fe3O4 has with Fe2+ and Fe3+ ions distributing in octahedral sites with residual Fe3+ occupying tetrahedral sites. The Fe3+ ions in the tetrahedral and octahedral sites have opposite spin directions. With the same spinel structure, γ-Fe2O3 contains only Fe3+ in both tetrahedral and octahedral sites. The γ-Fe2O3 having oxidation of +3.0 and the Fe3O4 with +2.67 average oxidation state and are therefore distinguishable. The normalized Fe K-edge XANES spectra for samples synthesized at three different temperatures with Fe, FeO, Fe3O4, γ-Fe2O3 as references are shown in Figure 4(a). By comparing with these standard references, the XANES characteristic features for all three samples resemble that of γ-Fe2O3. This is confirmed by the first derivative plot as shown in Figure 4(b).
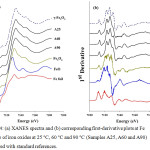 |
Figure 4: (a) XANES spectra and (b) corresponding first–derivative plots at Fe K– edge of iron oxides at 25°C, 60°C and 90°C (Samples A25, A60 and A90) compared with standard references. |
To characterize the local structure of iron oxides, the spectra were fitted to the EXAFS equation:
where Nj is the coordination number of backscattering atoms in neighbor shell j at a distance Rj from the absorbing atom and | fj (k) | is the absolute value of the backscattering amplitude of the atom in shell j. S02 is the amplitude reduction factor and φ (k) is the phase-shift function. σj2 is the Debye-Waller factor and λj (k) is the electron mean free path. The quality of the fit can be judged by the R-factor defined as normalized sum of residuals.
For the theoretical model of Fe K-edge EXAFS of Fe3O4 nanoparticles, the absorber atoms are Fe in the octahedral site and the first neighboring shell consists of 6 oxygen atoms at 2.06 Å. The second shell and the third shell consist of 6 Fe atoms at 2.97 Å and 3.48 Å respectively. However, γ-Fe2O3 nanoparticles have a vacancy in their structure and the coordination numbers should then be lower than the value predicted by the Fe3O4 structural model. Normally in nanoparticles, a reduction of coordination numbers of outer shells and an increase in Debye-Waller factor are expected due to the large fraction of atoms near the surface and the higher disorder of the surface sites. Therefore, both coordination numbers and Debye-Waller factor terms were freely varied. The amplitudes of the EXAFS function χ(k) and the Fourier transform of the χ(k) weighting with k3 and the fit results for samples are shown in Figure 5. The transformation is limited in the k range from 3.0 to 10 Å-1 due to a low signal to noise ratio in the high k region. To obtain the radial distance (Rj) of Fe neighboring atoms, Fourier transform-EXAFS spectra of the first and second peaks were fitted to the EXAFS equation with the R range from 1 to 3.5 Å. Only the single scattering was used because the multiple scattering can be neglected when the study was limited to the first two peaks of the spectrum.22 The structural information can be extracted from the EXAFS data are summarized in Table 2. Moreover, R-factors values are lower than 0.02 indicating a very good quality of the fits.
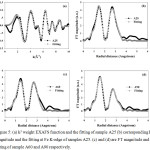 |
Figure 5: (a) k3 weight EXAFS function and the fitting of sample A25 (b) corresponding FT magnitude and the fitting at Fe K–edge of samples A25. (c) and (d) are FT magnitude and the fitting of sample A60 and A90 respectively. |
As commonly observed, the first FT peak around 1 – 2 Å in all samples corresponds to the single Fe-O shell whereas the second peak in 2 – 3.5 Å range is the contribution of two Fe-Fe shells at different radial distances. While the intensities in all first peaks are comparable, the second peaks intensity tends to reduce in samples synthesized at high temperature (A90). This peak reduction is related to an increase in Debye-Waller factor and the reduction of coordination number. A higher Debye-Waller factor indicates disorder in the structure and samples A60 and A90 therefore has a distortion inside their structure. From Table 2, the structural parameters extracted from EXAFS fitting of the samples are closely resembles that of γ-Fe2O3 standard which agree well with XRD and XANES results. By varying the synthesis temperature, the radial distances of the Fe-O and Fe-Fe bonding are increased with increasing temperatures signifying the higher distortion inside the structure. The sample A90 has the highest distortion but the lowest crystallite size and magnetization. This result indicates that magnetic properties of these γ-Fe2O3 nanoparticles are influenced by both crystallite size and structural distortion.
Table 2: Structural parameters obtained from the best fitting of Fe K–edge EXAFS spectra of iron oxides.
| Sample | Shell | Rj (Å) | Nj | σ2(Å2) | ΔE0 |
| γ-Fe2O3 | Fe-O | 1.947 ± 0.014 | 4.9 | 0.014 ± 0.003 | 0.000 |
| standard | Fe-Fe | 2.990 ± 0.013 | 3.9 | 0.013 ± 0.003 | |
| Fe-Fe | 3.454 ± 0.008 | 3.8 | 0.008 ± 0.003 | ||
| A25 | Fe-O | 1.951 ± 0.018 | 4.2 | 0.012 ± 0.002 | -4.338 |
| Fe-Fe | 2.979 ± 0.020 | 2.9 | 0.012 ± 0.004 | ||
| Fe-Fe | 3.443 ± 0.020 | 3 | 0.009 ± 0.005 | ||
| A60 | Fe-O | 1.956 ± 0.024 | 4.5 | 0.005 ± 0.004 | -3.209 |
| Fe-Fe | 3.027 ± 0.024 | 8.4 | 0.018 ± 0.013 | ||
| Fe-Fe | 3.421 ± 0.024 | 5.2 | 0.018 ± 0.013 | ||
| A90 | Fe-O | 1.963 ± 0.010 | 4.3 | 0.012 ± 0.004 | -3.775 |
| Fe-Fe | 3.028 ± 0.015 | 7.3 | 0.025 ± 0.006 | ||
| Fe-Fe | 3.421 ± 0.015 | 2.2 | 0.013 ± 0.007 |
Conclusion
Iron oxides were synthesized by using the co-precipitation at 25°C, 60°C and 90°C. XRD and XANES analysis indicated the inverse spinel structure of γ-Fe2O3 nanoparticles. EXAFS revealed that the increase of distortion inside the structure with increasing synthetic temperature from 25°C to 90°C. The structural distortion and crystallite size from these combined characterizations were linked to magnetic properties of γ-Fe2O3 nanoparticles useful in biomedical applications. For such applications, nanoparticles are further surface-modified in order to functionalize with appropriate stability and attachments.
Conflict of Interest
The authors declare no conflicts of interest. The authors alone are responsible for the content of this manuscript.
Acknowledgements
This work was supported by Nakhon Si Thammarat Rajabhat University grant no. 61/2557 and Synchrotron Light Research Institute (Public Organization), Thailand. The authors would like to acknowledge Asst. Prof. Dr. Phimpaka Harding, Dr. Upsorn Boonyang, Asst. Prof. Dr. Pongsakorn Jantaratana for their facility supports as well as Kornkanok Phansri and Thitikan Raksaphon for their contributions in synthesis.
References
- Wu, W.; Wu, Z.; Yu, T.; Jiang, C.; Kim, W. S. Sci. Technol. Adv. Mater. 2015, 16, 023501.
- Yadollahpour, A.; Rashidi, S. Orient. J. Chem. 2015, 31, 25.
- Aparecida Campos, E.; Stockler Pinto, D. V. B.; Sampaio de Oliveira, J. I.; da Costa Mattos, E.; Lazzarini Dutra, R. C. J. Aerosp. Technol. Manag. 2015, 7, 267.
- Chingsungnoen, A.; Chaiyachate, P.; Dasri, T. Orient. J. Chem. 2017, 33, 1642.
- Yano, J.; Yanchandra, V. K. Photosynth. Res. 2009, 102, 241.
- Moscoso-Londono, O.; Carriao, M. S.; Cosio-Castaneda, C.; Bilovol, V.; Martinez-Sanchez, R.; Lede, E. J.; Socolovsky, L. M.; Martinez-Garcia, R. Mater. Res. Bull. 2013, 48, 3474.
- Corrias, A.; Ennas, G.; Mountjoy, G.; Paschina, G. Phys. Chem. Chem. Phys. 2000, 2,1045.
- Gilbert, B.; Katz, J. E.; Denlinger, J. D.; Yin, Y.; Falcone, R.; Waychunas, G. A. J. Phys. Chem. C 2010, 114, 21994.
- Chen, L. X.; Liu, T.; Thurnauer, M. C.; Csencsits, R.; Rajh, T. J. Phys. Chem. B 2002, 106, 8539.
- Signorini, L.; Pasquini, L.; Savini, L.; Carboni, R.; Boscherini, F.; Bonetti, E.; Giglia, A.; Pedio, M.; Mahne, N.; Nannarone, S. Phys. Rev. B 2003, 68,195423.
- Espinosa, A.; Serrano, A.; Llavona, A.; Jimenez de la Morena, J.; Abuin, M.; Figuerola, A.; Pellegrino, T.; Fernández, J. F.; Garcia-Hernandez, M.; Castro, G. R.; Garcia, M. A. Meas. Sci. Technol. 2012, 23, 015602.
- Okudera, H.; Yoshiasa, A.; Murai, K.; Okube, M.; Takeda, T.; Kikkawa, S. J. Miner. Petrol. Sci. 2012, 107,127.
- Schimanke, G.; Martin, M. Solid State Ionics 2000, 136-137, 1235.
- Jiao, F.; Harrison, A.; Jumas, J. C.; Chadwick, A. V.; Kockelmann, W.; Bruce, P. G. J. Am. Chem. Soc. 2006, 128, 5468.
- Hidaka, M.; Horiuchi, H.; Ohashi, K.; Wijesunder, R. P.; Kumara, L. S. R.; Sung, N. E. Cerâmica 2009, 55, 223.
- Sánchez-Marcos, J.; Laguna-Marco, M. A.; Martinez-Morillas, R.; Cespedes, E.; Jimenez-Villacorta, F.; Menendez, N.; Prieto, C. J. Phys.: Condens. Matter. 2011, 23, 476003.
- Yazdani, F.; Edrissi, M. Mater. Sci. Eng. B 2010, 171, 86.
- Tangwatanakul, W.; Sirisathitkul, C.; Limphirat, W.; Yimnirun, R. Chin. J. Phys. 2017, 55, 845.
- Ravel, B.; Newville, M. J. Synchrotron Rad. 2005, 12, 537.
- Gimenes, R.; Baldissera, M. R.; da Silva, M. R. A.; da Silveira, C. A.; Soares, D. A. W.; Perazolli, L. A.; da Silva, M. R.; Zaghete, M. A. Ceram. Int. 2012, 38, 741.
- Carta, D.; Casula M. F.; Falqui, A.; Loche, D.; Mountjoy, G.; Sangregorio, C.; Corrias, A. J. Phys. Chem. C 2009, 4, 8606.
- Tavares, C. J.; Rebouta, L.; Rivière, J. P.; Girardeau, T.; Goudeau, P.; Alves, E.; Barradas, N. P. Surf. Coat. Technol. 2004, 187, 393.
Accepted on: 08-02-2019


ISSN Online: 2231-5039

![]()


