Cellulose Production from Sago Frond with Alkaline Delignification and Bleaching on Various Types of Bleach Agents
I. Wayan Arnata1,2 , Suprihatin1, Farah Fahma1, Nur Richana3 and Titi Candra Sunarti*1
1Department of Agroindustrial Technology, Faculty of Agricultural Engineering and Technology, Bogor Agricultural University, Bogor 16680, Indonesia.
2Department of Agroindustrial Technology, Udayana University, Bali 80361, Indonesia.
3Indonesian Center for Agricultural Post Harvest Research and Development (ICAPRD), Bogor 16122, Indonesia.
Corresponding Author E-mail: titi-cs@apps.ipb.ac.id
DOI : http://dx.doi.org/10.13005/ojc/35Specialissue102
Article Received on : 25-02-2019
Article Accepted on : 02-03-2019
Article Published : 09 Apr 2019
Sago frond is a lignocellulose waste that it has not been utilized optimally. The purpose of this study was to produce cellulose from sago frond with alkaline delignification and bleaching on various types of bleach agents. The study was conducted in three stages, namely a characterization of sago frond, alkaline delignification, and bleaching. Proximate analysis showed that sago fronds are potentially used as a cellulose source. The treatments of alkaline delignification and bleaching on various types of bleach agents significantly affected the characteristics of cellulose. The delignification using 10% NaOH for 2 h, after which the bleaching was carried out using the alkaline hydrogen peroxide for the same duration, thereby, producing cellulose of the highest degree of crystallinity and whiteness, while the hemicellulose and lignin contents were relatively low. Thus, sago frond has the potential to be used as a cellulose source and is widely applied.
KEYWORDS:Bleaching; Cellulose; Delignification; Sago Frond
Download this article as:| Copy the following to cite this article: Arnata I. W, Suprihatin S, Fahma F, Richana N, Sunarti T. C. Cellulose Production from Sago Frond with Alkaline Delignification and Bleaching on Various Types of Bleach Agents. Orient J Chem 2019;35(Special Issue 1 Spectroscopy March 2019). |
| Copy the following to cite this URL: Arnata I. W, Suprihatin S, Fahma F, Richana N, Sunarti T. C. Cellulose Production from Sago Frond with Alkaline Delignification and Bleaching on Various Types of Bleach Agents. Orient J Chem 2019;35(Special Issue 1 Spectroscopy March 2019). Available from: https://bit.ly/2UqKylG |
Introduction
Cellulose production by delignification and bleaching has been carried out since the beginning of civilization. Nevertheless, research on cellulose production continues to expand and intrigue to explore. Cellulose has unique characteristics and used widely, such as in papermaking, textiles, waste processing, pharmaceutical products, cosmetics, composite products, and others. This study focused on finding new raw material and improving cellulose characteristics using environmentally friendly and low-cost production. In fact, recently, the research and application on cellulose are directed at organic nanomaterials which are expected to reduce and replace the non-organic and non-environmentally friendly materials.1 Nanocellulose production is constrained by low yields and high production costs. Hence further research and application on micro-size cellulose are very interesting and more widely applied.2,3
In the past decade, researchers have focused on finding effective and rational ways to utilize agricultural waste. This is in line with the increase in demand for natural fiber-based products.4 Sago frond is one source of new raw materials from untapped agricultural waste into a valuable product with around 50% of the world’s sago area, located in Indonesia. According to Indonesian Plantation Statistics data, the total sago plant area in 2004 was around 87,113 ha, and an increase in 2016 to 213,800 ha. During harvest, about 10-20 % of sago trunk or around 0.7-1.1 million tons/year is by-products. Furthermore, a reasonable percentage of this crop is left to rot at the plantation site causing environmental pollution. Frond sago waste has several advantages such as available abundantly, environmentally friendly, renewable, and low cost or even free raw materials. However, literature and research on the utilization of sago frond are very limited and have never been done to date. This condition to be a challenge for researchers to develop the right methods for handling and providing environmentally friendly added value. Moreover, in the last decade, there has been very rapid research development aimed at producing environmentally friendly materials.
Cellulose has been produced from natural sources with various types of methods and widely applied in various industries.There are various advantages and disadvantages of each method associated with the amount and quality of cellulose production. The selection of the appropriate method and process conditions is a crucial factor to avoid changes and damage to the structure of cellulose fibers. Generally, the cellulose production process passes through the stages of delignification and bleaching. The delignification process can be carried out biologically,5,6 physically or chemically.7 Presently, the use of chemical treatment is carried out through acid hydrolysis,8,9 alkaline,10,11 oxidation,12,13 organosolv,14 and ionic solution.15 However, chemical treatment with alkaline hydrolysis is the most popular method used in cellulose isolation with NaOH being the most common alkaline material often used. The characteristics of cellulose fibers produced are very dependent on NaOH concentration, temperature, and processing time. Its concentrations and temperatures are too high with extended processing time capable of causing damages to cellulose structure, high energy requirements, and operating costs. Furthermore, its low concentrations and temperatures with short processing times cause low cellulose consolidation due to the high content of hemicellulose and lignin. In this regard, research is needed to determine the delignification process of sago frond fibers used to produce the best fiber characteristics.
Bleaching is an important factor that must be considered because it does not only act as an unwanted color remover, but also capable of degrading non-cellulose compounds16. The characteristics or quality of cellulose is strongly influenced by the process and the type of bleach agent used. The bleaching process is influenced by various factors such as temperature, pH, stirring, and processing time. Hypochlorite and hydrogen peroxide are bleach agents which have been widely used, however, hypochlorite is known to produce chloride dioxide compounds which causes environmental pollution.17-19 Furthermore, the existence of increasingly severe environmental regulations, forced the industry to seek and develop environmentally friendly bleach agents in the term of elemental chlorine free (ECF) and totally chlorine free (TCF) bleaching.
Presently, ECF and TCF bleaching methods have been studied and developed extensively.20 One of the most developed bleach agents is those produced with hydrogen peroxide based materials, such as peracetic acid and alkaline hydrogen peroxide. Several studies on the bleaching process with hydrogen peroxide (HP) agents have been carried out in cotton21-23 and jute.24 Meanwhile, peracetic acid (PA) has been used as a bleach agent in rice husks,25 cotton,26,27 jute,28 and hemp.16 Furthermore, alkaline hydrogen peroxide has been used in douglas softwood,29,30 corn cobs,31 wheat straw, and rice.32
The different bleaching methods and agents used led to different physical and chemical characteristics of cellulose in purity, dimensions, morphology, crystallinity, and thermal stability. In addition, presently, more researchers report that the bleaching process uses only one type of bleach agent. Consequently, the comparability of its performance to produce the best cellulose characteristics and acceptable is relatively difficult, because the different materials used. A good and acceptable bleaching process is able to reduce impurities, lignin, and hemicellulose without damaging the fiber structure, operating at low temperatures, and short time. Therefore, this study was conducted to isolate and characterize cellulose from sago frond using an alkaline delignification and bleaching process with various types of bleach agents, thus, the characteristics of cellulose are obtained which have the potential to be widely applied.
Material and Methods
The materials used were sago fronds obtained from community’s plantations in Ciasihan Village, Pamijahan Bogor, West Java, Indonesia, NaOH, H2O2, CH3COOH, and H2SO4. The materials used were analyzed using the analytical grades purchased from Merck, Germany.
Methods
Preparation of Sago Fronds Powder
The sago fronds are peeled thinly sliced 5 cm x 10 cm, dried, ground with a disk mill, and enzymatically hydrolyzed. Distilled water was added to the crushed sago fronds in a ratio of 1: 3 (w/v) to create a sago frond suspension. Furthermore, the α-amylase (1600 U/kg) was added to the suspension and heated at 95°C for 30 min. This is conducted to hydrolyze starch of sago fronds, thus, the higher purity fiber is obtained, without damaging the fiber structure. A hydraulic press is then used to separate the liquid fraction from the sago frond fiber and dried in a 60°C blower oven for 24 h. The pulp is then ground to produce a powdery sago frond fiber (SF).33 The chemical composition of SF powder was analyzed by proximate including water, ash, protein, fat, crude fiber, and carbohydrate (by difference) contents.
Effect of NaOH Concentration and Processing Time on Characteristics of Delignificated Sago Frond Fiber
The study was designed using Completely Randomized Factorial Design with 2 factors, which are the concentration of NaOH solution (w/v) consisting of three levels, which are 5% (C5), 10% (C10), and 15% (C15), with the processing time consisting of 3 levels which are 1 h (T1), 2 h (T2), and 3 h (T3). The combination of treatments for each factor was repeated twice, thus 18 treatment units were obtained. The parameters measured in this study were yield, degree of crystallinity, cellulose, hemicellulose and lignin contents. If the treatment has a significant effect on the measured parameters, Duncan’s Multiple Range Test (DMRT) is carried out at the level of α = 5%.
The SF flour (20 g) was put into a 1L beaker glass containing NaOH solution in various concentration treatments with ratio of material weight and solution is 1:20 (w/v). Furthermore, the suspension is stirred constantly (600 rpm) and heated at 100°C by a hot plate stirer. After that, the solution is washed with distilled water until the pH is neutral. Delignificated sago frond fiber (DSF), then dried through an oven at a temperature of 50 ± 2°C for 24 h.
Effect of Bleach Agent Type and Processing Time on Cellulose Characteristics
The study was designed using Factorial Randomized Block Design with 2 factors: first, the type of bleach agent consisting of 3 levels, which are hydrogen peroxide (HP) 30% (v/v),24 peracetic acid (PAA),34 and alkaline hydrogen peroxide (AHP) pH 10.035. Second, the processing time consists of 2 levels which are 1 h (T1) and 2 h (T2). The combination of each factor was repeated twice, thus 12 treatment units were obtained. The parameters measured in this study were cellulose yield, degree of whiteness, degree of crystallinity, cellulose, hemicellulose and lignin contents. If the treatment has a significant effect on the measured parameters, DMRT is carried out at the level of α = 5%.
The DSF (20 g) was included in the bleaching solution with a cellulose weight to solution volume ratio of 1: 2. The bleaching process was carried out at a temperature of 95±2°C with stirring 600 rpm. Cellulose fiber washed through distilled water until obtained neutral pH and dried by an oven at a temperature of 50±2°C for 24 h.
Cellulose Characterization
Scanning Electron Microscopy (SEM)
The morphology of raw materials and cellulose from bleaching process were characterized using SEM (Zeiss EVO MA10). The sample surface coated with a thin gold layer with 60 second sputter time and 20 mA sputter current, then the image was taken using a Secondary Electron (SE) detector with 11.0 kV acceleration voltage.
Yield
The yield was calculated as the cellulose weight percentage obtained after drying at 105°C for 12 h on the weight of the raw material used.33
Degree of Whiteness
The measurement of sample color is conduted by a Chromameter Minolta CR-10 with a Hunter color notation system, characterized by 3 parameters L, a, and b36.
Degree of Crystallinity
The X-ray diffraction (XRD) analisys of cellulose is carried out at a temperature of 2θ between 5-40°C with a scan rate of 2°/min (Bruker Advance D8). All samples were dried at 50°C for 12 h with an oven before using XRD. The degree of crystallinity of the material is calculated through the Segal method37 (Eq. 1). The value of d-spacing of cellulose fibers is calculated using the Bragg’s equation (Eq. 2), while the crystallite size is calculated using the Scherrer’s equation38 (Eq. 3).
CrI = [(I200 – IAM)/I200] x 100% … (1)
Where CrI is a degree of crystallinity, I002 is the maximum intensity of 200 peak diffraction in unit 2θ = 22.5° which shows crystalline and amorphous degree. IAM is the diffraction intensity in units 2θ = 18°C which illustrates the degree of amorphous.
Bragg’s equation: Nλ =2d sin θ … (2)
Scherrer’s equation: L = (0.9 λ) / (H cos θ) … (3)
Where L is the crystallite size, λ is the X-ray wavelength (0.15418 nm), H is the full width at half maximum (FWHM) in radians, and θ is Bragg’s angle. X-ray diffraction profiles at each of 1-10, 110, and 200 peaks are fitted by multiple peak fit-OriginPro 2017 (OriginLab Corp. US) used to determine the FWHM value with the Lorentz peak function model deconvolution. The example of a deconvolution model is presented in Fig. 1b and Fig. 2b, with R2: 0.92- 0.93).
Cellulose, Hemicellulose, and Lignin Contents
Cellulose, hemicellulose and lignin contents are determined with the method developed of Van Soest which include Neutral Detergent Fiber (ADF), Acid Detergent Fiber (NDF), cellulose, hemicellulose and lignin.39
Results and Discussion
Chemical Characteristics of Sago Frond
Sago fronds are part of the tips of the sago trunk plants removed during harvesting. It is a lignocellulose waste consisting of the main components of crude fiber and carbohydrates in the percentage of 48% and 30.96%, respectively. The remaining percentage comprises of water, fat, protein, and ash fraction, each consist of 11.05%, 2.64%, 1.51% and 5.35%. Crude fiber is the largest fraction with 79.54% NDF, 53.4% ADF, 23.70% cellulose, 26.14% hemicellulose and 29.7% lignin. The content of sago frond cellulose in this study was lower compared to other lignocellulosic sources, such as the banana stem fibers (69.9%), pineapple (75.3%),40 sisal (50%),41 corn cobs (45%),42 and rice husks (40%).25 Sago frond still contains starch of around 26.38% as a fraction of carbohydrates, resulting in low cellulose contents. The difference in raw material content is caused by differences in the types and sources of raw materials.
Effect of NaOH Concentration and Processing Time on Characteristics of Delignificated Sago Frond Fiber (DSF)
Delignification is the process of removing or separating the lignin fraction from the lignocellulose structure. The characteristics of DSF which is obtained from the treatment of NaOH concentrations in various times of the delignification process are presented in Table 1.
Table 1: Characteristics of delignificated sago frond fibers with the treatment of NaOH concentration and processing time (% db).
| Treatments | Yield | Crystallinity | Cellulose | Hemicellulose | Lignin |
| C5T1 | 38.14a | 31.90e | 25.11e | 25.92a | 24.11a |
| C5T2 | 30.57b | 33.90cd | 35.99d | 24.55a | 14.58e |
| C5T3 | 26.65b | 37.10b | 36.63d | 23.72a | 14.93de |
| C10T1 | 21.51c | 37.35b | 41.36c | 19.14b | 20.40b |
| C10T2 | 13.86d | 40.65a | 54.81b | 15.93c | 16.64cd |
| C10T3 | 13.22d | 40.00a | 55.74b | 12.22d | 17.06c |
| C15T1 | 12.54d | 33.05de | 42.18c | 17.40bc | 22.31a |
| C15T2 | 13.03d | 34.95c | 56.74b | 7.87e | 13.17ef |
| C15T3 | 11.13d | 35.20c | 59.67a | 7.46e | 11.54e |
*The mean value (n = 2) followed by the same letter in the same column shows an not significantly difference by the DMRT test (p-value> 0.05).
Yield of Delignificated Sago Frond
The yield is produced from the delignification stage which is the percentage of comparison between the delignificated sago fronds fibers (DSF) and the weight of the flour of sago fronds fibers (SF) on a dry basis. The results showed that the interaction between NaOH concentration and time on delignification process had a significant effect on DSF yield (p-value<0.05) as presented in Table 1. The higher the NaOH concentration and processing time, the lower the yield value of DSF fibers. The highest yield value is generated from the delignification process using a 5% NaOH concentration for 1 h, which is 38.14%. The increase in NaOH concentration from 5% to 15% is followed by an increase in processing time from 1 to 3 h leading to a decrease in DSF fiber yield value of 11.13%. This is caused by the degradation of hemicellulose and lignin which influences the decrease in the weight of the DSF.43,44 Furthermore, a decrease in DSF weight effect, leads to a decrease in the yield produced. The decrease in yield due to alkali treatment was also reported in pear pomace materials,45 energycane bagasse,44 and lotus Fiber.46
Degree of Crystallinity
The degree of crystallinity is an important factor which determines the mechanical and thermal characteristics of cellulose fibers.47 The process of delignification with a treatment combination of NaOH concentration and processing time had a significant effect on crystallinity degree of DSF (p-value<0.05). It increases, if the NaOH concentration is raised from 5% to 10%. Furthermore, raising the concentration of NaOH by 10% at all treatment levels leads to a decrease of crystallinity. This is seen when 5% NaOH concentration with a processing time of 1 h produces a crystallinity degree of 31.90%, increases to 40.65% after it was raised to 10% for 2 h. However, the use of 15% NaOH concentration for 1-3 h effected in a decrease of crystallinity degree that ranges from 33.05 to 35.20% (Table 1). The results of this study are appropriate with the research conducted by Reddy et al., which stated that an increase in alkaline concentration and processing time led to damage to the molecular structure of cellulose.48 Furthermore, alkaline solutions are also reported to have the ability to defibrillate and depolymerize shorter cellulose structures.40
The increasing of the NaOH concentration from 5-10% and processing time from 1-3 h causes higher degradation levels of the amorphous structure of cellulose, thus producing a higher crystallinity degree. However, the increase in NaOH concentration and processing time led to changes in the crystalline structure of cellulose. This is indicated from XRD analysis which illustrates a change in the crystalline structure of cellulose from type I to type II, followed by a decrease in the crystallinity degree (Fig. 1). This result is in line with the Gong et al.’s study, which stated that the change of polymorph from cellulose I to II led to a decrease in crystallinity degree.49 Cellulose is known to have 4 types of polymorph including types I, II, III, and IV, which is distinguished by analysis of X-Ray diffraction.50,51 Cellulose I is natural, while type II is a form of swollen from cellulose I which is macerated with alkali solution.42 The use of NaOH concentrations of more than 10% led to swelling in the cellulose structure, thus the level of fiber compaction decreases. This result is in line with Abraham et al.’s study, which states that alkaline solutions cause swelling of fibers40. The decrease in fiber compaction was also confirmed from the XRD analysis, which showed the value of d-spacing, such as the distance between cellulose fiber chains which increased after the NaOH concentration and process time were increased. Ju et al. stated that the value of d-spacing applied, is an indicator of compaction levels from the crystalline cellulose structure.52 The mean value of d-spacing after delignification increased from 0.51 nm (SF) to 0.53 nm (DSF) (Table 2).
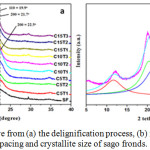 |
Figure 1: XRD curve from (a) the delignification process, (b) model for measurement of d-spacing and crystallite size of sago fronds. |
Table 2: The value of d-spacing and crystallite size of cellulose from sago frond.
| Treatments | d-spacing (nm) | Mean | Crystallite size (nm) | Mean | ||||
| 1-10 | 110 | 200 | 1-10 | 110 | 200 | |||
| SF | 0.56 | 0.53 | 0.42 | 0.51 | 0.53 | 0.39 | 0.68 | 0.53 |
| C5T1 | 0.60 | 0.54 | 0.40 | 0.51 | 3.92 | 0.63 | 2.12 | 2.23 |
| C5T2 | 0.60 | 0.55 | 0.40 | 0.52 | 1.54 | 2.20 | 3.82 | 2.52 |
| C5T3 | 0.62 | 0.58 | 0.40 | 0.53 | 3.24 | 2.07 | 2.47 | 2.59 |
| C10T1 | 0.63 | 0.54 | 0.42 | 0.53 | 1.55 | 2.91 | 3.59 | 2.68 |
| C10T2 | 0.73 | 0.44 | 0.41 | 0.53 | 3.84 | 3.45 | 4.48 | 3.93 |
| C10T3 | 0.73 | 0.45 | 0.41 | 0.53 | 3.68 | 3.74 | 4.75 | 4.05 |
| C15T1 | 0.72 | 0.46 | 0.41 | 0.53 | 2.83 | 2.68 | 5.20 | 3.57 |
| C15T2 | 0.70 | 0.47 | 0.42 | 0.53 | 1.04 | 7.36 | 2.36 | 3.59 |
| C15T3 | 0.73 | 0.44 | 0.41 | 0.53 | 3.23 | 4.12 | 3.85 | 3.73 |
XRD analysis shows that sago frond (SF) fiber is cellulose I. It is shown from peak of 2 tetha located around 14.5°, 16.5°, and 22.5°, which represent crystalline planes of 1-10, 110, and 200, respectively.53 However, its change in cellulose type from I to II occurred after the treatment of delignification with NaOH concentrations of more than 5%. This is indicated from the location of the 2 tetha peak in the crystalline plane 1-10, 110, and 200 is experiencing changes to 12.1°, 19.9°, and 21.7°, respectively (Fig. 1).
Changes in the value of 2 tetha will affect the value of d-spacing and crystallite size of the DSF. Generally, the value of d-spacing will increase and the size of the crystallite will reduce with a decrease in the value of 2 tetha. The increased of d-spacing value can be seen from the decrease in the value of 2 tetha in plane 1-10, around 14.5° to around 12.5°. Therefore, the d-spacing increased from 0.56 nm to around 0.60-0.70 nm after SF was given alkaline treatment. The higher value of d-spacing showed cellulose structure became less compact because the distance between cellulose fiber chains became increasingly tenuous after the delignification process with NaOH. This is obviously because alkaline solutions are known to affect swelling of the cellulose structure, thereby, increasing the distance between the chains. The results of this study also supports the statement of Harun and Geok, which states that alkaline treatment might cause swelling of the fiber structure, and led to an increase in area and volume of the cellulose surface.54
Cellulose Content
The results showed that the interaction between the treatment of NaOH concentration and the time of delignification process had a significant effect on cellulose levels from DSF (p-value <0.05). The lowest cellulose content was obtained from the treatment of 5% NaOH with a processing time of 1 h which was equal to 25.11%, while the highest cellulose content was 59.67% acquired from the treatment of 15% NaOH concentration with a processing time of 3 h (Table 1). It is also able to increase cellulose levels by 60.28%. These results indicate that it increases with a rise in NaOH concentration and processing time. The increased of cellulose content are caused by the ability of alkaline solutions to break the bonds of β-D-glucopiranose, degrade the structure of hemicellulose, lignin,55 wax,56 oils, and lipids that cover the fiber surface.40 This is also confirmed from the analysis results of hemicellulose and lignin contens which decrease with an increase in NaOH concentration and processing time as presented in Table 1. Alkali treatment is able to increase cellulose concentration, thus it improves the mechanical characteristics of cellulose fibers.57
Hemicellulose and Lignin Contents
The results shows that the interaction between the treatment of NaOH concentration and processing time had a significant effect on the hemicellulose and lignin contents of DSF (p-value<0.05). The highest hemicellulose and lignin contents were obtained from the treatment of 5% NaOH concentration with 1 h processing time which was 25.92% and 24.11%, respectively. Whereas, the lowest hemicellulose and lignin contents were obtained from 15% NaOH concentration with a 3 h processing time were 7.46% and 11.54%, repectively (Table 1). These results indicate that hemicellulose and lignin contents decreases with increasing NaOH concentration and processing time of delignification. The treatment of 15% NaOH concentration with a processing time of 3 h was able to reduce hemicellulose and lignin contents by 71.46% and 61.14%, respectively, against the hemicellulose and lignin contents of SF. This led to a randomized and amorphous structure of the hemicellulose and lignin, therefore, they were easily degraded.41 Decreased hemicellulose contents are higher than lignin contents due to hemicellulose being more sensitive to alkaline compared to lignin and cellulose.48,58 Sodium hydroxide is able to dissolve hemicellulose and lignin which are contained in fibers.59
Effect of Bleach Agent Type and Processing Time on Cellulose Characteristics
The bleaching process is carried out after the delignification process to remove the crhomophore compounds or the remaining hemicellulose and lignin in the delignification process, thus the cellulose becomes whiter. The delignificated sago fiber which is applied as bleaching material is the result of K10W2 treatment with the highest crystallinity degree of 40.65%, thereby, producing better physical, mechanical and thermal characteristics. Cellulose sago frond characteristics which produced on various types of bleach agents and processing time as presented in Table 3.
Table 3: Characteristics of cellulose sago frond on various types of bleach agents and processing time (% db).
| Treatment | Yield | Crystallinity | Whiteness | Cellulose | Hemicellulose | Lignin |
| HP-T1 | 31.32bc | 57.00bc | 69.12d | 57.89c | 8.60a | 8.85a |
| AP-T1 | 45.73a | 55.30c | 72.28c | 60.86bc | 6.02b | 8.46a |
| AHP-T1 | 38.50ab | 56.00bc | 76.72b | 57.66c | 5.20b | 9.16a |
| HP-T2 | 30.90bc | 57.55b | 71.65c | 60.41bc | 2.57c | 3.84b |
| AP-T2 | 26.29c | 60.75a | 77.76ab | 64.77ab | 2.79c | 3.44b |
| AHP-T2 | 27.97c | 60.30a | 79.13a | 68.42a | 2.81c | 3.84b |
* The mean value (n = 2) followed by the same letter in the same column shows an not significantly difference by the DMRT test (p-value> 0.05).
Yield of Cellulose
The yield of the bleaching process is the percentage of comparison between the weight of SFB and DSF on a dry basis. The results showed that the interaction between the type of bleach agent and the processing time had a significant effect on the yield of cellulose (p-value<0.05) as presented in Table 3. The highest yield of 45.73% was obtained from the use of PA bleach agent for 1 h. An increase to 2 h led to a decrease in yield to 26.29%. Generally, an increase in the bleaching processing time for all types of bleach agents led to a decrease in cellulose yield. The decrease in yield occurs due to degradation of hemicellulose and lignin during the bleaching process.25 The results of similar studies were reported in bleaching energycane bagasse fibers with sodium chlorite treatment,44 cotton fibers with PAA,12 and pulp kraft with HP.60
Degree of Crystallinity
The treatment of bleach agent types with the processing time on the bleaching process significantly affected the crystallinity degree of cellulose (p-value<0.05). The use of PA and AHP agents for 2 h led to the highest degree of crystallinity with not significantly difference (Table 3). Meanwhile, the bleaching process with HP produces a relatively low degree of crystallinity. This is caused by the nature of hydrogen peroxide which effect damage to the structure of cellulose.28 The bleaching process is able to increase the fiber crystallinity of 40.65% (DSF) to 60.75% (SFB). This shows that the amorphous structures of cellulose, hemicellulose, and lignin are degraded during the bleaching process.40 The increased of crystallinity degree is evidenced by the peak in 200 plane which is increasingly pointed after the bleaching process (Fig. 2a).
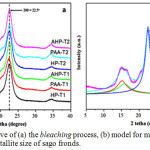 |
Figure 2: XRD curve of (a) the bleaching process, (b) model for measurement of d-spacing and crystallite size of sago fronds. |
Table 4: The value of d-spacing and crystallite size of cellulose from sago frond.
| Treatments | d-spacing (nm) | Mean(nm) | Crystallite size (nm) | Mean (nm) | ||||
| 1-10 | 110 | 200 | 1-10 | 110 | 200 | |||
| HP-T1 | 0.60 | 0.54 | 0.40 | 0.51 | 3.39 | 3.03 | 3.96 | 3.46 |
| PAA-T1 | 0.59 | 0.55 | 0.40 | 0.51 | 2.58 | 2.27 | 3.39 | 2.75 |
| AHP-T1 | 0.60 | 0.54 | 0.40 | 0.51 | 3,54 | 3.26 | 4.09 | 3.63 |
| HP-T2 | 0.59 | 0.54 | 0.40 | 0.51 | 3.20 | 3.59 | 3.88 | 3.56 |
| PAA-T2 | 0.60 | 0.54 | 0.40 | 0.51 | 4.11 | 3.67 | 4.38 | 4.05 |
| AHP-T2 | 0.60 | 0.54 | 0.40 | 0.51 | 3.83 | 3.49 | 4.52 | 3.95 |
The results of the XRD analysis showed that the DSF fiber was original of cellulose II (Fig. 1), and after the bleaching process, it was changed back to type I, accompanied by an increase in the degree of crystallinity. The similar study report was stated by Abraham et al., which stated that type II cellulose pineapple fibers extracted with oxalic acid showed type I upon return.40 Meanwhile, Gong et al. stated that the crystallinity of cellulose II treated with sulfuric acid led to an increase in crystallinity degree.49 The bleaching process with the treatment of various bleach agents and processing time did not cause changes in cellulose structure as shown in the plane of 1-10, 110 and 200 from the peak of 2 tetha, and still located around 14.5°, 16.5° and 22.5°, respectively (Fig. 2a). This result is also supported by the same average of d-spacing values in all treatment combinations. The bleaching process was also able to reduce the value of d-spacing from the initial DSF of 0.53 nm (Table 2) to 0.51nm (Table 4 and Fig. 2b). This means that the bleaching process is able to re-close the distance between cellulose fibers to produce a more compact fiber structure. Generally, the closer the distance between cellulose chains, the higher the size of the crystallite formed. The increase of crystallite size led to recrystallization of the cellulose chains through hydrogen bonds.61 Hydrogen bonds to cellulose occured through intramolecular and intermolecular bonds from the cellulose chain, and with the van der Waals bond, the cellulose structure arranged regularly to form a larger crystalline region.62 Increased crystallite size and crystallinity degree lead to a decrease in chemical reactivity and water absorption ability,63 however, it was able to improve physical mechanical properties such as stiffness and tensile strength of the cellulose structure.64
Degree of Whiteness
The results showed that the interaction between the type of bleach agent and the processing time had a significant effect on the whiteness degree of the cellulose (p-value<0.05). The use of PAA and AHP agents for 2 h showed that the whiteness degree of cellulose was not significant, namely 77.76% and 79.13%, respectively (Table 3). This is caused by cellulose having lower lignin content compared to other treatments. According to Silaban et al., and Bajpai, whiteness degrees are influenced by the high and low contents of lignin in the ingredients. The higher content of lignin in cellulose fiber, the lower brightness or whiteness level.65,66
Hydrogen peroxide agents tend to produce cellulose with lower whiteness degrees than other bleach agents. The results of this study are appropriate with those reported by Patel et al., which stated that jute fiber bleaching using HP produced a lower degree of whiteness (63.22%) compared to the use of PAA (64.15%).28 This is as a result of the HP is stable in acidic conditions. Consequently, the perhydroxyl (OOH–) anions produced can be used to oxidize crhomophore compounds are relatively less compared to other bleach agents. Krizman et al., stated that the bleaching process using AP produced higher whiteness degrees of cellulose fibers at shorter temperature and processing times without the addition of auxiliary agents, thus energy requirements and rinsing water during bleaching were lower.26 Meanwhile, the results of this study indicate a tendency that AHP agents produce higher whiteness degrees than others. This is due to the HP in an alkaline solution (AHP) which tends to produce more perhydroxyl anions (OOH–) to oxidize the structure of lignin and crhomophore groups.67 Perhydroxyl anions (OOH–) will eliminate conjugated carbonyl groups on lignin to produce fibers with higher whiteness degrees.66 Hydrogen peroxide is able to turn with the carbonyl structure of the crhomophore compounds contained in lignin including the structure of quinone and cinnamaldehyde.68
Cellulose Content
The results showed that the interaction between the treatment of bleach agent type and the process time had a significant effect on cellulose contents (p-value<0.05). When the process used AHP agent for 2 h, it was able to increase the cellulose contents to 68.42%. However, the cellulose content of this treatment was not significantly different from that produced using PAA agent for 2 h (Table 3). The increase in cellulose content is very closely related to the reduction in contents of hemicellulose and lignin. According to Galdeano and Grossmann, HP was able to dissolve the components of lignin and hemicellulose which led to a decrease in their contents.69 According to Abraham et al., hemicellulose and lignin are fiber fractions that are easier to absorb and very susceptible to degradation by the penetration of chemicals.40
Hemicellulose and Lignin Contents
The results showed that the interaction between the type of bleach agent treatment with the processing time had a significant effect on the contents of hemicellulose and lignin (p-value<0.05). The increase of the processing time from 1 to 2 h to all types of bleach agents leads to a decrease in the contents of hemicellulose and lignin. The use of HP, PAA, and AHP agents for 2 h produced the lowest hemicellulose and lignin contents, at a range of 2.57-2.81% and 3.44% -3.84%, respectively (Table 3). Generally, the bleach agent will produce OH· and radicals that it will react with aromatic rings or phenolic structures, thus, it increases solubility and hydrophilicity of lignin, and decreases its presence in cellulose fibers.66 Despite dissolving its fraction, bleach agents are also able to degrade xylan and hemicellulose of fibers.16,70
Characteristics and Potential Application of Sago Frond Cellulose
The yield of cellulose from sago fronds was ranging from 26.29 to 45.73%. This yield was relatively low compared to wood 45-50%71 and poplar 43.8%.72 However, the yield was higher compared to Passiflora foetida fiber 7.6%,73 palm leaf oil 23.2%,74 and alfalfa stem 20.7%.72 Even though the yield was relatively low, it has advantages such as abundant, low lignin and hemicellulose content. This can reduce temperature, pressure, processing time, chemical, and changes in cellulose structure compared to other sources. Indirectly, this condition can reduce energy consumption and production cost. Before delignification and bleaching, cellulose had a rugged surface and bundle-shaped fibers with a diameter of 137.22 ± 33.42 μm and a length of 1.05 ± 0.16 mm (Fig. 3a). The average length of the sago frond fiber was smaller than the softwood 2.7-4.6 mm, almost similar to the oil palm leaf 1.13 mm and hardwood 0.7-1.6 mm.73 After bleaching, the fiber surface was smoother, the fiber bundle was released and formed smaller fibers with a diameter of 11.77 ± 2.39 μm and a length of more than 1 mm (Fig. 3b). The average diameter of frond sago fiber was smaller than hardwood 20-40 μm,73 and almost similar to Passiflora foetida 10 μm,73 and banana fiber 13.16 μm.75
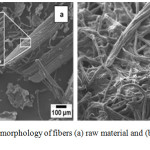 |
Figure 3: Surface morphology of fibers (a) raw material and (b) cellulose after bleaching. |
The produced sago frond cellulose had a pretty high cellulose content with low hemicellulose and lignin content. It showed that the purity of cellulose sago frond was quite high compared to other sources (Table 5). This condition is also supported by the high whiteness compared to other sources (Table 6). Differences in the level of cellulose, hemicellulose, lignin, and whiteness degrees in various materials were caused by differences in the types of raw materials, methods, and process conditions.
Table 5: Comparison of cellulose, hemicellulose, and lignin content from several types of materials.
| Material | Cellulose (%) | Hemicellulose (%) | Lignin (%) |
| Cotton76 | 93.00 | 3.00 | – |
| Pineapple77 | 73.40 | 7.10 | 10.50 |
| Sago frond (in this study) | 68.42 | 2.81 | 3.84 |
| Sisal78 | 65.00 | 12.00 | 9.90 |
| Wheat straw79 | 61.80 | 19.00 | 14.10 |
| Banana fiber4 | 49.33 | 12.04 | 13.88 |
| Pine80 | 45.30 | 25.10 | 26.40 |
| Switchgrass80 | 40.70 | 30.40 | 17.40 |
| Oil palm fiber81 | 40.20 | 32.10 | 18.70 |
| Passiflora foetida73 | 40.00 | 36.00 | 24.00 |
| Oil palm leaf74 | 43.80 | 36.40 | 19.07 |
| Rice hull82 | 30.98 | 32.68 | 16.21 |
| Corncob33 | 31.20 | 43.10 | 3.40 |
Table 6: Comparison of cellulose’s whiteness from several materials.
| Material | Bleach agents |
Whiteness (%) |
| Switchgrass80 | Active alkaline |
30.13 |
| Pine80 | Active alkaline |
21.87 |
| Wheatgrass80 | Active alkaline |
33.55 |
| Sago frond (in this work) | Alkaline hydrogen peroxide |
79.13 |
| Jute28 | Hydrogen peroxide |
63.22 |
| Jute28 | Peracetic acid |
64.15 |
| Eucalyptus camaldulensis83 | Sodium hypochlorite |
79.00 |
| Populus alba83 | Sodium hypochlorite |
79.40 |
| Cupressus sempervirens83 | Sodium hypochlorite |
73.60 |
| Acacia nilotica83 | Sodium hypochlorite |
73.70 |
| Cotton26 | Peracetic acid |
44.17 |
Sago frond cellulose had a whiteness of 79.13% and L/D ratio of 90. This characteristic has the potential to be applied as a raw material in papermaking. The main requirements of fiber in papermaking are to be white with high affinity, not soluble in water and organic solvents,83 containing more than 34% cellulose, and less than 30% lignin,84,85 the minimum L/D ratio or Slenderness ratio is 70.86
Table 7: Comparison of the crystallinity degree of cellulose from various materials.
| Material | Degree of crystallinity (%) | d-spacing (nm) | Crystallite size (nm) |
| Acacia nilotica83 | 45.20 | – | – |
| Eucalyptus camaldulensis83 | 54.16 | – | – |
| Banana40 | 83.80 | – | – |
| Bamboo64 | 75.00 | – | – |
| Rice strow87 | 61.10 | – | 3.44 |
| Wood87 | 61.50 | – | 3.32 |
| Sugarcane bagasse1 | 74.20 | – | 4.00 |
| Frond sagu (In this work) | 60.75 | 0.51 | 4.05 |
| Microcrystalline avicel88 | 76.00 | 0.39 | 6.89 |
Table 7 shows that some materials have a higher or lower degree of crystallinity than cellulose frond sago, but measurements of the d-spacing value and crystallite size were not carried out. Cellulose frond sago had a relatively high crystallinity degree, small d-spacing value, and large crystallite size compared to other materials, except for commercial microcrystalline avicel cellulose. This showed that cellulose frond sago had strong characteristics, because it was composed of glucose chain structures that are regular, tight, and compact. Based on these characteristics, cellulose has the potential to be applied as a structural reinforcement material in polymer composites that requires high physical, mechanical, and thermal stability. This potential is also supported by a high L/D ratio. The minimum aspect of the L/d ratio for a reinforcing agent in the fiber composite matrix is 10.89,90 Cellulose with high L/d ratio gives a high specific area thus produce a greater reinforcement effect.91
The high purity of cellulose sago fronds indicated that cellulose had a high free hydroxyl group. Cellulose had a micro-scale means it had a high surface area. This characteristic has the potential as an adsorbent with a high absorption capacity. Adsorbents can be applied in liquid waste treatment. The hydroxyl group on cellulose allows modification on the cellulose surface with other compounds to improve its functional properties. In addition, cellulose can be applied in various fields such as pharmaceuticals, cosmetics, medicines, and others.
Conclusion
Sago frond has possibility to be applied as a source of cellulose because it contains a fairly high crude fiber content of 48%. The NaOH concentration and time of delignification process affect the yield value, degree of crystallinity, cellulose, hemicellulose and lignin contents. The delignification process through 10% NaOH for 2 h produced the best characteristics of DSF with a yield of 13.86%, the crystallinity degree of 40.65%, cellulose of 54.81%, hemicellulose of 15.93%, and lignin of 16.64%. The type of bleach agent and the time of the bleaching process also affect the yield value, degree of crystallinity, cellulose, hemicellulose and lignin contents. The bleaching process by AHP agent for 2 h produced cellulose with a yield of 27.97%, degree of crystallinity 60.30%, degree of whiteness of 79.13%, cellulose of 68.42%, hemicellulose of 2.81%, and lignin of 3.84%. Cellulose from sago fronds has the potential to be applied in various fields such as paper making and reinforcement in the manufacture of composite materials.
Acknowledgements
The author is grateful to the Lembaga Pengelola Dana Pendidikan (The Educational Finance Administration Board – LPDP) of the Ministry of Finance of the Republic of Indonesia through a Beasiswa Unggulan Dosen Indonesia-Dalam Negeri (Indonesian Scholarship-BUDI-DN) scholarship, and KP4S project fiscal year 2017-2018, for its financial support.
Conflicts of Interest
There is no conflict of interest.
References
- Ghaderi M.; Mousavi, M.; Yousefi, H.; Labbafi, M. Carbohydr. Polym. 2014, 104, 59–65.
- Chen, L.; Zhu, Y. J.; Baez, C.; Kitin, P.; Elder, T. Green Chem. 2016, 1-32.
- Trache, D.; Hussin, M. H.; Chuin, C. T. H.; Sabar, S. Fazita, M. R. N.; Taiwo, O. F. A.; Hassan, T. M. H.; Haafiz, M. K. M. Int. J. Biol. Macromol. 2016, 93, 789–804.
- Subagyo, A.; Chafidz, A. IntechOpen. 2018, 1-19.
- Kuhad, R. C.; Singh, A.; Eriksson, K. E. L. Advances in biochemical engineering biotechnology. Berlin, Springer Verlag. 1997, 45-125.
- Wong, D. W. S. Appl. Biochem. Biotechnol. 2009, 157, 174-209.
- Gámez, S.; González, J. J.; Ramírez, J. A.; Garrote, G.; Vázquez, M. J. Food Eng. 2006, 74, 78-88.
- López-Linares, J. C.; Cara, C.; Moya, M.; Ruiz, E.; Castro, E.; Romero, I.. Industr. Crops. Prod. 2013, 50, 525-531.
- Liu, Z. S.; Wu, X. L.; Kida, K.; Tang, Y. Q. Bio.r Tech. 2012, 119, 224-233.
- Rocha, G. J. M.; Gonçalves, A. R.; Oliveira, B. R.; Olivares, E. G.; Rossell, C. E. V. Ind. Crop. Prod. 2012, 35, 274-279.
- Sari, N. H.; Wardana, I. N. G.; Irawan, Y. S.; Siswanto, E. J. Nat. Fib. 2017, 1-14.
- Abdel-Halim, E. S.; Al-Deyab, S. S. Carbohydr. Polym. 2011, 86, 988-994.
- Yin, D. L. T.; Jing, Q.; AlDajani, W. W.; Duncan, S.; Tschirner, U.; Schilling, J.; Kazlauskas, R. J. Bior. Tech. 2011, 102, 5183-5192.
- Cybulska, I.; Brudecki, G.; Rosentrater, K.; Julson, J. L.; Lei, H. Bior. Tech. 2012, 118, 30-36.
- Zhang, Z.; O’Hara, I. M,; Doherty, W. O. S. BiorTech. 2012, 120, 149-156.
- Gedik, G.; Avinc, O. Fibers Polym. 2018. 19, 82-93.
- Lee, L. J. H.; Chan, C. C.; Chung, C. W.; Ma, Y. C.; Wang, G. S.; Wang, J. D. J. Toxic Environ. Health. 2002, 65, 219-235.
- Afolabi, A.; Sigwadi, R.; Abdulkareem, A. Int. J. Mat. Metallurg. Eng. 2012, 6, 477-480.
- Chen, H. M.; Wu, M. T. Scien.t Reports. 2016, 7, 1-9.
- Kukkola, J.; Knuutinen, J.; Paasivirta, J.; Herve, S.; Pessala, P.; Schultz, E. J. Anal. Appl. Pyrolysis. 2006, 76, 214–221.
- Winkler, J.; Smith, E. R.; Compton, R. G. J. Coll. Interf. Sci. 1997, 195, 229-240.
- Abdel-Halim, E. S.; Al-Deyab, S. S. Carbohydr. Polym. 2013, 92,1844-1849.
- Liu, K.; Zhang, X.; Yan, K. Carbohydr. Polym. 2018, 188, 221-227.
- Choedhury, Z. Z.; Hamid, S. B. A. BioResources. 2016, 11, 3397-3415.
- Nascimento, P.; Marim, R.; Carvalho, G.; Mali, S. Mat. Research. 2016, 19, 167-174.
- Križman, P.; Kovac, F.; Tavcer, P. F. Color. Technol. 2005, 121, 304-309.
- Prabaharan, M.; Nayar, R. C.; Rao, J. V. Textile. Res. J. 2000, 70, 657-661.
- Patel, S.; Sharan, M.; Chattopadhyay, D. P. J. Textile Sci. Eng. 2016, 6,4.
- Alvarez-Vasco, C.; Zhang, X. Bior. Tech. 2013, 150, 321–327.
- Alvarez-Vasco, C.; Zhang, X.. Biom. Bioen. 2017, 96, 96-102.
- Banerjee, G.; Car, S.; Liu, T.; Williams, D. L.; Meza, S. L.; Walton, J. D.; Hodge, D. B. Biotechnol. Bioeng. 2012, 109, 922–931.
- Sun, C.; Liu, R.; Cao, W.; Yin, R.; Mei, R.; Zhang, L. Energy Fuels. 2015, 29, 4966-4975.
- Silvério, H. A.; Neto, W. P. F.; Dantas, N. O.; Pasquini, D. Industr. Crops. Prod. 2013, 44, 427-436.
- Zhao, X.; Zhang, T.; Zhou, Y.; Liu, D. J. Molecul. Cataly A, Chem. 2007, 271, 246–252.
- Wang, Z.; Li, J.; Barford, J. P.; Hellgradt, K.; McKay, GInt. J. Environ. Agri. Res. 2016, 2, 67-77.
- Indrarti, L.; Indriyati; Syampurwadi, A.; Pujiastuti, S. International Symposium on Frontier of Applied Physics (ISFAP); AIP Conference Proceedings. 2015, 1711, 050007.
- Segal, L.; Creely, J. J.; Martin, A. E.; Conrad, C. M. Text. Res. J. 1959, 29, 786-794.
- Fahma, F.; Shinichiro, I.; Naruhito, H.; Tadahisa, I.; Akio, T. Cellulose. 2011. 18, 443–450.
- Van Soest, P. J.; Robertson, J. B.; Lewis, B. A. J. Dairy Sci. 1991. 74, 3583-3597.
- Abraham, E.; Deepa, B.; Pothan, L. A.; Jacob, M.; Thomas, S.; Cvelbar, U.; Anandjiwala, R. Carbohydr. Polym. 2011, 86, 1468–1475.
- Moran, J. I.; Alvarez, V, A.; Cyras, V. P.; Vazquez, A. Cellulose. 2008, 15,149–159.
- Gautam, S. P,; Bundela, P. S.; Pandey, A. K,; Jamaluddin; Awasthi, M. K.; Sarsaiya, S. J. App. Nat. Sci. 2010, 2, 330-343.
- Barlianti, V.; Dahnum, D.; Hendarsyah, H.; Abimanyu, H. Proced. Chem. 2005, 16,195-201.
- Yue, Y.; Han, J.; Han, G.; Aita, g. M.; Wu, Q. Ind. Crops Prod. 2015, 76, 355–363.
- Rabetafika, H. N.; Bchir, B.; Blecker, C.; Paquot, M.; Wathelet, C. Biomass Bioenergy. 2014, 1-11.
- Cheng, C.; Guo, R.; Lan, J.; Jiang, S.; Du, Z.; Zhao, L.; Peng, L. Fiber. Polym. 2017, 18, 1671-1678.
- Chen, W.; Yu, H.; Liu, Y.; Chen, P.; Zhang, M.; Hai, Y. Carbohydr Polym 2011, 83, 1804–1811.
- Reddy, K. O.; Maheswari, C. U.; Shukla, M.; Song, J. I.; Rajulu, A. V. Composites, Part B. 2013, 44, 433–438.
- Gong, J.; Li, J.; Xu, J.; Xiang, Z.; Mo, L. RSC Adv. 2017, 7, 33486-33493.
- Isogai, A.; Usuda, M.; Kato, T.; Uryu, T.; Atalla, H. R. Macromolecules. 1989, 22, 3168-3172.
- Park, S.; Baker, J. O.; Himmel, M. E.; Parilla, P. A.; Johnson, D. K. Biotechnol. Biofuels. 2010, 3, 1-10.
- Ju, X.; Bowden, M.; Brown, E. E.; Zhang, X. Carbohydr. Polym. 2015, 123, 476–481.
- Lomelí-Ramírez, M. G.; Anda, R. R.; Satyanarayana, K. G.; de Muniz, G. I. B; Iwakiri, S. BioResources. 2018, 13, 637-1660.
- Harun, S.; Geok, S. K. Indian J. Sci. Technol. 2016, 9, 1–21.
- Zaini, L. H.; Jonoobi, M.; Tahir, P. M.; Karimi, S. J. Biomater. Nanobiotechnol. 2013, 4, 37-44.
- Mohanty, A. K.; Misra, M.; Drzal, L.T. Compos. Interfaces. 2001, 8, 313–343.
- Li, Y.; Jiang, L.; Xiong, C.; Peng, W.. Ind Eng Chem Res. 2015. doi 10.1021/acs.iecr.5b02724.
- Gassan, J.; Bledzki, A. K. Compo. Part A. 1997, 28, 1001–5.
- Mustajoki, S.; Leponiemi, A.; Dahl, O. BioResources. 2010, 5, 808-826.
- Potùèek, F.; Milichovský, M. Chem.Papers. 2000, 5, 406-411.
- Lu, P.; Hsieh, Y. L. Carbohyd. Polym. 2012, 87, 564–573.
- Silva, F. C.; Luciano, C. B. L.; Roosevelt, D. S. B.; Josy, A. O.; Edson, C. S. F. Cellulose – Fundamental Aspects and Current Trends. 2015, doi 10.5772/61343.
- Sreenivasan, V. S.; Somasundaram, S.; Ravindran, D.; Manikandan, V.; Narayanasamy, R. Mat. Design. 2011, 32, 453–61.
- Khalil, A. H. P. S.; Lai, T. K.; Tye, Y. Y.; Paridah, M. T.; Fazita, M. R. N.; Azniwati, A. A.; Dungani, R.; Rizal, S. Fib. Polym. 2018, 19, 423-434.
- Silaban, K.; Chairul; Sembiring, M. P. Jom fteknik. 2015, 2, 1-7.
- Bajpai, P. Elsevier Science. 2012, 97-134.
- Li, L.; Lee, S.; Lee, H. L.; Youn, H. J. BioResources. 2011, 6, 721-736.
- Agnemo, R.; Gellersted, G. Act. Chem. Scand. B. 1979, 33, 337-342.
- Galdeano, M. C.; Grossmann, M. V. E. Brazilian Arch. Biol. Technol. 2005, 48, 63-72.
- Zhao, X. B.; Wang, L.; Liu, D. H. J. Chem. Technol. Biotechnol. 2008, 83, 950–956.
- Dutt, D.; Tyagi, C. H. Indian J. Chem. Technol. 2011, 18, 145151.
- Ai, J.; Tschirner, U. Bioresour. Technol. 2010, 101, 215-21.
- Brindha, D.; Vinodhini, S.; Alarmelumangai, K. Sci. Res. Rep. 2012, 2, 210-219.
- Kassim, A. S. M.; Aripin, A. M.; Ishak, N.; Zainulabidin, M. H.; Zaidel, D. N. .F A. ARPN J. Eng. App. Sci. 2016, 11, 7364-7369.
- Ibrahim, M. M.; Dufresne, A.; El-Zawawy, W. K,; Agblevor, F. A. Carbohydr. Polym. 2010, 81, 811–819.
- Averous, L.; Le Digabel, F. Carbohydr. Polym. 2006, 66, 480-493.
- Khalil, H. S. A.; Alwani, M. S.; Omar, A. K. M. Bioresources. 2007. 1, 220-232.
- Joseph, P.; Joseph, K.; Thomas, S.; Pillai, C.; Prasad, V.; Groeninckx, G.; Sarkissova, M. Compos. Part A Appl. Sci. Manuf. 2003, 34, 253-266.
- Alemdar, A.; Mohini, S. Bioresour Technol. 2008, 99, 1664–1671.
- Przybysz, K.; Malachowska, E.; Martyniak, D.; Boruszewski, P.; Ilowska, J.; Kalinowska, H.; Przybysz, P. Bioresources. 2018, 13, 1372-1387.
- Ghaffar, S. H.; Fan, M. Int. J. Adhes. 2014, 48, 92-101.
- Adel, A, M.; El-Wahab, Z. H. A.; Ibrahim, A.; Al-Shemy, M. T. Carbohydr. Polym. 2011, 83:676–687.
- Soliman, A. S.; Shehata, M. S.; Ahmad, F.; Abdel-Atty, M. Res. J. For. 2017, 11, 19-27.
- Brindha, D.; Vinodhini, S.; Alarmelumangai, K. Sci. Res. Report. 2012, 2, 210-219.
- Nieschlag, H. J.; Nelson, G. H.; Wolff, J. A.; Perdue. Ind.Crops.Prod. 1960,15, 115-122.
- Bektas, I.; Tutus, A.; Eroglu, H. Turk. J. Agri.For. 1999, 23, 589-597.
- Lee, B. M.; Jeun, J. P.; Kang, P. H.; Choi, J. H.; Hong, S. K. Fiber. Polym. 2017, 18, 272-277.
- Ling, Z.; Chen, S.; Zhang, X.; Takabe, K.; Xu, F. Sci. Rep. 2017, 7, 1-11.
- Azeredo, H. M. C.; Mattoso, L. H. C.; Wood, D.; Williams, T.G.; Avena-Bustillos, R. J.; McHugh, T. H. J. Food Sci. 2009, 74, 31-35.
- Jiang, B.; Liu, C.; Zhang, C.; Wang, B.; Wang, Z. Compos. B. Eng. 2007, 38, 24–34.
- Shi, J,; Shi, S. Q.; Barnes, H. M.; Pittman, Jr. C. U. Bioresources, 2011, 6:879–890.

This work is licensed under a Creative Commons Attribution 4.0 International License.
![]()
A New Edition of Web of Science
Journal Impact Factor
2022: 0.5
Five Year: 0.8
Journal is Indexed in

Cabells Whitelist
![]()


