Enhanced Electrical Output by Mixed Surfactant for Solar Cells: EDTA+TB+NaLS+CPC+Tween-80 system
Jagrati Meena1* Suresh Kumar Meena2 and KM Gangotri3
1Department of Chemistry, Janki Devi Bajaj Govt Girls College, Kota, Rajasthan, India.
2Department of Chemistry, Govt College, Kota, Rajasthan, India.
3Department of Chemistry, Jai Narain Vyas University, Jodhpur, Rajasthan 342001, India.
Corresponding Author E-mail: photochemistrylabjnvu@gmail.com
DOI : http://dx.doi.org/10.13005/ojc/400135
Download this article as:
![]()
Enhancing photogalvanics electrical output in the sphere of solar energy is the goal of the study. The use of fossil fuels is also limitation to energy conversion. The photogalvanic (PG)cell with EDTA + TB + NaLS + CPC + Tween-80 produces superior results than a system with just one surfactant. The photopotential (PP) and photocurrent (PC) of the EDTA+TB + NaLS + CPC + Tween-80 photogalvanics were measured at 689.00 mV and 234.00 uA, respectively. The efficiency and performance of the EDTA+TB+NaLS+CPC+Tween-80 photogalvanics were determined to be 0.2811% and 109.00 minutes, respectively. The photogalvanic system with mixed surfactants (NaLS+CPC+Tween-80) is a productive one with improved electrical characteristics. The performance of PG cells can be slightly improved by using individual surfactants as opposed to surfactant combinations. Surfactant combinations with qualities that are superior to those of the individual components can be used in PG cell applications.
KEYWORDS:CPC; Tween-80; NaLS; Photogalvanic;, Storage
Introduction
Photogalvanics were noticed by Rideal and Williams1 and the endergonic photochemical reaction was studied by Rabinowitch2. The growth of PG cells has been successful observed to the research of Suda et al.3, Murthy et al.4, Bayer et al.5 for better results. Different reductants and photosensitizers were used in solar cells by Albery and Archer6, Memming7, Hamdi and Aliwi8, Gangotri and Meena9. Using various micelles, reactants, and dyes, Genwa and Genwa10, Gangotri and Gangotri11, Gangotri and Lal12, Lal and Gangotri13 calculated electrical output for the photogalvanic in solar energy. Lee and Lee14 have additionally noticed dual micellization in cells in order to evaluate their potential. In mixed surfactant solutions15 investigated the relationship between wetting and deterging capacities. Very similar studies16–18 that paid attention to improving the outcomes have been conducted. For the scientific environment, Rathore et al.,19 Mall and Solanki20, and Wu et al.21, innovations for dye reductant surfactant22–23, mixed surfactant24, and effective systems25 were researched. By changing the different parameters in PG cells, the impact of solar energy was investigated. The mixed surfactants have experimentally demonstrated the effective system as the desired target of research with particular reference to improving electrical output and solar energy storage, based ecofriendly nature for the aforementioned acquired values26. Comparatively better result in PG cell is novelty of work and limitation of system is obtained result are still not enough for sustainable development.
Research on the interactions between surfactants and dye molecules has been made possible by the characteristics of surfactant mixtures. The propensity of various surfactants to form aggregated formations varies. Micelles, precipitate, and monolayers are a few examples of these aggregates. The propensity to generate aggregated formations in solutions containing combinations of surfactants might vary significantly from solutions containing simply the individual surfactants. In PG cells, the surfactant combination may lead to better precipitation than the individual precipitate of a single surfactant. For mixes, different components may have different propensities to disperse themselves between the unaggregated state and an aggregate. As a result, the composition of a micelle’s three surfactants may be very different from the equilibrium composition of a single surfactant monomer. The processes of interest might merely be reliant on collect or monomers content. For instance, the composition and concentration of the surfactant affects the way it binds to dyes like toluidine blue, and the composition of the micellar solution affects how well the dye dissolves in it. Enhancing electrical output in terms of current and potential was the study’s goal. The obtained results are compared with previous literature in the table format and explained how it differed from others (Table 6).
Experimental Method
Preparation of solutions
In distilled water, solutions of EDTA, TB, NaLS, CPC, and Tween-80 were prepared. These solutions are kept in glass containers with filter paper on top. For the experiment’s electrical measurements, 25 ml of EDTA, TB, NaLS, CPC, and Tween-80 were used. In the experimental, the solutions concentration of 2×10⁻³ M EDTA, 4×10⁻⁵ M TB, 6.40× 10⁻³ M NaLS, 8.94× 10⁻⁴ M CPC, and 9.00× 10⁻³ M Tween-80 were used.
Experiment set –up
Designed photogalvanic system (figure 1) and developed two-arm, H-shaped glass tubes. One arm received a dip of a saturated calomel electrode (SCE), and the other received a dip of a platinum electrode (PT). By employing a carbon pot, a digital pH meter, a resistance key, a micro-ammeter, and a function key, both SCE and PT were connected to the cell circuit. For the experimental stage, 25 ml solutions of the three surfactants NaLS+CPC+Tween-80 (mixed surfactants), EDTA (reductant), toluidine blue (photosensitizer), sodium hydroxide, and distilled water were utilized. Out of 25 ml of solutions, 2 ml were used for sodium hydroxide, 2 ml for sodium sulfate, 3 ml for CPC, 3 ml for Tween-80 (combined surfactants are 8 ml), 7 ml for EDTA, 6 ml for toluidine blue, 2 ml for sodium sulfate, and 2 ml for sodium hydroxide. A 200 W electric bulb was utilized as an artificial light source to measure the current-potential. The chemicals used in the PG cell are tabulated in Table 5.
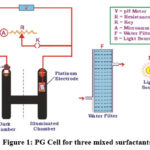 |
Figure 1: PG Cell for three mixed surfactants |
Results and Discussion
Variations in toluidine blue concentration and their effects
Toluidine blue concentration increases initially, increasing electrical values (potential and current), achieving the maximum values (optimum values), and then decreasing in EDTA+TB+NaLS+CPC+Tween-80 photogalvanics. Table 1 and Figure 2 show the photosensitizer concentration variation in the EDTA+TB+NaLS+CPC+Tween-80 system.
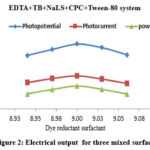 |
Figure 2: Electrical output for three mixed surfactants. |
Variations in EDTA concentration and their effects
As the concentration of EDTA is increased, electrical values (potential and current) initially rise to their maximum levels (optimum values), after which the EDTA+TB+NaLS+CPC+Tween-80 photogalvanics experience reductions. Table 1 and Figures 2, 3, and 4 show the fluctuation in EDTA concentration on the EDTA+TB+NaLS+CPC+Tween-80 photogalvanics.
Effect of variation of (NaLS+CPC+Tween-80) concentration
Electrical values (potential and current) increase initially in response to an increase in NaLS concentration (CPC+Tween-80 concentration will remain constant), then again in response to an increase in CPC concentration (NaLS + Tween-80 concentration remains constant), and so on. The electrical values in EDTA+TB+NaLS+CPC+Tween-80 photogalvanics drop after optimal values (maximum value) and on further concentration rise. Table 1 and Figures 2, 3, and 4 show the fluctuation in EDTA concentration on the EDTA+TB+NaLS+CPC+Tween-80 photogalvanics.
Table 1: EDTA+TB+NaLS+CPC+Tween-80 (Variation of the three surfactants).
|
Light Intensity = 10.4 mWcm-2, pt electrode=1cm x 1cm, Temperature = 303 K |
|||
|
Parameters |
Photopotential (mV) |
Photocurrent (mA) |
Power (µW) |
|
[TB] ×10-5 M |
|||
|
4.00 |
689.00 |
234.00 |
161.11 |
|
[EDTA] × 10-3 M |
|||
|
2.00 |
689.00 |
234.00 |
161.11 |
|
[NaLS] × 10-3 M |
|||
|
6.40 |
690.00 |
234.00 |
161.11 |
|
[CPC] × 10-4 M |
|||
|
8.94 |
689.00 |
234.00 |
161.11 |
|
[Tween -80] × 10-3 M |
|||
|
9.00 |
689.00 |
234.00 |
161.11 |
|
PH |
|||
|
12.77 |
689.00 |
234.00 |
161.11 |
Effects of pH changes
Electrical values (potential and current) initially grow with increasing alkaline nature to reach the maximum value, and then fall in EDTA+TB+NaLS+CPC+Tween-80 photogalvanics. Table 1 reports the PH Variation on the photogalvanics of EDTA+TB+NaLS+CPC+Tween-80.
Effect of variation of diffusion length
As the diffusion length is extended, electrical values (potential and current) initially rise to their maximum levels and then fall in the EDTA+TB+NaLS+CPC+Tween-80 photogalvanics. Table 1 and Figure 2 report the variation in diffusion length on the EDTA+TB+NaLS+CPC+Tween-80 photogalvanics.
Table 2: Indicates that the diffusion lengths (DL)of the three substances vary
|
Light Intensity = 10.4 mWcm-2, pt electrode=1cm x 1cm, Temperature = 303K |
|||
|
DL (mm) |
Maximum photocurrent imax (mA) |
Equilibrium photocurrent ieq (mA) |
Initial photocurrent generation rate (mA min-1) |
|
45.0 |
265.0 |
234.0 |
7.4 |
|
50.0 |
274.0 |
229.0 |
7.5 |
|
55.0 |
279.0 |
223.0 |
7.4 |
Effects of Modifying the PG Cell’s Electrode Area
The electrical values of the PG cell rise together with the electrode area, reaching their maximum value at an electrode area of 1 cm x 1 cm. after which the EDTA+TB+NaLS+CPC+Tween-80 system declines. Table 1 and Figures 2, 3, and 4 show the variation in electrode area of the cell on the EDTA+TB+NaLS+CPC+Tween-80 photogalvanics.
Table 3: Empact of electrode area on the three surfactants.
|
Light Intensity = 10.4 mWcm-2, pt electrode=1cm x 1cm, Temperature = 303K |
|||||
|
EDTA+TB+NaLS+CPC+Tween-80 photogalvanics |
Electrode Area (cm2) |
||||
|
0.70 |
0.85 |
1.00 |
1.15 |
1.30 |
|
|
Maximum photocurrent imax (mA) |
261 |
261 |
274 |
276 |
281 |
|
Equilibrium photocurrent ieq (mA) |
242 |
234 |
234 |
232 |
226 |
Current–voltage characteristics ( (i-V)) of the PG cell
(Gangotri and Lal, 2013; Lal and Gangotri, 2022; Lal and Gangotri, 2013; Bhimwal et al., 2013; Rathore J, et al., 2022) used the formula to get the fill-factor.

Where
Vpp stands for cell potential
ipp stands for “power point current of cell
Voc stands for a cell’s open circuit voltage
Isc stands for short circuit current
Conversion efficiency and Cell performance
A formula was used to determine the conversion efficiency (CF) (Gangotri and Lal, 2013; Lal and Gangotri, 2022; Lal and Gangotri, 2013; Bhimwal et al., 2013; Rathore J, et al., 2022).

Where Vpp, is the cell’s power point photopotential, ipp, its power point photocurrent, and A, its electrode area.
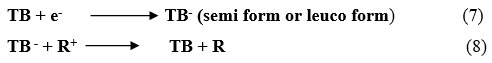
In order to get better results, the PG cell’s performance is reported (Figure 3). In terms of t1/2, its achieved value was 109.00 minutes in the absence of light (Figure 4). For the EDTA+TB+NaLS+CPC+Tween-80 system, all electrical output findings were recorded (Table 4 and Figure 4).
Photochemical Reaction Mechanism
At illuminate Chamber
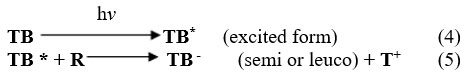
At platinum electrode

At dark Chamber
TB stands for toluidine blue, TB* for its excited form, TB- for its semi- or leuco form, R for EDTA, and R+ for its oxidized form.
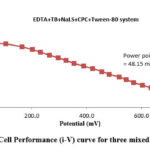 |
Figure 3: Cell Performance (i-V) curve for three mixed surfactants |
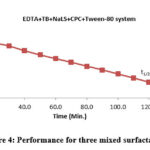 |
Figure 4: Performance for three mixed surfactants. |
Table 4: Comparative study on three surfactants [NaLS+CPC+TWEEN-80] for solar cell.
|
S.No. |
Objectional parameter |
Single surfactant NaLS |
Mixed surfactant NaLS+CPC+Tween-80 |
|
1 |
Photopotential (DV) |
635.00 mV |
689.00 mV |
|
2 |
Maximum Photocurrent (imax) |
175.00 mA |
274.00 mA |
|
3 |
Short Circuit Current (isc) |
90.00 mA |
234.00 mA |
|
4 |
Equilibrium Photocurrent (ieq) |
90.00 mA |
234.00 mA |
|
5 |
Current at Power Point (ipp) |
55.00 mA |
129.00 mA |
|
6 |
Power at Power Point (PP) |
32.72 mW |
54.13 mW |
|
7 |
Fill factor (h) |
0.3630 |
0.2811 |
|
8 |
Conversion Efficiency (%) |
0.3100% |
0.5477 % |
|
9 |
t1/2 |
55.0 min |
109.0 min |
|
10 |
Charging Time (min.) |
55.0 min |
103.0 min |
|
11 |
Open Circuit Voltage (VOC) |
870.00 mV |
897.00 mV |
|
12 |
Potential at Power Point (Vpp) |
595.00 mV |
453.00 mV |
Table 5: Materials used for Electrical Output by Mixed Surfactant for EDTA+ TB+ NaLS+CPC+ Tween-80 system.
|
S. No. |
Chemical |
Specification |
|
1 |
EDTA |
E Merk. Bombay, India |
|
2 |
TB |
Sigma Aldrich Chemicals Private Limited |
|
3 |
Sodium Hydroxide (AR) |
Sarabhai M. Chemicals, Baroda, India |
|
4 |
NaLS |
Loba Chemie Pvt. Ltd, Mumbai |
|
5 |
CPC |
E Merk. Bombay, India |
|
6 |
Tween -80 |
Sigma Aldrich Chemicals Private Limited |
|
7 |
Diamino benzoic Acid |
S.D Fine chem. Pvt. Ltd. Boisar |
Table 6: Comparation with previous literature and explanation.
|
System Name |
Results: |
References |
|
NaLS+CTAB+MB+Xylose |
PP 655.0 mV, PC 190.0 μA |
Gangotri and Mohan, 2013 |
|
NaLS+Tween-80+MB+ Xylose |
PP 645.0 mV, PC 210.0 μA |
Lal and Gangotri, 2013 |
|
DSS+Tatrazine +EDTA |
PP 493.0 mV, PC 130.0 μA |
Rathore and Mohan, 2018 |
|
LG + Tartrazine+ D-fructose |
PP 1130.0 mV, PC 385.0 μA |
Jayshree et al. 2022 |
|
Innovation for prospective energy source through solar cell |
PP 684.0 mV, PC 230.0 μA |
Mohan and Gangotri, 2022 |
|
D-Xylose+MB+Brij-35 + NaLS |
Cell performance 120.00 minutes and efficiency 0.2812% |
Lal and Gangotri, 2022 |
|
Innovative study in renewable energy source through mixed surfactant system for eco‑friendly environment |
Photocurrent 243.0 uA and efficiency 0.6769% (Recent research work) |
Lal, M.; Gangotri, KM., Environ Sci Pollut Res., 2023, 30(44),98805–98813. https://doi.org/10.1007/s11356-023-28246-w |
Conclusion
The electrical characteristics of the PG cell as well as the performance of the PG cell system have been enhanced by the PG cells using the EDTA+TB+NaLS+CPC+Tween-80 system. Due to their low concentration, these PG cells were crucial in the development of the solar energy industry and the financial viability of non-polluting nature in a green environment. In terms of electrical outputs and potential electromagnetic radiation transformation, the PG cells may be a better fuel cell. The outcomes are wholly in favor of global sustainable development. The photopotential for EDTA+TB+NaLS+CPC+Tween-80 was measured at 689.00 mV. These results, which evaluate three surfactant systems, are far better than recently published data. The photocurrent in EDTA+TB+NaLS+CPC+Tween-80 was measured at 234.00 A. The performance of the EDTA+TB+NaLS+CPC+Tween-80 Cell was estimated to be 109.00 minutes in the dark. The results were included to the solar energy section of the scientific facts.
Acknowledgement
For laboratory space used during study, the authors are grateful to the chemistry department of JNV University in Jodhpur, Rajasthan, INDIA.
Conflicts of Interest
There are no conflicts of interest for authors.
References
- Rideal, EK.; Williams, EG., J. Chem. Soc. Trans., 1925,127,258-269.
CrossRef - Rabinowitch, E., J. Chem. Phy., 1940,8(7),551-559.
CrossRef - Suda, Y.; Shimoura, Y.; Sakata, T.; Tsubomura, H., J. Phy. Chem., 1978, 82,268-271.
CrossRef - Murthy, ASN.; Dak, AC.; Reddy, KS., Int. J. Energy Res., 1980,4,339-343.
CrossRef - Bayer, LS.; Erogle, I.; Turker, L., Int. J. Energy Res., 2001,25,207-222.
CrossRef - Albery, WJ.; Archer, MD., Nature, 1977,270,399-402.
CrossRef - Memming, R., Electrochimia Acta., 1980, 25,77-88.
CrossRef - Hamdi, ST.; Aliwi, SM., Chemical Monthly, 1996,127,339-346.
CrossRef - Gangotri, KM.; Meena, RC., J. Photochem. Photobio. A: Chem., 2001,141,175-177.
CrossRef - Genwa, KR.; Genwa, M., Solar Energy Mat. Solar Cells, 2008,92,522-529.
CrossRef - Gangotri, P.; Gangotri, KM., Int. J. Energy Res., 2010,34,1155-1163.
CrossRef - Gangotri, KM.; Lal, Mohan., Res. J. Chem. Sci., 2013,3,20-25.
- Lal, M.; Gangotri, KM.; Res. J. Recent Sci., 2013,2,76-81.
- Lee, NM.; Lee, BH., J. Kor Chem. Soc., 2012, 56,556-562.
CrossRef - Lal, M.; Gangotri, KM., Res. J. Recent Sci., 2013,2(12),19-27.
- Cristian, C., Juana, J.; Silber, Chem. Phys Chem., 2014,15, 2873-3132.
- Rami, A.; Abdel, M.; Altwaiq, S.; Zaben, M., J. Surf. Deter., 2015,19,353-362
CrossRef - Jinxia, J.; Wu, Zhang.; Yang, X.; Ha, Peter L., Int. J. Energy, 2016, 40,806-813
- Rathore, J.; Mohan, L., Res. J. chem. environt., 2018,06, 53-57.
- Mall, C., Solanki, PP., Energy Reports. 2018,4,23-30
CrossRef - Wu, T.; Qin, Z.; Wang, Y., Nano-Micro Letters, 2021,13,152.
CrossRef - Jayshree, R.; Arya, RK.; Pratibha, S.; Mohan, L., Res. J. Chem. Environ., 2022, 26(06), 24-29.
CrossRef - Jayshree, R.; Arya, RK.; Pratibha, S.; Mohan, L., Ind. J. Sci. Tech, 2022, 15(23),1159-1165.
- Mohan, L.; Gangotri, KM., J. Solar Energy Res., 2022, 7(3),1095-1103.
- Lal, M.; Gangotri, KM., Int J. Energy Res., 2022, 46(14),19538-19547.
CrossRef - Lal, M.; Gangotri, KM., Environ Sci Pollut Res., 2023, 30(44),98805–98813.
CrossRef
Accepted on: 18 Jan 2024
Second Review by: B. K Sharma
Final Approval by: Dr. Mohammad Tawkir Sheikh


![]()


