Green Synthesis and Characterization of Iron Oxide Nanoparticles Using Phyllanthus Niruri Extract
 and Ananthu A. Prem
Department of Chemistry, University College, Trivandrum-695034, India.
Corresponding Author E-mail: vgviju@gmail.com
DOI : http://dx.doi.org/10.13005/ojc/340547
Download this article as:
![]()
Studies on green synthesis of nanoparticles moves forward a lot on these days. The present work involves the green method of synthesizing iron oxide nanoparticle from Phyllanthus niruri leaf extract. Furthermore, the green synthesized iron oxide nanoparticles were characterized and its antimicrobial activity was investigated. A characteristic comparison with chemical method of synthesis is also done, for iron nanoparticles. The characterization of nanoparticle includes the IR, UV-Vis, surface morphology and size determination using TEM, SEM, and XRD. The analytical studies revealed that the synthesized iron oxide nanoparticles from these two different methods have almost identical size and morphology. The synthesized iron oxide nanoparticles showed significant antimicrobial activity against the microbes, E. coli and P. aeroginosa. The studies concluded that the synthesis of iron oxide nanoparticles using plant extracts is more beneficial as it is an economical, energy efficient, low cost and environment-friendly process than the bio hazardous chemical synthesis. The present investigation may be a definite contribution to green chemistry in general and nano synthesis in particular.
KEYWORDS:Agar- Well Diffusion Method; Green Synthesis; Iron Oxide Nanoparticle; Phyllanthus Niruri
Introduction
In a broad sense, the term biosynthesis includes a wide range of possible applications from nanotechnology enabled, environmentally friendly manufacturing processes that reduce waste products; the use of nanomaterials as catalysts for greater efficiency of current manufacturing processes by minimizing or eliminating the use of toxic materials1; the use of nanomaterials and nanodevices to reduce pollution; and the use of nanomaterials for more efficient alternative energy production. Biosynthesis of nanoparticles is a kind of bottom-up approach where the main reaction occurring is reduction or oxidation. The important reducing agents like citric acid, ascorbic acid, flavonoids, reductases, dehydrogenases and extracellular electron shuttlers present in microbial enzymes and plant extracts, play an important role in biosynthesis of metal nanoparticles.2 They play important roles in both stabilization and reduction of nanoparticles. Green synthesis provides advantages over chemical and physical method as it is cost effective, environment-friendly, easily scaled up for large scale synthesis and in this method there is no need to use high pressure, energy, temperature or toxic chemicals.3
Phyllanthus niruri is an important plant of Indian Ayurveda. It is a herb of the EUPHORBIACEAE family. The active phytochemicals, flavonoids, alkaloids, terpenoids, lignans, polyphenols, tannins, coumarins and saponins, have been identified from various parts of P. niruri. Extracts of this herb have been proven to have therapeutic effects in many clinical studies.4 The plant is of medicinal importance for numerous ailments like dysentery, influenza, vaginitis, tumors, diabetes, diuretics, jaundice, kidney stone, dyspepsia, antihepatotoxic, antihepatitis-B, antihyperglycemic and also as antiviral and antibacterial.5 It is known for a variety of uses viz. hepatoprotective action, lipid lowering action, antidiabetic action, and antifungal action to name a few.6-7
Iron oxide (IO) nanoparticles consist of hematite or magnetite particles with diameters ranging from 1 and 100 nanometer and find applications in magnetic data storage, biosensing, drug-delivery etc.2
Materials and Methods
Material used are (NH4)2Fe(SO4)2.6H2O, NH4Fe(SO4)2.12H2O, NaOH, FeCl3, anhydrous FeSO4 and trisodium citrate (Na3C6H5O7). All are AR grade reagents.
Fresh Phyllanthus niruri collected from nearby localities. It was used as the reducing agent in green synthesis.8 De-ionized as well as double distilled water were used for making solutions and leaf extract.
Preparation Of Phyllanthus Niruri Leaf Extract
Freshly collected leafs of Phyllanthus niruri, were cleaned under running water and then washed with de-ionized water. The leaf were separated from the stem, and the fruit under the leaf are also removed carefully. About 25g of cleaned leaf was boiled with 100ml of distilled water, in a water bath for 2 hours. The extract is then filtered through a Whatman No: 1 filter paper and used for further experiments.
Preparation of Fe3+ – Fe2+ Mixture
9.6516g of ammonium iron(III) sulphate dodecahydrate was dissolved in 100mL de-ionized water and 3.9213g of ammonium iron(II) sulphate hexahydrate in 100mL de-ionized water separately, so as to get 0.2 M solution of Fe(III) and 0.1 M solution of Fe(II). 5mL of both the solutions were mixed together to get the iron salt mixture in 1:2 ratio. Similarly four different ratios of solutions (1:2, 1:3, 1:5, and 2:3) were prepared.
Preparation of Iron Oxide Nanoparticles using Green Method
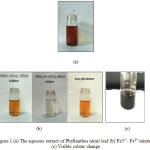 |
Figure 1:(a) The aqueous extract of Phyllanthus niruri leaf (b) Fe3+ – Fe2+ mixture. (c) Visible colour change. Click here to View figure |
Optimum synthesis was done by adding the leaf extract (1.2 mL) to 10mL iron salts mixtures [ mixture of 0.2 M (NH4)2 Fe (SO4)2.6H2O and 0.1 M NH4 Fe (SO4)2.12H2O] in 1:2 ratio (and also tried in 1:3, 1:5, 2:3 ratios). The reaction was maintained for 30 min at 300C, under stirring. For the conversion of excess iron species into Fe3O4, 1N NaOH was added, and stirring continued for 15 minutes. The reddish yellow colour of extract were changed to black, indicating the formation of iron oxide nanoparticles9-11. The product was separated out by magnetic separation. Then washed with alcohol, and dried in an air oven. The well characterization of colour change and precipitate was given by the 1:2 ratio. The green synthesized iron oxide nanoparticles and its precursors are shown in Fig 1.
Preparation of iron oxide nanoparticles using chemical method
0.973g of FeCl3 and 1.39g of anhydrous FeSO4 were mixed and dissolved in 40mL of distilled water, 5mL of NH3 solution was added and stirred at 900C in magnetic stirrer. 4.4g of trisodium citrate was added to it and stirring continued for 30 minutes. The precipitate is washed with ethanol and separated by using magnetic separation technique, and dried.12
Here different salts of iron were used to get better yield and better quality nanoparticles.
Results and Discussion
UV-Vis analysis is one of the most important characterization method to study nanoparticles. The surface plasmon resonances (SPR) of synthesized iron oxide nanoparticles have been studied by UV-Vis Perkin Elmer Lambda 25 Spectrophotometer. The absorption of visible radiations due to the excitation of SPR, imparts various colours to nanoparticles. As the nanoparticles size changes, colour of the solution also changes.13,14 So UV-Vis absorption spectrum is quite sensitive to the formation of nanoparticles.
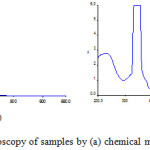 |
Figure 2: UV-Vis spectroscopy of samples by (a) chemical method (b) Green method. |
Both the nanoparticle samples (chemical and green method) are subjected to UV-Vis study. Fig. 2 shows the UV-Vis spectrum of both the samples. The nanoparticles synthesized by both methods shows maximum absorption at 330nm to 360nm. The nanoparticles synthesized by green method shows maximum peak in 330-355nm range. Chemically synthesized nanoparticles shows an absorption in the range of 330-345nm. The spectra recorded for the samples synthesized by green method also shows an absorption band in the range of 330-400 nm, in addition to a small band around 400-450 nm that can be due the components present in the plants. (Typical plasmon resonance band of iron oxide nanoparticles).
The prepared iron oxide nanoparticles were subjected to FT-IR spectroscopy measurements. It was recorded by using a Perking Elmer, spectrometer in the range 400-4000 cm-1. It was used to identify the possible biomolecules responsible for the reduction and capping of the nanoparticles. The IR spectrum of green synthesized nanoparticle is shown in Fig 3.
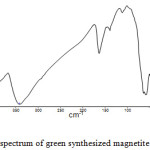 |
Figure 3: IR spectrum of green synthesized magnetite nanoparticle. |
In IR spectrum of green synthesized nanoparticle, an absorption bands around 3442.84cm−1, which are characteristic stretching vibration of hydroxyl functional group (O-H) on the surface of nanoparticles or adsorbed water in the sample.15 The stretching vibration of the carboxylate group (C=O) is observed around 1391.95 cm−1. The stretching vibration of C=C group also localized at 1632.95 cm−1. The absorption band around 1113.72 cm−1 is assigned the stretching vibration of C-O group. The above observed FT-IR spectra confirm the presence of organic impurities in the sample during the preparation. The IR spectrum shows a peek at 583.02 cm-1, which, corresponding to the Fe-O stretching band of magnetite (Fe3O4). The formation of Fe3O4-NPs was confirmed with these characteristic peaks as the peaks laying in the region between 400 and 600 cm−1 were corresponding to Fe3O4.16
Scanning electron microscopy is used to obtain information on surface morphology. The size and the morphology of the synthesized nano particles were confirmed by employing the technique. The samples synthesized from both the methods are subjected to SEM analysis on the Nova NanoSEM 450 SE Microscope in University of Kerala, Thiruvananthapuram.
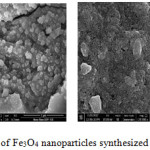 |
Figure 4: SEM images of Fe3O4 nanoparticles synthesized from chemical method. |
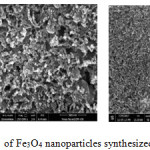 |
Figure 5: SEM images of Fe3O4 nanoparticles synthesized from green method. |
The SEM image of two samples are shown in Fig 4 and Fig 5. From the SEM results, the prepared crystallites are nearly square in shape and it can be seen that the particles agglomeration, indicating a good connectivity between the grains together and the size of which is about 60-500 nm. The nanoparticles were agglomerated in few µm. The agglomeration was reduced with increase in grain growth.17
From SEM results it is clear that the nanoparticles synthesized by both the methods are square shaped. But the chemically synthesized iron oxide nanoparticles are more clearly separated particles. They can be well distinguished. In other hand the green method adopted synthesized particles are seems to be more sticky, and having an aggregated form.
The sample of nanoparticles synthesized has subjected to TEM analysis. The Transmission Electron Microscopic analysis was done on PHILIPS TEM CM 200 machine from SAIF IIT Bombay. The TEM image of green synthesized iron nanoparticles is shown in Fig.6. It illustrates the aggregation of nanoparticles and the particles are nearly square shaped and are almost uniform in size. The size of the particles are around 10nm or less and 80% of the particles has size around 10nm. Thus the particles formed is in nano scale.18
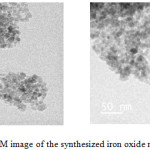 |
Figure 6: TEM image of the synthesized iron oxide nanoparticles. |
The samples prepared were subjected to X-ray Diffraction studies. Fig. 7 shows the XRD pattern of green synthesized Fe3O4 nanoparticles. The diffractions peaks could be indexed as that of cubic structure of Fe3O4 phase having lattice parameter a=8.39Å. The particles size was calculated from the XRD data using Scherrer’s equation19.
![]()
D is the average particle size, k is the grain shape factor taken as unity contemplating, λ wavelength of the Cu-Kα irradiation, β the full width at half maximum intensity of the diffraction peak and θ is the Bragg’s angle. The particle size calculated using Scherrer’s equation was found to be 15 nm.20
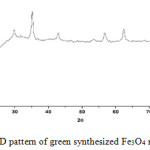 |
Figure 7: XRD pattern of green synthesized Fe3O4 nanoparticles. |
The green synthesized iron oxide nanoparticles, distinct peaks were found at 32.11, 35.89, 43.65, 56.88, 62.97° accounting for crystal planes (220), (311), (400), (510), and (440) respectively. All of the diffraction peaks can be indexed to the magnetite structure phase of iron oxide by comparison with the data from JCPDS card (77-1545) 16 and no characteristic peaks were observed other than Fe3O4. Fig.7 shows the XRD pattern of synthesized Fe3O4 nanoparticles16. The determined particle size came out to be with in the nanometer range.
The activities of green synthesized iron oxide nanoparticles against the microbes are studied using agar- well diffusion method. From this we find the microbial repelling nature of our sample.21
The antimicrobials present in the samples are allowed to diffuse out into the medium and interact in a plate freshly seeded with the test organisms. The resulting zones of inhibition will be uniformly circular as there will be a confluent lawn of growth.22 The diameter of zone of inhibition can be measured in centimeters. Petriplates containing 20ml Muller Hinton Agar Medium were seeded with bacterial culture of E. coli and P. aeroginosa (growth of culture adjusted according to McFards Standard, 0.5%). Wells of approximately 10mm was bored using a well cutter and different concentrations of sample such as 25μg/mL, 50μg/mL, and 100μg/mL were added. The plates were then incubated at 37°C for 24 hours. The antibacterial activity was assayed by measuring the diameter of the inhibition zone formed around the well Streptomycin was used as a positive control.23 Table 1 shows the antibacterial activity test result of green synthesized Fe3O4.
Iron oxide nanoparticle have its own repelling nature against microbial. The reason for the bactericidal activity is due to the presence of reactive oxygen species generated by different nanoparticles.24 Chemical interaction between the chemical produced in the presence of Fe3O4 nanoparticles and the outer bilayer of bacteria could be the reason for the antibacterial activity of Fe3O4.25
Table 1: Antibacterial activity of Fe3O4
|
Concentration (μg/mL) |
Zone of inhibition (cm) |
|
|
E. coli |
P. aeroginosa |
|
|
Streptomycin |
2.6 |
2.7 |
|
250 |
0.1 |
0.2 |
|
500 |
0.5 |
0.6 |
|
1000 |
1.3 |
1.5 |
The antibacterial activity was assayed by measuring the diameter of the inhibition zone formed around the well Streptomycin was used as a positive control. The present study proves that Fe3O4 shows the relevant antibacterial activity against P. aeroginosa and E.coli.
Conclusion
The synthesis of iron oxide nanoparticles by two different methods viz., a green method and a conventional chemical method was described in present investigation. A comparison of these two methods are also conducted to demonstrate the importance of environment-friendly preparation of nanoparticles. By adopting this biological method it was possible to conduct the synthesis in a simple and environment-friendly manner when compared to chemical methods. The study has demonstrated that iron oxide nanoparticles could be prepared by making use of aqueous Phyllanthus Niruri leaf extract. The IR, UV-VIS, TEM, SEM, XRD studies, revealed that the synthesized iron oxide nanoparticles from these two different methods have almost identical size and morphology. More studies need to be done to identify the phytochemical constituent of plant which helps to reduce the metal into its nano form. The particles showed significant antimicrobial activity against the microbes, E.coli and P. aeroginosa.
The studies concluded that the synthesis of iron oxide nanoparticles using plant extracts is more beneficial as it is an economical, energy efficient, low cost and environment-friendly process than the bio hazardous chemical synthesis. The present investigation may be a definite contribution to green chemistry in general and nano synthesis in particular.
Aknowledgement
Authors are thankful to the Department of Chemistry, University College, Trivandrum for providing facilities and SAIF IIT Bombay for the TEM studies.
Conflict of Interest
Authors have no conflict of interest including any financial, personal or other relationships with other people or organizations that can influence their work.
References
- Geoffrey, A. O.; Andre, C. A.; Ludovico, C. Nanochemistry: A chemical approach to Nanomaterials. RSC Publishing. 2008, 2, 10-13.
- Pandey, S; Oza, G.; Mewada, A.; Sharon, M. Arch. Appl. Sci. Res. 2012, 4,1135-1141
- A. A, Haleemkhan.; Naseem.; B, Vidya Vardhini. Int. J. Mod. Chem. Appl. Sci. 2015, 2(3), 195-203.
- MatsuuraSubeki, H., Takahashi, K., Kobayashi, S., Trimurningsih. C. J Nat. Prod. 2005, 68(4), 537539.
- Ivan, A. Ross. Medicinal Plants of the World. Chemical Constituents Traditional and Modern Medicinal Uses. Humana Press, New York. 2003, 2(1), 393 -395.
- Paithankar, V.V.; Raut, K.S.; Charde, R.M.; Vyas, J.V. Phyllanthus Niruri: A magic Herb. Research in Pharmacy. 2011, 1(4), 1-9.
- Campbell, N.A.; Reece, J.B.; Urry, L.A.; Cain, M.L.; Wasserman, S.A.; Minorsky, P.V.; Jackson, R.B. Biology. Pearson Education Inc., Pearson Benjamin Cummings Company, San Francisco, California, USA.2008, 8,998.
- Monaliben, S.; Derek, F.; Shashi, S.; SurajKumar T.; Gerrard, E. Jai. Materials. 2015, 8, 7278-7308.
- Poedji, L. H.; Muhammad, F.; Ridwan, M.; Dedi, S. IJESD. 2013, 4, 336-340.
- Sadia, S.; Arifa, T.; Yongsheng, C. Nanomaterials. 2016, 6, 209.
CrossRef - Faranak, A.; Reza, S. J Fundam Appl Sci. 2015, 5 (S3), 2056-2058.
- Shazia Parveen.; Abdul Hamid,; Wani.; Mohammad Ashraf Shah.; Henam Sylvi Devi.; Mohd Yaqu Bhata.; Jahangir Abdullah Koka. Microb Pathog. 2018, 115, 287-292.
CrossRef - Breck, W. M. Nanotechnology. CBS Publishers & Distributers Pvt Ltd. 2016, 2, 35.
- Bhosale, R.R.; Kulkarni, A.S.; Gilda, S.S.; Alorkar, N.H.; Osmani, R.A.; Harkare, B.R. Int. J. Pharm. Sci. Nanotech. 2014, 7, 2330.
- Arbara, H. Stuart. Infrared spectroscopy: Fundamentals and Applications. John Wiley & Sons, Ltd. 2004, 45-111.
- Yuvakkumar, R.; Hong, S.I. Advanced Materials Research. 1051. Trans Tech Publications, Switzerland. 2014, 39-42.
- Vladimir, A. Basiuk.; Elena, V. Basiuk. Green processes for nanotechnology: Inorganic to Bioinspired Nanomaterials. Springer International Publishing Switzerland. 2015, 99-100.
- Mohammed, M, Rahman.; Sher Bahadar Khan.; Aslam Jamal.; Mohd Faisal.; Abdullah, M, Aisiri. Nanomaterials InTech. 2011, 43-66.
- H.El Ghandoor.; H. M, Zidan.; Mostafa, M.H. Khalil.; M. I. M. Ismail. Int. J. Electrochem. Sci. 2012, 7, 5734–5745.
- N, Latha.; M, Gowri. Int J Sci Res. 2015, 2319-7064.
- Pantidos, N.; Horsfall, L.E. J Nanomed Nanotechnol. 2014, 5, 233.
CrossRef - Raid, A. Ismail.; Ghassan, M, Sulaiman.; Safa, A, Abdulrahman.; Thorria, R, Marzoog. Mater Sci Eng C. 2015, 53(1), 286-297.
- Perez, C.; Pauli, M.; Bazerque, P. Acta Biol Med Exp, 1990, 15, 113-115.
- Mystrioti, C.; Xenidis, A.; Papassiopi, N. Journal of Geoscience and Environment Protection. 2014, 2, 28-36.
CrossRef - Morteza Mahmoudi.; Sophie Laurent. Iron Oxide Nanoparticles for Biomedical Applications Synthesis, Functionalization and Application .Elsevier Ltd. 2018, 43-88.
Accepted on: 02-10-2018


![]()


