Proteins Level in Sera and Saliva of Type2 Diabetic Iraqi Patients with and Without Proliferative Diabetic Retinopathy
1Department of Chemistry, College of Science, University of Baghdad, Baghdad, Iraq.
2Department of Biotechnology, College of Science, University of Baghdad, Baghdad, Iraq.
Corresponding Author E-mail: hathamahasan@scbaghdad.com
DOI : http://dx.doi.org/10.13005/ojc/330610
Download this article as:
![]()
Proteins play a central role in cell structure and function. The present study aimed to measure the changes in total protein [TP], albumin [A], globulin [G], and [A]/ [G] ratio in sera and saliva samples of type2 diabetic patients with and without proliferative diabetic retinopathy (PDR). Meanwhile agarose electrophoresis was used to confirm such changes. Also it aimed to look for the possibility of using saliva as an alternative sample to serum as a diagnostic fluid. The results indicated that a significant increase was observed in serum [G], salivary [TP], [A], and [A]/ [G] ratio, p =0.000, p=0.041, p=0.04, p=0.001 respectively, while there was a significant decrease in serum [A]/ [G] ratio p=0.000 in patients without PDR compared to healthy control. Also, the results showed that there was a significant increase in serum [G], salivary [TP], [A], [G] and [A]/[G] ratio, p =0.000, p=0.000, p=0.000, p=0.000, p=0.037 respectively, while a significant decrease in serum [A]/[G] ratio p=0.000 was observed in patients with PDR compared to patients without PDR. Sera and salivary agarose gel electrophoresis fractionation indicated an increase in [TP] and [G], but the changes were more obvious in the levels of gamma globulin fractions where the higher values were noticed in the patients group with PDR. Sera [A] were slightly decreased while salivary [A] was slightly increased. The most obvious finding was the existence of a positive correlation between the changes in [TP], [A] and [G] of serum and saliva in all studied groups.
KEYWORDS:Total protein; Albumin; Globulin; Agarose electrophoresis; Proliferative diabetic retinopathy (PDR)
Introduction
Diabetic retinopathy (DR), a major microvascular complication of diabetes, has a significant impact on the world’s health systems 1. In patients with diabetes, the global prevalence of any DR is 34.6% and 1 in 10 have sight-threatening DR (STDR), which commonly includes severe nonproliferative (NPDR), proliferative DR (PDR) and diabetic macular edema (DMO) 2. Proliferative diabetic retinopathy (PDR) is a developed form of retinopathy which is a severe and common complication of diabetes mellitus (DM), and patients with PDR may develop advanced visual impairment 3. Globally, the number of people with PDR is expect to grow from 126.6 million in 2010 to 191.0 million by 2030, and it is estimated that the number with vision-threatening diabetic retinopathy will increase from 37.3 million to 56.3 million if prompt action is not taken. Lack of early diagnosis and management is the leading cause of blindness in working-age populations 1.
Proliferative diabetic retinopathy is an advanced stage of diabetic retinopathy in which a major micro vascular complication of uncontrolled diabetic mellitus occurs 4. It is one of the most important causes of blindness in many countries 5. It has been reported that the pathogenesis of the diabetic retinopathy is inflammation as well as oxidative stress 6. While inflammation is part of the healing process of wounds and infections, it also plays a central role in the pathogenesis of this disorder 7 through changes in blood-retinal barrier and breakdown of retinal neovascularization in these patients 8. The capillaries become more permeable, with leakage of blood proteins into body fluid 9. The acute phase response to inflammation, or tissue damage is expressed through a change in the concentration of those proteins which are known as acute-phase proteins and include both positive acute-phase proteins and negative acute-phase proteins 10.
Proteins play a central role in cell structure and function. Serum contains a mixture of proteins that differ in origin and function, and the amount of protein in the vascular compartment depends on the balance between the rate of its synthesis and the rate of its catabolism, or loss 11. They are major components of all cells, and present in all body fluids. Usually blood and urine samples are being used for diagnostic tests for diabetes 12. But in the recent years, attempts have been made to replace blood test by other body fluids samples that could be collected by noninvasive method. One of the most important samples is saliva which has many advantages over serum since it is inexpensive and noninvasive, easy to be collected, delivered and stored 13.
However, numerous studies had been performed to investigate the alteration in serum proteins and the result of serum [TP] in diabetics were variable in different papers in which most of them showed presence of a significant increase 14-17 or a non-significant increase 18 of serum [total protein]in diabetic patients, or even the record of lower levels of serum [total protein] in D2M in few other studies was reported 19.
Venkataramana et al explained the statistically significantly increased serum [TP] in D2M by the fact that all patients in their study were normo-albuminuria and without detectable micro- and macro vascular complications 15. In contrast, Agoro et al showed that [TP] of D2M were statistically significantly decreased they related the decrease to hypervolemia as a result of the increased osmolality of a diabetic blood 19.
The main goal of the present work is to look for the changes in [TP], [A], [G] and [A]/[G] ratio in serum and saliva samples of patients with type2 diabetic with and without proliferative diabetic retinopathy to determine their relation to disease status. As well as, to look for the possibility of using saliva as an alternative sample to follow these changes in the present studied patients and to distinguish such changes using agarose electrophoresis.
Materials and Methods
The current study included two groups of type2 diabetic patients, 95 individuals with type 2 DM where 60 of them with and 35 of them without proliferative diabetic retinopathy(PDR)) according to standard American Diabetes Association criteria (20 and 30 age and gender matched healthy controls. All patients with PDR were admitted to: Ibn Al- Haitham Teaching Eye Hospital Baghdad, Iraq. They were diagnosed by specialists. Examination of the patients was done by slit lamp microscope. Five milliliters of venous blood samples were collected from overnight fasting patients, and from the control groups, in polyethylene tube. Samples were allowed to clot for ten minutes at 37℃ and then blood samples were centrifuged at (3000 x g) for 10 minutes, the clear serum was pipetted into clear dry test tube. At the same time unstimulated 5 mL whole, mixed-saliva samples were collected after rinsing their mouth with normal saline and preserved in an ice container under resting conditions in the fasting state. The saliva samples were centrifuged at (3000 ×g) for 10 minutes to eliminate insoluble material and to obtain the supernatant. Both sera and saliva samples were stored frozen at – 20 in polyethylene tubes until they were used for the assay. This study protocol was approved by the Ethics Committee of the College of science/ University of Baghdad. Bradford method 21 was used to determine total serum and saliva proteins concentration using Bovine Serum Albumin (BSA) as a standard. Total Protein concentrations of serum and saliva were expressed in g/L. Serum and saliva albumin was determined by dye-binding method 22, using bromocresol green (BCG) as the dye and using kit manufactured by Spinreact. The concentration of globulin in serum and saliva samples of control and all patient groups was calculated, using the following equation:
Globulin conc. (g/L) = Total protein conc. (g/L) – Albumin conc. (g/L)
A volume of 1000µL pooled crude saliva that were used for electrophoresis of all studied groups was concentrated using the trichloroacetic acid (TCA)/acetone method 23. Briefly, proteins were precipitated using a mixture of trichloroacetic acid (TCA) (10% final concentration) and 2-mercaptoethanol (0.07% final concentration) at -20℃ overnight, and then centrifuged at 13000g for 15 min at 4℃. The pellet was washed three times with ice-cold acetone containing 2-mercaptoethanol (0.07%) and centrifuged as described above. The pellet was air-dried for a few minutes and, finally, resuspended in 100µL the protein diluent solution in the electrophoresis kit.
Pooled diluted 1:6 with protein diluent solution crude serum sample and concentrated pooled crude saliva sample protein electrophoretic fractionation profile was carried out using agarose gel electrophoresis and were applied on commercial Hellabio protein electrophoresis Kit (MPE), The gels were analyzed by Hellabio scan and software.
Statistical analysis was carried out using the program Statistical Package for the Social Science (SPSS for windows, version 22). The differences between groups were tested by one-way ANOVA followed by Tukey analysis to test the differences between groups, and the P-value was considered significant if it is < 0.05. The mean difference was defined as significant at p<0.05 level and correlation of parameters were done by using Pearson’s formula. The percentage of significance was obtained on the basis of r values and P values.
Results
The results of serum and salivary [TP] measurement in studied groups are illustrated in (Chart 1).
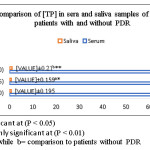 |
Chart 1 Click here to View chart |
Throughout this study, a comparison between type2 diabetic patients without proliferative diabetic retinopathy (PDR) and the control sample was done and the above results show that: a slightly increase in [TP] in patients is observed but the increase was non-significant (p =0.154), while the increase in salivary [TP] was significant (p =0.041). While in comparison between the results of type2 diabetic patients with PDR and those without PDR the increase in [TP] in serum was non-significant (p =0.159) but in salivary [TP] the increase was significant (p =0.000).
Table 1: Comparison of [A], [G] and [A]/[G] ratio in sera and saliva samples of patients with and without PDR.
|
Mean±SD (Range) P-value |
Groups |
|||||
|
A/G Ratio |
Globulin (g/L) |
Albumin (g/L) |
||||
|
Saliva |
serum |
Saliva |
Serum |
Saliva |
serum |
|
|
0.753±0.204 (0.281-1.03) |
1.84±0.207 (1.51-2.24) |
0.388±0.093 (0.132-0.498) |
25.89±2.66 (22-29.66) |
0.295±0.114 (0.09-0.49) |
47.52±2.24 (43-50.34) |
Control (n=30) |
|
0.945±0.125 (0.737-1.1) |
1.47±0.098 (1.29-1.59) |
0.425±0.079 (0.245-0.50) |
31.12±2.98 (27-36) |
0.414±0.09 (0.23-0.55) |
45.65±2.12 (42-49.7) |
Patients without PDR (n=35) |
|
0.001 a ** |
0.000 a ** |
0.471 |
0.000 a ** |
0.004 a ** |
0.101 |
|
|
1.062±0.164 (0.746-1.39) |
1.13±0.164 (0.896-1.5) |
0.599±0.112 (0.4-0.756) |
37.43±4.67 (30-45) |
0.626±0.123 (0.41-0.79) |
41.84±3.44 (35.6-47.7) |
Patients with PDR (n=60) |
|
0.037 b * |
.000 b ** |
0.000 b ** |
0.000 b ** |
0.000 b ** |
0.000b** |
|
*The difference is significant at (P < 0.05)
**The difference is a highly significant at (P < 0.01)
a= comparison to control while b= comparison to patients without PDR
When [A] was measured and [G] and [A]/[G] ratio were calculated mathematically the result in (table1) show there is a significant increase in serum [G] and salivary [A], p=0.000, p= 0.004 respectively also the result show a significant decrease in serum [A]/[G] ratio p= 0.000, while a significant increase in salivary [A]/[G] ratio p= 0.001. These results were obtained upon comparing patients’ group without PDR with the control group and both patients’ groups without and with PDR with each other. Moreover, a significant decrease in sera [A] p= 0.000, with a significant increase in salivary [G] are clear in samples of patients’ groups with PDR comparted with that without PDR.
Electrophoresis was used to follow these changes and the result are presented in (Figure1).
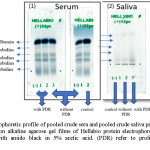 |
Figure 1: Electrophoretic profile of pooled crude sera and pooled crude saliva protein of the three studied groups on alkaline agarose gel films of Hellabio protein electrophoresis kit. The gels were stained with amido black in 5% acetic acid. (PDR) refer to proliferative diabetic retinopathy. Click here to View figure |
Table 2: Serum and saliva samples electrophoresis (% and g/L) of each T2DM patients with and without PDR and control group.
|
Gamma region g/L |
Beta region g/L |
Alpha-2 region g/L |
Alpha-1 region g/L |
Albumin g/L |
Groups
|
||||||
|
saliva |
serum |
saliva |
serum |
saliva |
Serum |
saliva |
serum |
saliva |
serum |
||
|
0.3 |
8 |
0.1 |
9.9 |
0.05 |
7 |
0.05 |
2.4 |
0.1 |
44.2 |
Control |
|
|
0.35 |
8.6 |
0.22 |
10.9 |
0.1 |
8.1 |
0.1 |
3 |
0.15 |
42.4 |
Patients without PDR |
|
|
0.5 |
12.1 |
0.3 |
12.7 |
0.25 |
11.2 |
0.1 |
4.1 |
0.2 |
39.1 |
Patients with PDR |
|
Upon comparison of the results between the patients type 2 diabetes mellitus patients without PDR and healthy controls it is clear that there is an increase in [TP] and [G] in sera and saliva protein electrophoretic band intensity. Sera level of [A] patients’ samples were slightly decreased, while the level of [A] in saliva patients’ samples is slightly increased. The results (figure 1 and table 2) also show presence of an increase level of alpha-1and alpha-2 fractions in sera and saliva patients samples. Moreover, there are increased beta globulins and gamma globulins fractions in both sera and saliva samples of patients without PDR in comparison to those of healthy controls.
On the other hand, upon comparison the result of both patients’ groups with each other, the result is the same as for decreased level of sera [A] as well as increased salivary [A]. Also, there is an increase in sera alpha-1 as well as in sera and salivary alpha-2, beta globulin and gamma globulin fractions but the changes are more obvious in the levels of gamma globulin fractions where the higher values are observed in the group of the patients with PDR except for level of salivary alpha-1fractions in which no difference was observed.
- Control
- patients without PDR
- patients with PDR
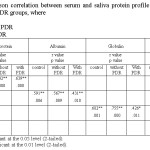 |
Table 3: The Pearson correlation between serum and saliva protein profile of patients T2DM with and without PDR groups, where Click here to View table |
The most obvious result noticed (Table 3) is the existence of positive correlation between the changes in [TP], [A] and [G] in serum and saliva of all present studied groups. While a negative correlation is observed among all studied groups in the ratio of [A]/[G]. This correlation suggests the existences a weak relationship in this ratio (Pearson correlation: -0.191, -0.199, -0.199 respectively) between the serum and saliva.
Discussion
In this study, serum and saliva were used to follow the changes in the level of [TP], [A], [G], and [A/[G] ratio in type2 diabetic patients with and without proliferative diabetic retinopathy (PDR). The patients’ groups were compared as follows: type2 diabetic patients without PDR group compared with healthy group, while type2 diabetic patients with PDR group was compared with patients without PDR group.
The result indicated that the serum [TP] in patients’ samples were slightly increased. but such increase was statistically non-significant. This result is accordant with several studies that showed the presence of no difference in serum [TP] between patients with DM and healthy controls 18, 24, 25. Such slight increase in serum [TP] observed in the current study can be explained as follows; normally, the total amount of protein in the blood falls between 60 and 83 g/L10. If the amount of protein in blood increases, it usually signals an underlying medical condition. The plasma total proteins are composed of albumin (major protein present in blood about 60% of total serum protein), globulin, and fibrinogen9, 26. Since in serum, the fibrinogen component is omitted therefore albumin was measured and globulin was calculated. any condition that lowers serum albumin will lead to a reduced total serum protein (hypoproteinemia), although hypoproteinemia may be due to hypogammaglobulinemia 27. In contrast, true hyperproteinemia is always due to increase in serum globulins, mainly gammaglobulins10. In the current study the increase in serum [TP] and serum albumin (Table1) were not significant but there was highly significant increase in serum [G] so the effect of the [A] reduction is small and therefore the net level of serum [total protein] was slightly increased. Furthermore, it has been suggested that the decrease in serum [TP] is due to microproteinuria and albuminuria, which are important clinical markers of diabetic nephropathy 24. In current study patients without PDR have been selected without nephropathy so the decrease in serum [A] was not significant and the slight increase in serum [TP] may be related to the increased plasma concentration of inflammatory markers such as high globulins which includes various acute phase proteins for example α1-antitrypsin C-reactive protein, α1-acid glycoprotein, haptoglobin, ceruloplasmin, while the observed decrease in albumin suggest presence of chronic inflammation. On measuring plasma protein, the level of fibrinogen was reported to be increased in D2M due to increase its synthesis 14, 15.
In the present study, Salivary [TP] levels were also increased, it revealed high levels of salivary [TP] in patients without PDR as compared with healthy, but patients who had proliferative retinopathy (PDR) were found to have highest levels of salivary [TP]. This increase is in agreement with many studies carried on saliva sample T2DM and T1DM patients 28, 29, on T2M patients 30, and on T1DM patients 25, 31-33,
The increase was may be explained on the basis that saliva can serve as a partial filtrate of blood which contains serum components transported from capillaries into saliva by diffusion, active transport, or ultra- filtration via gingival sulcus 34. Patients with diabetes are more prone to dental complications such as oral mucosal diseases and oral infections 35. Meanwhile diabetes mellitus (DM) is a clinical syndrome characterized by hyperglycemia 36, glucose metabolic products lead to microvascular changes in blood vessels and basal membranes of cells in salivary glands and oral tissues which lead to a change in salivary composition which include organic and inorganic components associated with increased basement membrane permeability and increased passing of molecules from exocrine glands into their secretions. All these changes cause easier movement of proteins from blood to saliva and gingival fluid 12, 13, 32 lead to an increase in the leakage of serum derived components into saliva through gingival crevices. Moreover, the levels of salivary proteins depend on the salivary flow rate, the salivary flow rate in diabetes is reported to be reduced which is correlated to salivary viscosity and foam that are reflected by the higher levels of proteins 32.
However, the result of salivary [TP] levels in diabetics were variable in different papers and at sometimes contradictory. on comparing different studies, we have found that the majority of studies confirmed the presence of a significant increase of salivary [TP] in diabetic patients. A non-significant increase 37-39 or non-increase at all or even lower levels of salivary [TP] have been recorded in some other studies40-42. Streckfus et al and Indira et al both suggested that the decrease was due to protein utilization by other biochemical metabolic pathways as an overall systemic response to glucose intolerance, while Lima-Aragao et al 42 explained such difference in their study by the fact that the assay was performed immediately after collection where centrifugation of the saliva samples was carried out to prevent endogenous proteolytic activity.
Therefore, this contradiction can be explained by the different used methods was carried out, techniques and type of salivary collection like the stimulated or unstimulated collection of saliva, different salivary sample analysis, different glucose metabolic control methods 43, 44, as well as, the degree of diabetic control in different patients, the duration of the disease, types of diabetes and the presence of diabetic complications.
Hyperproteinemia is always due to increase in serum globulins, mainly gamma globulins 45 as there is no natural cause that can lead to increase in serum albumin. The increase in serum albumin have no clinical significance as it is either due to acute dehydration or artefactual due to albumin i.v. infusion 10.
In our study, the decreased serum albumin levels were confirmed by electrophoresis profile (Figure 1 and Table 2), in patients’ group without PDR as compared with control group but the decrease did not reach significance. These results are in agreement with the previous studies 14, 18, 25. Meanwhile in patients’ group with PDR, it reached significance, also confirmed by gel electrophoresis (Figure 1 and Table 2). These results are in agreement with a previous study 46. On the other hand, in our study there were significant increase in in serum globulin levels in both patients with and without PDR groups (Figure 1 and Table 2). These results are in agreement with the previous studies on D2M 14, 17, 28, 47. Ardawi el al, Malawadi and Adiga suggest that diabetics might show hypergammaglobulinemia (IgA and IgG) 14, 47, this suggestion goes well with hyperglobulinemia found in our study. The decrease in serum albumin (which is known as one negative phase reactants) and increase in serum globulin (a known positive phase reactant) levels could be explained by that albumin and globulin are the major protein components in serum, they play an important role in inflammation 48. All other serum proteins except albumin are globulins which include enzymes, antibodies and different proteins49. During insulin deficiency, it has been reported that there is significant decrease in fractional synthetic rate of albumin that is associated with a significant increase in fibrinogen 14, 15. Such results had been reported to reflect chronic inflammation 48. So, any Changes in the concentration of these individual proteins will lead to a change in total serum protein. Disorders that cause a long-lasting chronic inflammation of different tissues can raise the levels of protein in blood like production of antibody proteins via stimulation of the immune system 50.
On the other hand, oxidative stress plays a vital role in the development of vascular complications in diabetes mainly type 2 diabetes 51, and human serum albumin is known as biomarker of oxidative stress 52. i.e. it acts as a sacrificial proteins53. It has multiple functions, such as antioxidation 54. where it is damaged by reactive oxygen species 55. And absorbs reactive oxygen species and prevent them from attacking other essential proteins 53. Prakash reported in his mini review that oxidized albumin levels elevated in various human diseases such as patients with diabetes mellitus type 1 and type 2 52. This may have an effect on the level of albumin in serum. Moreover, the significant decrease in serum [A] in patients with PDR may due to these patients are more exposed to the involvement of renal participation, including urinary albumin excretion within the microalbuminuria range. Therefore, all patients with PDR should undergo an evaluation of renal function including urinary albumin test 56. In a study conducted by Rehman et al they concluded that there was a significant decrease in serum [A] associated with significant increase in urinary albumin excretion rate in type 1 and type 2 diabetics 16. This fact justifies the non-significant decrease in serum [A] found in patients without PDR in the current study such decrease is mostly related to negative phase reactants. In contrast to serum albumin, throughout the present study, salivary albumin concentration showed a significant increase in both patients with and without PDR, as confirmed by electrophoresis, these results are in agreement with the previous studies on T2DM 25, 32. This increase may be explained on the basis that albumin is considered as a serum ultrafiltrate to the mouth, and its possible increased diffusion into the mucosal secretions is due to the change in the integrity of capillary bed, or mucosal lining that occurs in diabetes mellitus. Salivary albumin increases in immunosuppression, diabetes and radiotherapy, and it has been suggested to be used to evaluate the integrity of mucosal function in the mouth, also is used as a marker for the degree of mucositis or inflammation in the oral cavity 32.
Additionally, salivary [G] levels were slightly increased in the patients group without PDR as compared with control group, as evident by electrophoresis (Figure 1). however, the increase did not reach significance except in the patients group with PDR, as confirmed by the significant increase in protein bands observed upon electrophoresis profile mainly gammaglobulins fraction (Figure1) of patients’ groups. This increase may be due to the increased synthesis of positive acute phase proteins during inflammation. This change in globulins concentration was confirmed by the significant increase in protein bands observed on electrophoresis profile in mainly gammaglobulins fraction (Figure 1) of patients’ groups especially in patient with PDR. Meanwhile it clear from the electrozymogram of the serum and saliva protein presence of an increase in alpha 1, alpha 2, beta and gamma globulins fractions where the increase is more evident in alpha 2, beta and gamma globulins fractions. Such result is in agreement with a study carried in Pakistan on serum of diabetic and non-diabetic patients with retinopathy 57 who reported that serum alpha 1, alpha 2, beta globulins were significantly increased in diabetic patients with retinopathy, diabetic patients without complications and non-diabetic patients with retinopathy as compared with control subjects. Also, Sánchez et al showed that serum alpha 2-globulin plays a key role in the control and regulation of the ocular neovascularization in diabetes patients with proliferative retinopathy 58. Furthermore, Chung el al recorded that the plasma alpha 2-macroglobulin level induced by a variety of factors, including cytokines, in the acute and chronic inflammatory conditions elevated in the blood of patients with diabetes, especially in those with diabetic complications and they found that salivary alpha 2-macroglobulin statistically correlates with plasma alpha 2-macroglobulin in diabetic complications, such as neuropathy and retinopathy 59. Lindsay et al showed that high gamma globulin levels in patients with D2M were the indicator to risk of diabetes, and the activation of immunity system may have a role in the development of D2M 60.
The ratio of serum [A]/[G] in patients’ groups with and without PDR was found to be significantly decreased which supports the results obtained by previous work that reported the [A]/[G] ratio was extremely and significantly lowered in serum of D2M patients 14. In contrast, there was an observed significant increase of salivary [A]/[G] ratio of same groups (Table1), the results were in accordance with study on D2M 35.
[A]/[G] ratio has been reported as a novel inflammatory indicator for prognosis in colorectal cancer, lung cancer, esophageal cancer, and breast cancer 48. Low [A]/[G] ratio means either an increase in serum globulin with normal or low serum albumin or low serum albumin with normal or high serum globulin 49. In the present study, a decrease in this value is due to low serum albumin and increase in serum globulins, but the decrease in serum albumin was greater in T2DM with PDR. Meanwhile in saliva the increase in this value is due to increase both salivary [A]and [G].From the results of this study, the following conclusion may be achieved, that proliferative diabetic retinopathy influences the composition and concentration of serum and salivary proteins and the alterations of the salivary composition might also be helpful for a better understanding of the development and progression of proliferative diabetic retinopathy. And finally, on the basis of the present study, saliva may be used as a noninvasive and painless method as a diagnostic alternative fluid to blood for measurement of the parameters included in the present study for the patients with proliferative diabetic retinopathy.
References
- Sharma, A., Emerging Simplified Retinal Imaging. Dev Ophthalmoly 2017, 60, 56-62.
CrossRef - Wang, L. Z.; Cheung, C. Y.; Tapp, R. J.; Hamzah, H.; Tan, G.; Ting, D.; Lamoureux, E.;
- Wong, T. Y., Availability and variability in guidelines on diabetic retinopathy screening in Asian countries. British Journal of Ophthalmology 2017, 0, 1-9.
CrossRef
- Katagiri, M.; Shoji, J.; Inada, N.; Kato, S.; Kitano, S.; Uchigata, Y., Evaluation of vitreous levels of advanced glycation end products and angiogenic factors as biomarkers for severity of diabetic retinopathy. International Ophthalmology 2017, 37, 1-9.
- Ganiger, A.; Swamy, K. M.; DS, S. P.; Mannangi, N. B.; Gundalli, S., Study of serum copper and zinc in diabetic retinopathy and its correlation with glycemic status. International Journal of Clinical Biochemistry and Research 2016, 3, 76-81.
CrossRef - Nada, W. M.; Abdel-Moety, D. A., Serum C-Reactive Protein and Diabetic Retinopathy. Journal of Ophthalmology 2017, 7, 73-78.
- Calderon, G.; Juarez, O.; Hernandez, G.; Punzo, S.; De la Cruz, Z., Oxidative stress and diabetic retinopathy: development and treatment. Eye 2017, 8, 1122-1130 .
CrossRef - Guo, S. a.; DiPietro, L. A., Factors affecting wound healing. Journal of dental research 2010, 89, 219-229.
CrossRef - Qiu, A.-W.; Wang, J.-L.; Liu, Q.-H., Blocking IL-17A Alleviates Diabetic Retinopathy in Rodents. Cellular Physiology and Biochemistry 2017, 41, 960-972.
CrossRef - Claesson-Welsh, L., Vascular permeability the essentials. Upsala journal of medical sciences 2015, 120, 135-143.
CrossRef - Burtis, C. A.; Bruns, D. E., Tietz fundamentals of clinical chemistry and molecular diagnostics. Elsevier Health Sciences: india, 2014.
- Al‑Muhtaseb, S. I., Serum and saliva protein levels in females with breast cancer. Oncology letters 2014, 8, 2752-2756.
CrossRef - Gupta, S.; Sandhu, S. V.; Bansal, H.; Sharma, D., Comparison of salivary and serum glucose levels in diabetic patients. Journal of diabetes science and technology 2015, 9, 91-96.
CrossRef - Anđelski-Radičević, B.; Dožić, R.; Todorović, T.; Dožić, I., Biochemical markers in saliva of patients with diabetes mellitus. Stomatoloski glasnik Srbije 2012, 59, 198-204.
CrossRef - Malawadi, B.; Adiga, U., Plasma Proteins in Type 2 Diabetes Mellitus. Journal of Biotechnology and Biochemistry 2016, 2, 1-3.
- Venkataramana, G.; Indira, P.; Rao, D., Changes of Plasma Total proteins, Albumin and Fibrinogen in Type 2 Diabetes mellitus-A Pilot study. Indian Journal of Basic & Applied Medical Research 2013, 2, 679-685.
- Rehman, A.; Zamir, S.; Bhatti, A.; Jan, S. S.; Ali, S., Evaluation of Albuminuria, Total Plasma Proteins, and Serum Albumin in Diabetics. Gomal Journal of Medical Sciences 2012, 10.
- Agrawal, R.; Smart, T.; Nobre-Cardoso, J.; Richards, C.; Bhatnagar, R.; Tufail, A.; Shima, D.; Jones, P. H.; Pavesio, C., Assessment of red blood cell deformability in type 2 diabetes mellitus and diabetic retinopathy by dual optical tweezers stretching technique. Scientific reports 2016, 6, 198-200.
CrossRef - Belazi, M. A.; Galli‐Tsinopoulou, A.; Drakoulakos, D.; Fleva, A.; Papanayiotou, P. H., Salivary alterations in insulin‐dependent diabetes mellitus. International journal of Paediatric dentistry 1998, 8, 29-33.
CrossRef - Agoro E, E. N., Eseimokumo SA, Odegbemi JO, Is Saliva an Alternative Non-Invasive Sample for the Estimation of Protein Profile amongst Diabetics and Gender-based Diagnostics? Anat Physiol 2017, 7, 255-300.
- Association, A. D., Standards of medical care in diabetes 2016 abridged for primary care providers. Clinical diabetes: a publication of the American Diabetes Association 2016, 34, 3-21.
- Bradford, M. M., A rapid and sensitive method for the quantitation of microgram quantities of protein utilizing the principle of protein-dye binding. Analytical biochemistry 1976, 72, 248-254.
CrossRef - Doumas, B. T.; Watson, W. A.; Biggs, H. G., Albumin standards and the measurement of serum albumin with bromcresol green. Clinica chimica acta 1997, 258, 21-30.
CrossRef - Jessie, K.; Hashim, O.; Rahim, Z., Protein precipitation method for salivary proteins and rehydration buffer for two-dimensional electrophoresis. Biotechnology 2008, 7, 686-693.
CrossRef - Ekin, S.; Meral, I.; Gunduz, H.; Mert, N., Comparative study of total protein, and total and lipid‐associated serum sialic acid levels in patients with type 2 diabetes mellitus. Journal of clinical laboratory analysis 2003, 17, 124-126.
CrossRef - Abdel Aziz, R. A.; Mahrous, D. M.; Mohammed, G. B.; Abd El-Rehem, S. R.; Abd El- Wahab, I. A., Estimation of Salivary Glucose, Total Proteins, and Albumin in Children with Type 1 Diabetes Mellitus. journal of medical science and clinical research 2016, 4, 13163-13170.
- Madhuvanthi, M.; Lathadevi, G., Serum Proteins Alteration in Association with Body Mass Index in Human Volunteers. Journal of Clinical and Diagnostic Research: JCDR 2016, 10, 5-7.
- Aguiar, F. M. B.; Menescal, Z. L. C.; Costa, D. M. d.; Correia, J. W.; Paiva, J. G. A.; Correia, J. M. S., Protein-losing enteropathy in systemic lupus erythematosus: case report. Revista brasileira de reumatologia 2012, 52, 960-964.
CrossRef - Hassan, H.; Abdul Sattar, A., Influence of diabetes disease on concentration of total protein, albumin and globulins in saliva and serum: A comparative study. Iraqi National of Chemistry 2015, 15, 1-11.
- Yavuzyilmaz, E.; Yumak, Ö.; Akdoǧanli, T.; Yamalik, N.; Özer, N.; Ersoy, F.; Yeniay, İ., The alterations of whole saliva constituents in patients with diabetes mellitus. Australian dental journal 1996, 41, 193-197.
CrossRef - Prathibha, K.; Johnson, P.; Ganesh, M.; Subhashini, A. S., Evaluation of salivary profile among adult type 2 diabetes mellitus patients in South India. Journal of clinical and diagnostic research: JCDR 2013, 7, 1592-1595.
CrossRef - López, M. E.; Colloca, M. E.; Páez, R. G.; Schallmach, J. N.; Koss, M. A.; Chervonagura, A., Salivary characteristics of diabetic children. Brazilian dental journal 2003, 14, 26-31.
CrossRef - Shahbaz, S.; Katti, G.; Ghali, S. R.; Katti, C.; Diwakar, D. D.; Guduba, V., Salivary alterations in type 1 diabetes mellitus patients: Salivary glucose could be noninvasive tool for monitoring diabetes mellitus. Indian Journal of Dental Research 2014, 25, 420-424.
CrossRef - Ben-Aryeh, H.; Cohen, M.; Kanter, Y.; Szargel, R.; Laufer, D., Salivary composition in diabetic patients. Journal of Diabetic Complications 1988, 2, 96-99.
CrossRef - Naing, C.; Mak, J. W., Salivary glucose in monitoring glycaemia in patients with type 1 diabetes mellitus: a systematic review. Journal of Diabetes & Metabolic Disorders 2017, 16, 2-9.
CrossRef - Ladgotra, A.; Verma, P.; Raj, S. S., Estimation of Salivary and Serum Biomarkers in Diabetic and Non Diabetic Patients-A Comparative Study. Journal of Clinical and Diagnostic Research: JCDR 2016, 10, 56-61.
CrossRef - Puttaswamy, K. A.; Puttabudhi, J. H.; Raju, S., Correlation between salivary glucose and blood glucose and the implications of salivary factors on the oral health status in Type 2 diabetes mellitus patients. Journal of International Society of Preventive & Community Dentistry 2017, 7, 28-33.
CrossRef - Al-Zahawi, S. M.; Al-Barzenji, H. A. M.; Al-Qassab, Z. A., Effects of diabetes mellitus types II on salivary flow rate and some salivary parameters (total protein, glucose, and amylase) in Erbil city. J Bagh Coll Dent 2012, 24, 123-127.
- Tenovuo, J.; Lehtonen, O.-P.; Vkari, J.; Larjava, H.; Vilja, P.; Tuohimaa, P., Immunoglobulins and innate antimicrobial factors in whole saliva of patients with insulin- dependent diabetes mellitus. Journal of dental research 1986, 65, 62-66.
CrossRef - Ben-Aryeh, H.; Serouya, R.; Kanter, Y.; Szargel, R.; Laufer, D., Oral health and salivary composition in diabetic patients. Journal of diabetes and its complications 1993, 7, 57-62.
CrossRef - Streckfus, C. F.; Marcus, S.; Welsh, S.; Brown, R. H.; Cherry‐Peppers, G., Parotid function and composition of parotid saliva among elderly edentulous African–American diabetics. Journal of oral pathology & medicine 1994, 23, 277-279.
CrossRef - Indira, M.; Chandrashekar, P.; Kattappagari, K. K.; Chandra, L. P. K.; Chitturi, R. T.; BV, R. R., Evaluation of salivary glucose, amylase, and total protein in Type 2 diabetes mellitus patients. Indian Journal of Dental Research 2015, 26, 271-275.
CrossRef - Lima-Aragão, M. V.; de Jesus Oliveira-Junior, J.; Maciel, M. C. G.; Silva, L. A.; Nascimento, F. R. F.; Guerra, R. N. M., Salivary profile in diabetic patients: biochemical and immunological evaluation. BMC research notes 2016, 9, 103-109.
CrossRef - Vaziri, P. B.; Vahedi, M.; Mortazavi, H.; Abdollahzadeh, S.; Hajilooi, M., Evaluation of salivary glucose, IgA and flow rate in diabetic patients: a case-control study. Journal of Dentistry of Tehran University of Medical Sciences 2010, 7, 13-18.
- Shirzaiy, M.; Heidari, F.; Dalirsani, Z.; Dehghan, J., Estimation of salivary sodium, potassium, calcium, phosphorus and urea in type II diabetic patients. Diabetes & Metabolic Syndrome: Clinical Research & Reviews 2015, 9, 332-336.
CrossRef - Weese, S.; Munroe, G., Equine clinical medicine, surgery and reproduction. CRC Press: London, 2011; 739-740
- Hasan, N. A., Effects of trace elements on albumin and lipoprotein glycation in diabetic retinopathy. Saudi medical journal 2009, 30, 1263-1271.
- Ardawi, M.; Nasrat, H.; Bahnassy, A., Serum immunoglobulin concentrations in diabetic patients. Diabetic Medicine 1994, 11, 384-387.
CrossRef - Mao, M.-j.; Wei, X.-l.; Sheng, H.; Wang, X.-p.; Li, X.-h.; Liu, Y.-j.; Xing, S.; Huang, Q.; Dai, S.-q.; Liu, W.-l., Clinical Significance of Preoperative Albumin and Globulin Ratio in Patients with Gastric Cancer Undergoing Treatment. BioMed Research International 2017, 2017, 1-8.
- Vasudevan, D. M.; Sreekumari, S.; Vaidyanathan, K., Textbook of biochemistry for medical students. eighth ed.; JP Medical Ltd: india, 2016, 384.
- Nicholson, L. B., The immune system. Essays in biochemistry 2016, 60, 275-301.
CrossRef - Asmat, U.; Abad, K.; Ismail, K., Diabetes mellitus and oxidative stress a concise review. Saudi Pharmaceutical Journal 2016, 24, 547-553.
CrossRef - Prakash, S., Role of Human Serum Albumin and Oxidative Stress in Diabetes. J Appl Biotechnol Bioeng 2017, 3, 2-5.
- Nimse, S. B.; Pal, D., Free radicals, natural antioxidants, and their reaction mechanisms. RSC Advances 2015, 5, 27986-28006.
CrossRef - Nakae, H.; Tomida, K.; Kikuya, Y.; Okuyama, M.; Igarashi, T., Comparison of quality of human serum albumin preparations in two pharmaceutical products. Acute Medicine & Surgery 2017, 4, 251-254.
CrossRef - McGuinness, A. J. A.; Sapey, E., Oxidative Stress in COPD: Sources, Markers, and Potential Mechanisms. Journal of clinical medicine 2017, 6, 21-39.
CrossRef - Boelter, M. C.; Gross, J. L.; Canani, L.; Costa, L.; Lisboa, H.; Três, G. S.; Lavinsky, J.; Azevedo, M. J. d., Proliferative diabetic retinopathy is associated with microalbuminuria in patients with type 2 diabetes. Brazilian journal of medical and biological research 2006, 39, 1033-1039.
CrossRef - Gul, A.; Rahman, M. A., Comparison of blood protein levels between diabetic and non-diabetic patients with retinopathy. Journal of the College of Physicians and Surgeons Pakistan: JCPSP 2006, 16, 408-411.
- Sánchez, M. C.; Luna, J. D.; Barcelona, P. F.; Gramajo, A. L.; Juarez, P. C.; Riera, C. M.; Chiabrando, G. A., Effect of retinal laser photocoagulation on the activity of metalloproteinases and the α 2-macroglobulin proteolytic state in the vitreous of eyes with proliferative diabetic retinopathy. Experimental eye research 2007, 85, 644-650.
CrossRef - Chung, T. J.; Hsu, K. Y.; Chen, J. H.; Liu, J. S.; Chang, H. W.; Li, P. F.; Huang, C. L.; Shieh, Y. S.; Lee, C. H., Association of salivary alpha 2‐macroglobulin levels and clinical characteristics in type 2 diabetes. Journal of diabetes investigation 2015, 7, 190-196.
CrossRef - Lindsay, R. S.; Krakoff, J.; Hanson, R. L.; Bennett, P. H.; Knowler, W. C., Gamma globulin levels predict type 2 diabetes in the Pima Indian population. Diabetes 2001, 50, 1598-1603.
CrossRef


ISSN Online: 2231-5039

![]()


