Optimization on the Stability of Linseed Oil-in-Water Nanoemulsions Generated by Ultrasonic Emulsification Using Response Surface Methodology (RSM)
Sepideh Hosseini1, Babak Ghiassi Tarzi*1, Maryam Gharachorloo1, Mehrdad Ghavami1 and Hossein Bakhoda2
1College of Food Science and Technology, Tehran Science and Research Branch, Islamic Azad University, 1477893855 Tehran, Iran.
2Department of Agricultural Mechanization, Tehran Science and Research Branch, Islamic Azad University, Tehran, Iran.
Corresponding author’s
Email: babakghiassi@hotmail.com
DOI : http://dx.doi.org/10.13005/ojc/310282
Article Received on :
Article Accepted on :
Article Published : 13 Jun 2015
Oil-in-water (O/W) nanoemulsions formed from bioactive compounds such as polyunsaturated fatty acids (PUFA), are commercially attractive because of the potential health benefits associated with their consumption. Emulsions with a mean droplet size as small as 72±5.14 nm and viscosity 3.84±0.26 mPa·s were achieved using a mixture of 10:100 (V/V) linseed oil and water in the presence of surfactants i.e. Tween 80 and Span 60 with the HLB of 11.7. The zeta potential of the generated nanoemulsion was approximately -18 mV at its original pH of 5.9. Results of this study indicated that desired zeta potential might be achieved by changing the pH of final emulsion.
KEYWORDS:Droplet size; Linseed oil; Nanoemulsion; Ultrasonic Emulsification; Viscosity
Download this article as:| Copy the following to cite this article: Hosseini S, Tarzi B. G, Gharachorloo M, Ghavami M, Bakhoda H. Optimization on the Stability of Linseed Oil-in-Water Nanoemulsions Generated by Ultrasonic Emulsification Using Response Surface Methodology (RSM). Orient J Chem 2015;31(2). |
| Copy the following to cite this URL: Hosseini S, Tarzi B. G, Gharachorloo M, Ghavami M, Bakhoda H. Optimization on the Stability of Linseed Oil-in-Water Nanoemulsions Generated by Ultrasonic Emulsification Using Response Surface Methodology (RSM). Available from: http://www.orientjchem.org/?p=9265 |
Introduction
There has been growing interest in the utilization of nanoemulsions in the food industry because of their potential health benefits associated with their consumption1. Nanoemulsions have the ability to increase the bioavailability of dispersed phase and their fine particle size contributes to a smooth and creamy mouth feel2. Nanoemulsions can be designed to be transparent or translucent while have good stability to gravitational separation3. These unique characteristics make them attractive for their use in the commercial products.
This type of sub-micron emulsion can be created by using a variety of approaches which are typically categorized as either high-energy or low-energy approaches, in all of which the droplet size generated depends on the technique employed, the operating conditions subjected to and the composition of emulsions such as the type of emulsifier and oil, along with their relative concentration, surface tension and viscosity4, 5. The size of droplet, interfacial complex and osmotic pressure of dispersed phase are effective approaches that can be used for generation of stable nanoemulsion droplets6. Recently the use of low frequency ultrasound for emulsion formation is well established7, 8. Most of the traditional methods usually fail to provide a satisfactory control over the particle size distribution and often result in poor dispersion stability. Compared to mechanical agitation, high intensity ultrasound offers a better alternative yet energy efficient technique in the generation of nanoemulsions and also introducing ultrasound may result into nanoemulsion without over processing8. Though it can be said ultrasound processor capable of larger product throughput to meet industrial demands9.
However, most work to date has focused on the preparation of synthetic emulsions, for example, for the paint or cosmetic industry. The development and evaluation of such techniques for the food industry is a much more recent phenomenon10.
Linseed oil which is an excellent source of omega-3 (PUFA) has the extra benefits of pleasant odor and decreases LDL cholesterol, compared to fish oil11. Encapsulation of this extremely unsaturated oil was carried out by different methods in order to protect it from chemical degradation and also to facilitate its incorporation within a product. In addition linseed oil is a less expensive vegetable oil with high nutritional value which could be desirable for replacing the conventional solvents in industrial applications. Recently Sivakumar et al.12 have described utilizing vegetable oils for fabrication of manganese zinc ferrite nanocrystals through ultrasonic emulsification and evaporation. Also palm oil based submicron emulsions was prepared to encapsulating curcumin and results showed that the final droplet size for curcumin-loaded submicron emulsions was about 532 nm and the encapsulation efficiency of curcumin was found to be 88% using the optimum operating conditions of submicron emulsion generation13.
Furthermore there have been numerous investigations of nanoemulsions as an alternative delivery strategy to the encapsulation of water insoluble bioactive compounds14, 15. Optimum hydrophilic-lipophilic surfactant combination and concentration is the one of the main factors for the formulation of nanoemulsions. Combination of surfactants could provide different chain length distributions for forming and stabilizing the nanoemulsions. D-limonene in water nanoemulsion (O/W nanoemulsions) have been obtained by using mixed surfactants of sorbitan trioleate and polyoxyethylene (20) oleyl ether16. Paraffin oil in water nanoemulsions have been prepared by using the mixed surfactants of Tween 80/Span 8017.
As the fabrication of nano scale emulsions involved a wide variety of formulation parameter hence optimization is inevitable. Response surface methodology (RSM) is one of the most relevant multivariate techniques used in analytical optimization and helps to identify the combination of the input variable setting that leads to the optimized solution but also allows the user to compromise among various responses studied18. Over the last several years some papers presented optimization work of nanoemulsion preparation with ultrasound by using this experimental methodology, and most of them demonstrated that RSM is useful yet helpful statistical tool for conducting a systematic optimization study of the nanoemulsion formulations18, 19.
The main objective of this study was to investigate the influence of emulsification method on the droplet size, viscosity and turbidity of linseed oil nanoemulsions, and to optimize the formulation for preparing nanoemulsions with smallest droplet size by using response surface methodology (RSM). In addition, the stability of linseed oil nanoemulsions was also examined.
Experimental
Materials
Cold pressed Linseed oil (ρ= 0.933 kg/m3, RI = 1.4794) was purchased from the local supermarket (Tehran, Iran). De-ionized water was freshly obtained from Barnstead GenPure apparatus (Terra Universal, Inc, USA). All other chemicals used in this study were of analytical grade.
Preparation of nanoemulsion
All base emulsions were prepared from Linseed oil in 1-10 % (V/V) as disperses phase, with the HLB between “11-15” and with various emulsifier concentration (0.5 and 1% (V/V)). All emulsions were prepared in two stages. The coarse emulsions were prepared by high speed homogenizer (IKA T25), and then further emulsified by ultrasonication. Sonication was introduced in a continuous mode using an ultrasonic processor (Hielscher UP400S, 24 kHz, 400 watts). This simple ultrasonic device consisted of an electrical generator, an IP40 grade transducer and a cylindrical titanium sonotrode (horn) in combination with a stand generator. For each experiment, approximately 100 ml batches were placed in the flask having a jacket for cooling and treated for 5 min in 100% power amplitudes.
Experimental design
Response surface methodology (RSM), particularly D-optimal design, was used to study the effects of independent variables: dispersed phase ratio (X1), HLB (X2) and emulsifier ratio (X3) on the droplet size and viscosity of Linseed oil nanoemulsions. Numeric factors, dispersed phase and HLB are varied (1-10%) and (11-15) respectively while categorical factor contain emulsifier ratio (0.5, 10%). DesignExpert® software (Version 7, Stat-Ease, Minneapolis, USA) was used to conduct the study. Table 1 shows the treatment design and the results of particle size and viscosity.
Droplet size determination
Droplet size of nanoemulsions obtained by dynamic laser scattering using a Master sizer 2000 (Malvern, Worcestershire, United Kingdom). Emulsion particle size results are an average of three measurements using He–Ne laser at a wavelength of 633 nm and at a scattering angle of 173 15°”> at 25 ℃.
Viscosity determination
Anton Paar’s viscometer (Model SVM 3000) was used to measure the density and kinematic and dynamic viscosity of oils at 25 ℃.
Electrophoretic properties
The electrophoretic properties of emulsion droplets were measured by using the Zeta sizer nano system (Malvern instrument Ltd., UK). The zeta potential (f) was calculated by Smoluchowski’s equation (Eq. 1) which was used to represent the electrophoretic properties:
where, η and ε are the viscosity and dielectric constant of water, respectively, ν is the mobile velocity of the oil droplets in the electric field, U is the voltage and L is the distance between two electrodes. pH values of emulsions were adjusted by 0.01 M NaOH or 0.01 M HCl and the effect of pH on the zeta potential of droplets was determined 20.
Results and Discussion
Process optimization for the formulation of linseed oil in water nanoemulsions
The droplet size of nanoemulsions obtained from all the experiments are given in Table 1. The experimental data were used to calculate the coefficients of quadratic polynomial equation, and the derived equation was then used to predict the values of droplet size of nanoemulsions. The predicted values agreed well with the experimental ones obtained from the RSM design.
Table1: Particle size and viscosity obtained from the D-optimal design treatment
| Treatment | Dispersed phase (%) (V/V) | HLB | Emulsifier concentration (%) | Droplet size (nm) | Droplet size (nm)* | Viscosity (mPa.s) | Viscosity (mPa.s)* |
| 1 | 10.00 | 15.00 | 1.00 | 286.90 | 273.00 | 2.65 | 2.31 |
| 2 | 1.00 | 13.08 | 0.50 | 85.10 | 83.00 | 4.14 | 3.99 |
| 3 | 10.00 | 11.00 | 1.00 | 106.40 | 106.00 | 3.75 | 4.06 |
| 4 | 4.76 | 15.00 | 0.50 | 163.20 | 163.00 | 2.19 | 2.54 |
| 5 | 1.00 | 11.00 | 1.00 | 150.90 | 144.00 | 2.72 | 2.74 |
| 6 | 10.00 | 13.90 | 0.50 | 153.10 | 152.00 | 2.81 | 2.71 |
| 7 | 1.00 | 15.00 | 1.00 | 211.00 | 207.00 | 2.04 | 2.03 |
| 8 | 6.20 | 11.00 | 0.50 | 105.40 | 131.00 | 3.73 | 3.10 |
| 9 | 5.50 | 13.50 | 1.00 | 109.70 | 108.00 | 3.80 | 3.77 |
| 10 | 10.00 | 13.50 | 1.00 | 98.50 | 125.00 | 4.02 | 3.99 |
| 11 | 5.50 | 13.58 | 0.50 | 145.03 | 97.00 | 2.86 | 3.58 |
| 12 | 5.50 | 11.00 | 1.00 | 97.11 | 101.00 | 3.93 | 3.58 |
| 13 | 2.13 | 11.00 | 0.50 | 145.00 | 138.00 | 2.60 | 3.29 |
| 14 | 1.00 | 13.50 | 1.00 | 106.80 | 121.00 | 3.15 | 3.20 |
| 15 | 4.76 | 15.00 | 0.50 | 142.20 | 163.00 | 2.94 | 2.54 |
| 16 | 10.00 | 13.90 | 0.50 | 151.20 | 151.00 | 2.69 | 2.71 |
| 17 | 1.00 | 15.00 | 1.00 | 213.70 | 213.00 | 1.92 | 2.03 |
| 18 | 1.00 | 13.08 | 0.50 | 76.00 | 83.00 | 4.52 | 3.99 |
| 19 | 10.00 | 15.00 | 1.00 | 269.70 | 273.00 | 2.28 | 2.31 |
Table2: Analysis of variance for the fitted quadratic polynomial model of droplet size of nanoemulsion
| Source | Sum of Squares | df | Mean of square | F Value | P- Value Prob> F |
| Model | 8.86 | 8 | 1.11 | 4.93 | 0.01 |
| A – dispersed phase | 0.08 | 1 | 0.08 | 0.39 | 0.04 |
| B – HLB | 2.41 | 1 | 2.41 | 10.72 | 0 |
| C – Emulsifier ratio | 0.13 | 1 | 0.13 | 0.56 | 0.47 |
| AB | 0.4 | 1 | 0.4 | 1.77 | 0.21 |
| AC | 2.54 | 1 | 2.54 | 11.3 | 0 |
| BC | 0.13 | 1 | 0.13 | 0.59 | 0.46 |
| A2 | 0.09 | 1 | 0.09 | 0.41 | 0.53 |
| B2 | 2.52 | 1 | 2.52 | 11.22 | 0 |
The results of ANOVA for the fitted quadratic polynomial model of droplet size and viscosity have been shown in Table 2 and 3 respectively. Analysis of variance (ANOVA) showed that the resultant quadratic polynomial models adequately represented the experimental data with the coefficients of multiple determinations (R2) of 0.92 and 0.83 for particle size and viscosity respectively. The coefficient estimates and the corresponding P-values indicate that the dispersed phase ratio and HLB had significant effect on the droplets size and viscosity of emulsion (P < 0.05) but the emulsifier ratio quadratic terms were not significant (P > 0.05). Furthermore, the interaction between dispersed phase and emulsifier ratio had no significant effect (P > 0.05) on the droplet size. In the term of viscosity except for dispersed phase and emulsifier ratio, none of the interactive terms had significant effect (P > 0.05) on the droplet size of the Linseed oil nanoemulsions. Therefore, the second order polynomial equation (2) and (3) were used to predict the droplet size and viscosity of nanoemulsions respectively.

Where Y is the response, and X1, X2 and X3 are the coded variables for the dispersed phase ratio, HLB and emulsifier ratio, respectively.
Table3: Analysis of variance for the fitted quadratic polynomial model of droplet size of nanoemulsion
| Source | Sum of Squares | df | Mean of square | F Value | P- Value Prob> F |
| Model | 58555.39 | 8 | 7319.42 | 14.49 | 0.00 |
| A – dispersed phase | 3067.05 | 1 | 3067.05 | 6.07 | 0.03 |
| B – HLB | 16920.69 | 1 | 16920.69 | 33.51 | 0.00 |
| C – Emulsifier ratio | 518.02 | 1 | 518.02 | 1.03 | 0.33 |
| AB | 5469.45 | 1 | 5469.45 | 10.83 | 0.00 |
| AC | 2231.49 | 1 | 2231.49 | 4.42 | 0.06 |
| BC | 3786.96 | 1 | 3786.96 | 7.5 | 0.02 |
| A2 | 614.53 | 1 | 614.53 | 1.22 | 0.29 |
| B2 | 11534.93 | 1 | 11534.93 | 22.84 | 0.00 |
Response surface analysis
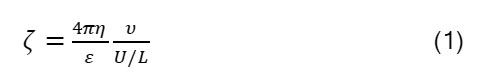
The relationship between independent and dependent variables has been graphically represented by 2D contour plots generated by the software (Fig. 1 and 2). Different shapes of the contour plots indicated different interactions between the variables; an elliptical contour plot indicated that the interactions between the variables were significant while a circular contour plot means otherwise21. Figure 1 showed the interaction between dispersed phase and HLB on the droplet size of nanoemulsion. In the present of sufficient surfactant to adsorb onto the surface of newly formed droplets, by applying the appropriate HLB, could increase Linseed oil concentration and produced nanoemulsion with droplet size less than 72 nm (Fig. 1a). However, if the emulsifier ratio is 0.05, dispersed phase must be considered less than 7.5 % (V/V) to completely coat all the droplet surfaces by emulsifier and generate nanoemulsion with the minimum droplet size (Fig. 1b).
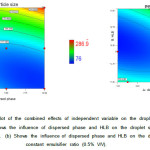 |
Figure1: Contour plot of the combined effects of independent variable on the droplet size of nanoemulsions: (a) shows the influence of dispersed phase and HLB on the droplet size at constant emulsifier ratio (1% V/V). (b) Shows the influence of dispersed phase and HLB on the droplet size at a constant emulsifier ratio (0.5% V/V).
|
The size of droplets in nanoemulsions is important as it influences on the physicochemical properties of nanoemulsions such as rheological, stability, and release characteristics. Generally in the case of high-energy methods for the production of nanoemulsions, droplet size depends on the time of process, type and concentration of surfactant, relative surface tension and viscosity of the dispersed and continuous phases22. Results of this study confirmed that the emulsifier concentration is one of the most important factors to the droplet size of final emulsion. When the dispersed phase and the emulsifier ratio is 10 and 0.5 % (V/V), particle size increases above 100 nm. In this state, there is not sufficient emulsifier to absorb to the surface of freshly formed droplets, therefore they merge to each other and coalescence occurs. Similar results have been reported for the optimum consumption of emulsifiers and droplet size by Kentish et al.11 Additional amounts of emulsifying agents (when 1% oil and 1 % emulsifier was applied for the creation of emulsion) also leads to the formation of multi-layer emulsifier and an increase in the droplet size23. There is evidence showed that the concentration of surfactant in the formulation could be further reduced at the expense of an increased ultrasonic power. Interestingly, a reversible destabilization was observed when higher amount of surfactant was employed8.
The result of surfactant HLB optimization indicate that minimum particle size occurred when HLB was maintained in the range of 11-13. However, in the presence of appropriate emulsifier concentration, optimum HLB range will be broader (Fig. 1a and b). It has been shown before that surfactant HLB can strongly affect the particle size of the dispersed phase24, 25. The finding of this study partially support these observations. According to the optimization results, the minimum droplet size was achieved at a HLB of 11.7. Similar experiments was conducted by Peshkovsky et al.26 In their study, nanoemulsions with 10% of Soy bean oil-in-water were produced by sonicating 30 ml batches for 3 min. A CH-type horn with the tip diameter of 12 mm had been applied for this purpose. The total surfactant concentration was always 10%, but individual concentrations of Tween 80 and Span 80 were varied from 10% of Tween 80 and 0% of Span 80 (HLB = 15) to 4.67% of Tween 80 and 5.33% of Span 80 (HLB = 9.3). Minimum MDS of about 150 nm was achieved when surfactant concentrations were: 8% of Tween 80 and 2% of Span 80 (mixture HLB = 12.57).
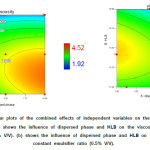 |
Figure2: Contour plots of the combined effects of independent variables on the viscosity of nanoemulsions: (a) shows the influence of dispersed phase and HLB on the viscosity at a constant emulsifier ratio (1% V/V). (b) shows the influence of dispersed phase and HLB on the viscosity at a constant emulsifier ratio (0.5% V/V). Click here to View figure |
Figure 2 described the interaction between the dispersed phase and HLB on the viscosity of nanoemulsion. It is observed that the viscosity severely affected by the concentration of emulsifier. For conventional O/W emulsions, the viscosity of an emulsion increases with an increase in the dispersed phase concentration27. But in the present case of nanoemulsions (as shown in fig. 2b), with rising oil concentration, viscosity is not increased necessarily.
 |
Figure3: Effects of droplet size on the viscosity of nanoemulsion. |
A similar trend was observed in contour plot of droplet size and viscosity which might be due to the effect of droplet size of nanoemulsion on viscosity. To investigate this effect, the viscosity of prepared nanoemulsion (regardless of independence variable) was plotted versus droplet size. As shown in figure 3 with decreasing droplet size, the viscosity of nanoemulsion increase. So the droplet size could be considered as an effective factor for viscosity. This effect can be attributed to the ‘‘shell layer’’ around each of the oil droplets which change the effective dispersed phase volume fraction.
There is some experimental evidence which shows that hydrocarbon oil-in-water emulsions transform from a liquid-like form when the droplets are relatively large (r >100 nm) to a gel-like form when the droplets are relatively small (r < 80 nm). Similar results have also been reported for silicone oil-in-water emulsions stabilized by SDS28, 29.
Optimization of Linseed oil nanoemulsion
Graphical optimization of nanoemulsion formulation as shown in Figure 4 depicted that the highest desirability could be achieved by using Linseed oil and emulsifier in a ratio of 10 and 1 (V/V) respectively and maintaining HLB of 11.7. Under the mentioned conditions it is predicted that the droplet size and viscosity are 86.5 nm and 4.15 mPa.s respectively.
As shown in Table 2, three parallel experiments were carried out under the optimal conditions. Comparing with the value predicted by Design Expert 7.1.6, the results showed that the actual values of 72 ± 5.14 nm and 3.84 ± 0.26 mPa.s for particle size and viscosity were very close to the predicted results.
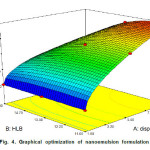 |
Figure4: Graphical optimization of nanoemulsion formulation
|
Stability of Linseed oil nanoemulsions
The zeta potential of optimized nanoemulsion was approximately -18 mV for the emulsion prepared with 10.0 % (V/V) linseed oil at a pH of 5.9. However, the absolute value of zeta potential increased with the decrease of pH, and was zero around pH 4.5, after which the droplets were positively charged (Fig.5). Electrophoretic properties are related to the phenomenon of flocculation which is found to contribute to the instability of the nanoemulsions during storage30. With greater surface charge, the repulsive force increases that can prevent flocculation. Nanoemulsion with -20 mV zeta potential exhibit good stability during 60 days of storage at ambient temperature16. Therefore, it might be concluded that after the formation of nanoemulsion, their stability could be controlled by changing pH to appropriate value.
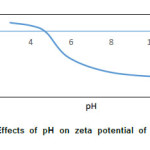 |
Figure5: Effects of pH on zeta potential of droplets
|
Conclusion
Choosing an appropriate and accurate formulation seemed to play a significant role in the processing of nanoemulsion. Results of this study indicate that the HLB of the emulsification system and emulsifier concentration affect the droplets size and viscosity severely. Along with nanoemulsion formation, their high stability is of great importance in practical applications. Selecting the most appropriate emulsifier and controlled pH could control their stability. In brief, the present study provided a new and efficient method which might be applied for unsaturated fatty acid nano-encapsulated systems for food industry.
References
- Burdge, G. C.; Calder, P. C. Nutr Res Rev. 2006, 19, 26−52
- McClements, D. J. Food Emulsions: Principles, Practices, and Techniques. Boca Raton, Florida, CRC Press, (2004)
- Tadros, T.; Izquierdo, P.; Esquena, J.; Solans, C. Adv. Colloid Interface Sci. 2004, 108, 303−318
- Tang, S. Y.; Sivakumar, M. AlChE J. 2013, 59, 155-167
- Tang, S. Y.; Sivakumar, M. Asia-Pac. J. Chem. Eng. 2012, 7, 145-156
- Tang, S. Y.; Sivakumara, M.; Nashiruc, B. Colloids Surf., B. 2013, 102, 653-658
- Jafari, S. M. H.; He,Y.; Bhandari, B. Int J Food Prop. 2006, 9, 475–485
- Sivakumar, M.; Tang, S. Y.; Tan, K. W. Ultrason. Sonochem. 2014, 21, 2069-2083
- Tang, S. Y.; Shridharan, P.; Sivakumar, M. Ultrason. Sonochem. 2013, 20, 485-497
- Izquierdo, P.; Feng, J.; Esquena, J.; Tadros, T. F.; Dederen, J.C.; Garcia, M.J.; Azemar, N.; Solans,C. J. Colloid Interface Sci. 2005, 285, 388–394
- Kentish, S.; Wooster, T. J.; Ashok kumar, M.; Balachandran, S.; Mawson, R.; Simons, L. Innov. Food Sci. Emerg. Technol. 2008, 9, 70–175
- Sivakumar, M.; Towata, A.; Yasui, K.; Tuziuti, T.; Kozuka, T.; Iida, Y.; Maiorov, M. M.; Blums, E.; Bhattacharya, D.; Sivakumar, N.; Ashok, M. Ultrason. Sonochem. 2012, 19, 652–658
- Shridharan, P.; Tang, S. Y.; Sivakumar, M. Ind. Eng. Chem. Res. 2013, 52, 11829-11837
- Qian, C.; McClements, D. J. Food Hydrocolloid, 2011, 25, 1000-1008
- Tang, S. Y.; Sivakumar, M.; Min-Hwei Ng, A.; Shridharana, P. Int. J. Pharm. 2012, 430, 299-306
- Li, P. H.; Chiang, B. H. Ultrason. Sonochem. 2012,19, 92–197
- Tang, S. Y.; Sivakumar, M.; Min-Hwei Ng, A.; Shridharana Ultrason. Sonochem. 2012, 19, 330–345
- Tang, S. Y.; Sivakumar, M.; Tan, K. W.; Billa, N. Ultrason. Sonochem. 2012, 19, 330-345
- Tang, S. Y.; Sivakumar, M. Asia-Pac. J. Chem. Eng. 2012, 7, 125-131
- Liu, W.; Sun, D.; Li, C.; Liu, Q.; Xu, J. J. Colloid Interface Sci. 2006, 303, 557–563
- Juang, R. S.; Lin, K. H. Colloids Surf. A. 2004, 238, 43-49
- Cheong, J. N.; Tan, C. P.; Che Man, Y. B.; Misran, M. J. Food Eng. 2008, 89, 204–209
- Forgiarini, A.; Esquena, J.; González, C.; Solans, C. Prog. Colloid Polym. Sci. 2001, 118,184–189
- Leong, T. S. H.; Wooster, T.J., Kentish, S. E.; Ashokkumar, M. Ultrason. Sonochem. 2009, 16, 721–727
- Anton, N.; Benoit, J. P.; Saulnier, P. J. Controlled Release. 2008, 128, 185-199
- Peshkovskya, A.; Peshkovskya, S. L.; Bystryak, S. Chem. Eng. Process. 2013, 69, 77-89
- McClements, D. J. Soft Matter. 2011, 7, 2297–2316
- Silva, H. D.; Cerqueira, M. A. Souza, B.; Ribeiro, C.; Avides, M.C.; Quintas, M. J. Food Eng. 2011, 102, 130–135
- Wilking, J. N.; Mason,T. G. Phys. Rev. E: Stat. Nonlin. Soft Matter. Phys. 2007, 75, 125-128
- Capek, I. Colloid Interface Sci. 2004, 107, 125–155

This work is licensed under a Creative Commons Attribution 4.0 International License.
![]()
A New Edition of Web of Science
Journal Impact Factor
2022: 0.5
Five Year: 0.8
Journal is Indexed in

Cabells Whitelist
![]()


