A study of spectro photo metric determination of ion association complex, formed by anionic surfactant sodium dodecyl by using crystal violet as a cationic dye in region Bilaspur (Chhattisgarh)
Asha Soni1*, Neena Rai1, Santosh K. Sar2
1Department of Chemistry, Government Engineering College, Bilaspur, Chhattisgarh, India. 2Department of Engineering Chemistry, Centre for Environmental Science and Engineering Bhilai Institute of Technology, Durg, Chhattisgarh, India.
DOI : http://dx.doi.org/10.13005/ojc/300352
Article Received on :
Article Accepted on :
Article Published : 17 Sep 2014
Surface active agents (SAA) with negative charge of polar group are named as anionic compounds. They are the main constituent of most products containing synthetic surfactants. Anionic surfactants after use are passed into sewage-treatment plants, where they are partially degraded and adsorbed to sewage sludge. Therefore, it is important to investigate the environmental fate of those classes of compounds in more details. A sensitive, selective and inexpensive method for the determination of anionic surfactants in waste water of sewage has been developed. This research involves determination the concentration of anionic surfactants sodium dodecyl sulphate (SDS) with use appropriated analytical techniques in environmental samples. The official methodology for determination of anionic surfactant (AS) in liquid samples is based on the ion-pair reaction of these analysts’ compounds with crystal violet (CV) and an extraction with organic solvent benzene. In an organic solvent benzene anionic surfactant SDS and a cationic dye CV forms an ion association complex. This ion associate exhibits an absorption maximum wave length (ʎ max) at 560 nm. The method proposed has been found much easier, accurate and rapid, and there is no use of any toxic chemicals.
KEYWORDS:Surface active agents; Anionic surfactant; Sodium dodecyl sulphate; crystal violet
Download this article as:| Copy the following to cite this article: Soni A, Rai N, Sar S. K. A study of spectro photo metric determination of ion association complex, formed by anionic surfactant sodium dodecyl by using crystal violet as a cationic dye in region Bilaspur (Chhattisgarh). Orient J Chem 2014;30(3). |
| Copy the following to cite this URL: Soni A, Rai N, Sar S. K. A study of spectro photo metric determination of ion association complex, formed by anionic surfactant sodium dodecyl by using crystal violet as a cationic dye in region Bilaspur (Chhattisgarh). Orient J Chem 2014;30(3). Available from: http://www.orientjchem.org/?p=4692 |
Introduction
Anionic surfactants are widely used in households, cosmetics and industrial productions. Surfactants have also been used in pharmaceutical Mining oil recovery polymers, paints, textiles, fibers, foods and pulp industries. The ASs represent approximately 70% of the total surfactant market due to the large consumption of surfactants, it is important to accurately determinate their concentrations for quality control (commercial products), process control (industrial samples) and contamination control (environmental samples and food products).As it is very difficult to biodegrade, the resulting contamination of water sources can affect water quality and aquatic life. Surfactants cause short term as well as long term changes in ecosystem1. They are responsible for causing foams in river and effluent treatment plants and reduce the quality of water. Due to all these reasons, many environmental and health regulatory authorities fixed the permissible limit for anionic surfactants as standard 1.0 mg./L for other purpose and for drinking water the permissible limit is up to 0.5 mg/L. It has been reported [1-3] that world surfactants production in waste water was 1.7, 1.8 and 4.3 MT in the year 1984, 1987, and 1995 respectively. Thus it is necessary to determine the presence of these surfactants in water for the evaluation of the pollution in industrial and domestic waste. There had been numerous experimental studies viz. voltametry [4], titration[5], chromatography[6], microbial sensor[7], amperometric biosensor[8], ion pair formation with in-situ flow injection analysis utilizing dynamic surface tension detection[9], ion selective electrodes[10] and ion pairing chromatography are reported so far that shows the presence of surfactants in waste water but they are time consuming and sometimes they involve toxic chemicals. All these methods are also needs sophisticated instrumentation and expertise. Elaborating simple rapid and selective method for determination of surfactants in waste water is still a challenge to the chemist. The official method for the determination of anionic surfactant in water required total time approx. 90 minutes [11]. This method is based on the formation of an ion associated complex between anionic surfactant and cationic dye crystal violet in the stoichiometric ratio of 1:1. The complex is extracted in to Benzene 3-4 times. The method is rapid, reproducible, and eminently suitable for on-line monitoring applications.
Materials and methods
Apparatus
Spectro photo meter (made with a systronics 105 using 1 cm. quartz cell), measuring cylinder, separating funnel, general cuvette.
Reagents
All used reagents, salts, acids and bases were of highest purity available from reliable companies, the cationic dye CV is dissolved in double distilled water to give 5 X 10⁻³M stock solution. The solubility of the solution was monitored by measuring by absorption spectra in the visible region. SDS was dried at 50o C under reduced pressure until a constant weight obtained. SDS solutions were prepared by appropriate dilution of the stock solution with doubly distilled water.
Experimental procedure
100 ml of sample solution containing SDS from various water samples of sewage was collected in sampling flask. After determination of its pH 10 ml sample solution is taken in a 25 ml separating funnel.. Crystal violet and orthophosphoric acid are added followed by the addition of 5 mL benzene. The mixture is then mix properly and allowed to standing for 5 minute for settling. The aqueous layer is collected and 2.5 mL of this solution is used directly for the absorbance measurement. The blank solution is used for the absorbance measurement at a wavelength of 560 nm. In the same way simultaneously blank solution is also investigated.
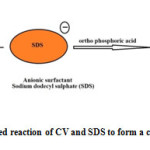 |
Fig1: Ion pair associated reaction of CV and SDS to form a colored derivative) Click here to View Figure |
Results and discussion
The absorption spectra of the ion associate formed between the SDS and the cationic dyes in benzene obtained by the aforesaid procedure. The absorption spectra of these ion associates were obtained. respectively, where the absorbance of the reagent blank was very small and the calibration graph was constructed as shown in Figures 2. Use of crystal violet as a dye in the current method relative to other chromophores is due to its property of easy solubility in water to form ion association complex with the SDS and maximum extractability in organic solvent. Some preliminary experiments showed that SDS, in conjunction with some cationic dyes, could form an ion-association complex, which is suitable for extraction using polar organic solvents. Sodium dodecyl sulphate is a common anionic surfactant; with its critical micelle concentration in water is reported as 8 mM[12]. Molecular absorption and fluorescence spectrophotometer have proven themselves useful tools to study such interactions. Koga et al[13] reported the equilibrium between SDS and methylene blue followed by quantitative extraction of the formed SDS-MB ion paired complex, using chloroform. Anionic surfactants surfactants formed 1:1 complex with cationic dyes. Such complex are called ion association complex. Apart from the various stringent processes in manual spectrophotometric methods such as extraction, retention time of complex, etc which pre decide the efficiency of the method other factor like quickness, less number of reagent used, also held equal positions. While other standard methods requiring a shaking time of 10-90 minutes, and or standing[14] or requirement of tedious centrifugation steps[15]. The current method requires shaking time of one minute and a retention time of three minute. The method also eliminates the requirement of salting out agent like Na2SO4and washing of the organic layer for clear face separation.
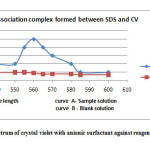 |
Fig2: Absorption spectrum of crystal violet with anionic surfactant against reagent blank solution Click here to View Figure |
At low pH this ion association complex is extracted in an organic layer and the excess dye remains in the water. Type of extracting organic solvents SDS-CV ion associated complexes was extracted in different organic reagent including chlorobenzene, 1-2 di-chloroethane, carbon tetra chloride, chloroform, benzene di-chloro methane, toluene, a mixture of benzene and iso-butyl methyl ketone etc. and their absorbance were shown in table 1. Of the various extractants benzene was selected as a appropriate solvent showing to its low toxicity and maximum extraction efficiency. A stable dark blue SDS-CV complex (up to 48 hours) was obtained in benzene.
Table 1. Absorbance of various concentration of SDS in different solvents.
| Table 1. Absorbance of various concentration of SDS in different solvents. | ||||
|
Concentration of the Sol. |
Benzene |
Toluene |
Chloroform |
Ethyl Acetate |
|
2 ppm 4 ppm 6 ppm 8 ppm |
0.0396 0.538 0.778 1.055 |
0.149 0.156 0.233 0.280 |
0.045 0.044 0.052 0.051 |
0.017 0.026 0.032 0.036 |
The efficiency of benzene to extract maximum portion of the complex, different volumes of the extractants at constant volume of aqueous medium were used. Following the process extraction was repeated with varying water : benzene volume ratio (V/V) between 1:0.1 to 1:1. Overall results showed maximum extraction of water : benzene (V/V) 1:0.5. The absorbance of various concentration of SDS shows regular increase of optical density in benzene compared to other solvents. The optimum concentration of Crystal violet having SDS concentration between 2-10 ppm was 1 x 10⁻⁵ – 1 x 10⁻⁴, showing the concentration of the dye as 5 x 10⁻⁵ M. An acidic pH range was maintained during the process of extraction using Orthophosphoric acid between 25-55 µL serving the dual purpose of maintaining the pH as well as providing maximum grounds for the formation of ion association complex. The absorption spectra at 2 ppm SDS concentration (curve A) and blank (curve B) are shown in fig. 2.
The co-relation co-efficient was obtained at 0.998 while the limit of detection (calculated as 3 SB/m; while SB and m represent standard deviation of the blank and slope of the calibration curve respectively) was 0.01312 ppm. The relative standard deviation is 0.9860. A detailed study on the effect of the co-existing ions is also made. The limiting concentrations of the constituent those do not interfere in the determination of SDS are shown in Table 2. Effect of heavy metals like As, Fe, Hg, Zn showed interference below 10 ppm while considerable effect between 50-1000 ppm, while anion such as Cl–, SO4 etc beyond 500 ppm favoring the applicability of the method for sewage samples. The applicability of the method for a practical sample of domestic water has been examined. For that purpose the laboratory tap water which is free from SDS, has been spiked with known amount of SDS and the SDS concentration is found out using the described method. The results (Table 2) show good agreement (< ± 5.0 %) between the measured concentration and the known value. The method was successfully employed for the determination of AS in different water samples collected from various parts of Bilaspur, Chhattisgarh, India.
Table 2. Measured concentration* of SDS (ppm)
| Table 2. Measured concentration* of SDS (ppm) | ||
|
SDS (ppm) |
Present method |
Standard method |
|
1.0 2.0 3.0 |
0.98 ± 0.045 1.99 ± 0.086 2.99 ± 0.129 |
0.99 ± 0.064 1.93 ± 0.098 2.92 ± 0.186 |
*Average of 5 determinations
The concentration of surfactant in water samples collected from open municipal drainage waste waters of Bilaspur city was reported. (Tables 3).Comparative study of the current method with standard method in three major categories of contaminant source domestic water, agricultural out flow and industrial sewage further supported the relative applicability of the method for samples having wide range of SDS concentration. Statistical analysis revealed a negative kurtosis in domestic sewage waste as compared to the other sources indicating deliberately the application of SDS more in the later than in the former case. A study of data presented in Tables 3 and the location of sampling sites in Figure 3 reveal that surfactants are presented in high concentrations in dumping site. This shows that surfactants which enter at dumping sites from domestic effluents contains high amount of SDS. The comparative study of concentration of SDS in different waste water spots indicates the orders in various waste water streams are as follows
At dumping sites > Near starting source > During flow
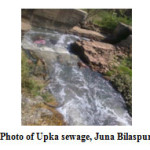 |
Photo Click here to View Photo |
This order of SDS concentration in twelve sampling spots during 2012 to 2013 (Table 3) showed a wide degree of variation. A higher sedimentation rate of SDS after dumping indicated a significant value of the surfactant deposition during dumping rather than during flow which in turn may be most probable reason responsible for enhancing the surfactant value in the nearby ground water sources close to dumping sites serving as sink than in the flow sites.
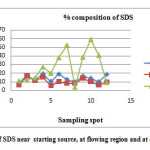 |
Fig3: % concentration of SDS near starting source, at flowing region and at dumping site. Click here to View Figure |
Table 3. Comparative SDS concentration (ppm) at source, flow and dumping site of 16 major sewage sampling spots flowing across the Bilaspur city.
| Table 3. Comparative SDS concentration (ppm) at source, flow and dumping site of 16 major sewage sampling spots flowing across the Bilaspur city. | |||
| Sampling spot(SS) | Near starting source | At flowing region | At dumping site |
|
SS1 SS2 SS3 SS4 SS5 SS6 SS7 SS8 SS9 SS10 SS11 SS12 |
0.96 1.74 1.24 1.93 1.03 1.90 1.27 0.97 1.66 1.41 1.01 1.85 |
0.63 1.66 1.13 1.52 0.56 1.00 0.82 0.85 1.42 1.02 0.63 0.93 |
1.13 1.24 1.47 2.74 2.01 3.82 5.27 0.41 3.87 5.92 4.10 0.95 |
Correlation statistics indicated that while major studied water parameters behaved correlatively with the surfactant, mainly dissolved oxygen and chloride varied reciprocally to the surfactant concentration. This might be strong indicative of the fact that anions including Sulphate, HCO3–, CO3–, or OH– may serve for the ion exchange reaction catalyzed by opposing behavior of chloride conditions due to Dissolved Oxygen (DO).
Table 5. Statistical analysis of SDS concentration (ppm) with other water parameters under Uniform deftness in 16 studied streams of the studied area
| Table 5. Statistical analysis of SDS concentration (ppm) with other water parameters under Uniform deftness in 16 studied streams of the studied area | ||||||
| Statistical parameters | SDS | SO4— | Cl– | DO | Alkalinity | pH |
| MeanStandard ErrorMedianStandard DeviationSample VarianceKurtosis
Skewness Range |
1.070.330.341.011.021.45
0.82 0.25-2.65
|
69.839.8274.7732.6610601.31
-0.20 7.66-132.44 |
239.3427.55271.5691.508373.2-0.88
0.06 90.64-388.23 |
24.732.1322.676.9548.89-0.75
0.11 12.81-35.62 |
112.646.55101.1921.83475.11-0.34
1.27 97.03-152.09
|
7.60.17.40.40.1-0.7
0.7 7.18-7.94
|
Comparative study of SDS with other studied water parameters however revealed that while the Dissolved Oxygen and chloride concentration varied significantly with depth a might be major factors for varying SDS concentration, uniform replicate study of these parameters in different stations revealed that the surfactant variation was reciprocally related with Sulphate while rest other parameters excluding chloride showed a almost same correlative behavior as with depth. This again was supportive of prime role played by Sulphate, chloride and dissolved oxygen in varying the surfactant concentration its release or its deposition.
Table 6. Correlation of various water parameters with SDS conc. in uniform depth in 12 studied streams (n = 115)
| Table 6. Correlation of various water parameters with SDS conc. in uniform depth in 12 studied streams (n = 115) | ||||||
| SDS | SO4— | Cl– | DO | BOD | Alkalinity | |
| SDSSO4Cl–DOBODAlkalinity |
1 -.02 0.82 0.60 0.98 0.94 |
|||||
|
1 0.01 -0.26 0.37 0.13 |
||||||
|
1 0.69 0.22 0.74 |
||||||
|
1 -0.82 0.7 |
||||||
|
1 0.55 |
||||||
|
1 |
||||||
This also finds supports from the major application of these anions chloride or Sulphate during chlorination, bleaching action or as fertilizers Sulphate application. The present method when applied to the samples containing high SLS concentration and its statistical analysis was done the result shows good agreement with the standard method. The percentage error lies within ±5.0 using both methods. However the described method is easy and less time consuming. Moreover several washing steps and the maintenance of pH are needed for the standard method. All these steps enhance the cost of analysis.
Conclusion
This spectro photo metric method was successfully applied to anionic surfactant (AS) determination in twelve waste water spots with different percentages of AS. It has been applied to the determination of trace of anionic surfactants in domestic and industrial waste water with satisfactory result. This work fulfill the aim to focus on the potential application of the method, with an emphasis on municipal system and identifies the major pollutant spots the source and the points of its spread which would be helpful in identifying not only the potential sources of contamination but also the reasons embarking the mobility of the surfactant used. A new-fangled quick, simple and facile spectro photo metric method is developed for the determination of anionic surfactant (AS). An ion pair associated complex was formed between cationic dyes (CV) and anionic surfactants (SDS) and extracted into benzene. The blue colored derivative was stable for more than 10 days. The method has the advantage of being trustworthy, reproducible, choosy and more perceptive than many reported methods. It was well suited for the determination of trace AS in domestic and industrial various water systems collected from Bilaspur city, Chhattisgarh, India. The method has been compared with standard MBAS method.16 The method is a region based technique to determine AS in the newly formed state of Chhattisgarh in India. This work incorporates the method to remediate surfactant concentrations in ground water and surface water and also its application to even more potential contaminated sites possibly beyond water treatment.
References
- Pal, A.; Adak, A.; Bandyopadhyaya, M. Colloids Surf., A 2005, 254, 165-171.
- Schramm, L. L. Surfactant: Fundamentals and Applications in the Petroleum Industry; Cambridge University Press: Cambridge, 2000; p 3.
- Shinoda, K.; Hutchinson, E. J. Phy. Chem. 1962, 66, 577.
- H. Katano, M. Senda, Anal. Sci, 2001, 17, 337
- Rezaei Behbehani, G.; Saboury, A. A.; Taleshi, E. J. Solution Chem. 2008, 37, 619.
- Zhou, G. L.; Chao, S. Y. Fengxi Huaxue 1988, 16, 13.
- Nomura, Y.; Ikebukuro, K.; Yokoyama, K.; Takenchi, T.; Arikawa, Y.; Ohno, S.; Kavube, I. Anal. Lett 1994, 27, 3095.
- Reshetilov, A. N.; Semenchuk, I. N.; Illiasov, P. V.; Taranova, L. A. Anal. Chim. Acta 1997, 34, 19.
- Young, T. E.; Synovec, R. E. Talanta 1996, 43, 88-89.
- Yemy-Walkup, R. G.; Hill, K. D. J. Liq. Chromatogr. 1994, 1, 4087.
- Standard Methods for the Examination of Water and Waste Water, 17th ed.; APHA-AWWA-WPCF, American Public Health Association (APHA): Washington, D.C., 1989.
- Chou, S. H.; Wirth, J. J. Phys. Chem. 1989, 93, 7694.
- Izutsu, K. Electrochemistry in Nonaqueous Solutions, Part I; Wiley-VCH: Weinheim, Germany, 2002.
- Yamamoto, K.; Motomizu, S. Analyst (Cambridge, U. K.) 1987, 112, 1405.
- Rubio-Barroso, S.; Gomez-Rodriguez, M.; Polo-Diez, L. M. Anal Chim. Acta 1988, 206, 351.

This work is licensed under a Creative Commons Attribution 4.0 International License.
![]()
A New Edition of Web of Science
Journal Impact Factor
2022: 0.5
Five Year: 0.8
Journal is Indexed in

Cabells Whitelist
![]()


