Synthesis, Characterization and Antimicrobial Studies of Mn(II), Co(II), Ni(II) Cu(II) and Zn(II) Complexes of (R,E)-2-(Dimethylamino)-3-(4-Hydroxyphenyl)-N,2,3-Trimethyl-N'-(1-P-Tolylethylidene) Butanehydrazide
Phanjoubam Pengkiliya Devi and Rajkumari Lonibala
Department of Chemistry, Manipur University, Canchipur 795003, Imphal, Manipur.
Corresponding Author E-mail: lonirk@yahoo.co.uk
DOI : http://dx.doi.org/10.13005/ojc/330331
A new Schiff base (R,E)-2-(dimethylamino)-3-(4-hydroxyphenyl)-N,2,3-trimethyl-N'-(1-p-tolylethylidene) butanehydrazide, Tmbh and Mn(II), Ni(II), Co(II), Cu(II) and Zn(II) complexes were synthesized and characterized on the basis of analytical, magnetic, cyclic voltammetric, conductometric, UV-Visible, TG/DTA, IR, NMR, EPR and mass spectral data. Tmbh acts as a uninegative/neutral bidentate ligand in all the complexes bonding through carbonyl oxygen and azomethine nitrogen. Half field signal observed in the ESR spectrum of Ni(II) complex is indicative of its dimeric nature and the trend in g-values suggest tetragonally distorted octahedral geometries for Co(II), Ni(II) and Cu(II) complexes. All the complexes exhibit irreversible redox behavior. Morphology of Tmbh and the complexes have also been investigated through SEM and powder XRD data. Antimicrobial effects of the ligand and the complexes against the microbes Bacillus subtilis, Escherichia coli, Psuedomonas aeruginosa and Klebsiella pnuemonia are studied by diffusion method and the results show that the activities are increased upon complexation.
KEYWORDS:Schiff base; Transition metal complexes; Bidentate; Spectral studies; Irreversible redox behavior; Antimicrobial effects
Download this article as:| Copy the following to cite this article: Devi P. P, Lonibala R. Synthesis, Characterization and Antimicrobial Studies of Mn(II), Co(II), Ni(II) Cu(II) and Zn(II) Complexes of (R,E)-2-(Dimethylamino)-3-(4-Hydroxyphenyl)-N,2,3-Trimethyl-N'-(1-P-Tolylethylidene) Butanehydrazide. Orient J Chem 2017;33(3). |
| Copy the following to cite this URL: Devi P. P, Lonibala R. Synthesis, Characterization and Antimicrobial Studies of Mn(II), Co(II), Ni(II) Cu(II) and Zn(II) Complexes of (R,E)-2-(Dimethylamino)-3-(4-Hydroxyphenyl)-N,2,3-Trimethyl-N'-(1-P-Tolylethylidene) Butanehydrazide. Orient J Chem 2017;33(3). Available from: http://www.orientjchem.org/?p=33299 |
Introduction
The chemistry of the Schiff base ligands and their metal complexes has expanded enormously and encompasses a vast area of organometallic compounds and various aspects of bioinorganic chemistry. Being considered as “privileged ligands” because they are mainly prepared by condensation between aldehydes and primary amines, the Schiff bases are treated as one of the most important stereochemical models in transition metal coordination due to their preparative accessibility and structural variety1-4 and represent a resource of probabilities for new design due to their peerless structures and mode of bonding with metal ions. Not only they are able to form complexes with a number of metal ions and to stabilize them in various oxidation states5, but a large number of Schiff bases has also been shown to exhibit a broad range of biological activities, including antitumor, anti-bacterial, fungicidal and anticarcinogenic properties6-11. Interestingly, several studies have shown that metal-bound ligands show better potential biological activity than free ligands12-15. Many metal complexes of Schiff bases with heterocyclic compounds are, therefore, treated as an important class for new drug development and, in fact, find applications as potential drugs16,17 due to the presence of multifunctional groups18,19 such as C=N or -NHN=CH- linkage which is highly essential in drug dealing 20-22. Schiff bases derived from isonicotinic acid hydrazide and their metal complexes are reported to act as antiproliferative agents, and have potential for the treatment of cancer. For example, pyridoxal isonicotinoyl hydrazone and its Fe(III), Ga(III) and Cu(II) complexes are reported to have distinct activity against certain mammary tumors and leukemias in mice23. They are known for their anticonvulsant24-30, anticorrosion31 and pharmacological32-36 activities and also for the treatment of iron overload diseases37-39. Besides, Schiff base ligands and their metal complexes exhibit a wide range of catalytic activities in some polymerization as well as oxidation processes and are, in fact, used in detection, determination and isolation of compounds containing carbonyl group, metal and as analytical reagents in spectrophotometric determination of some species in pharmaceutical formulations40,41.
Considerable attention has also been drawn on the chemistry of amino acid based Schiff bases containing O- and N- donors for their physiological reasons and theses class of compounds display significant biological importance42-46. Amongst the amino acids, Tyrosine is one of the most versatile amino acids, mostly, due to the chemical reactivity of its side chain phenolic moiety. Since tyrosine side chain can be involved in hydrogen bonding, π– π interactions and cation– π interactions, tyrosine residues are widely used in the molecular recognition site of antibodies47. The unique reactivity of the tyrosine residues is attributed to the presence of the acidic proton of the phenol ring48. However, in comparison to the literatures available on the metal complexation and various aspects of other amino acids and related compounds, only a very few reports have been found on the works related to l-tyrosine hydrazide. There are reports on the Ln(III) complexes of l-tyrosine hydrazide49 and Fe(III) complexes of Schiff bases derived from vanillin and amino acids (glycine, L-serine, L-tyrosine and L-phenylalanine)50. Recently, Wang et al.51 presented a Schiff base derived from L-Tyrosine hydrazide which can act as a thermo/ pH-responsive biodynamer. Because of the versatile reactivity of phenolic group in tyrosine, the biodynamer provided a reactive scaffold for conjugation and may find numerous applications in the areas of biotechnology and biotherapeutics.
Based on this background and in continuation to our work on the complexation of Schiff bases52-62, we have synthesized (R,E)-2-(dimethylamino)-3-(4-hydroxyphenyl)-N,2,3-trimethyl-N’-(1-p-tolylethylidene) butanehydrazide, Tmbh (Fig. 1) from the condensation of L-tyrosine hydrazide with 4-methylbenzaldehyde and its Mn(II), Co(II), Ni(II), Cu(II) and Zn(II) complexes. The structural characterization of these newly synthesized ligand and complexes were carried out employing various physicochemical methods. The antimicrobial activities of the Schiff base and complexes against Bacillus subtilis, Psuedomonas aeruginosa, Klebsiella pneumonia and E.Coli have also been studied taking streptomycin and gramicilin as references. We report the results of our studies here.
Materials and Methods
L-tyrosine hydrazide was purchased from Sigma. 4-methylbenzaldehyde, metal chlorides, agar-agar, tetrabutylammonium bromide (TBAB), beef extract and antibiotic drugs, Streptomycin and Gentamycin of 10 µg each were purchased from Hi-media and peptone from Fisher Scientific. All the solvents and other chemicals used in this study were of AR or equivalent grade.
Physical Measurements
Metal and chlorine contents were estimated gravimetrically while hydrazine was estimated volumetrically following the standard procedures63. C, H and N were microanalysed using an Elemental Analyzer Euro-E3000. Infrared spectra were recorded on a PerkinElmer FTIR spectrum 400 in the range of 4000-400 cm-1 using KBr pellets. The electronic absorption solution spectra of the ligand and complexes in DMSO solution were obtained on a Shimadzu UV-Visible 2450 Spectrophotometer. Magnetic susceptibility measurements were performed using a Sherwood magnetic susceptibility balance at room temperature. TG-DT analysis was done using a PerkinElmer STA 6000 Simultaneous Thermal Analyzer. Conductivity of the complexes was measured in 10-3 M DMSO at 25°C employing a Eutech Con 510. ESR spectra were recorded on a Jeol, JES-FA 200 ESR Spectrometer, X-band microwave unit using tempol as field marker. Mass spectra were recorded using LC-MS Water ZQ-4000. The powder XRD patterns were recorded on PAN-analytical diffractometer with CuKα radiation of wavelength 1.5406 Å operating at a voltage of 40kV and a current of 20 mA. The scanning rate was maintained 1.6º mm-1 over 2Ө range of 5-50° employing the reflection mode for scanning. The crystal lattice parameters were determined using the P-Index program, which was based on least squares approach64. SEM images were taken using SEM-FEI Quanta 250. Cyclic voltammetric studies were carried out using a CH602C Electrochemical Analyzer. A Klenzoids Laminar flow was used to study the biological activities.
Antibacterial Assay
The microbial activities of the ligand and the complexes were studied in gram-positive Bacillus subtilis and gram negative Pseudomonas aeruginosa and Escherichia coli by using diffusion method65. The samples were dissolved in DMSO which has no inhibition activity and the sample concentrations were 200, 400 and 800 µmol. 25 ml of neutral sterile agar media were homogenously poured in petriplates (100 mm) for testing the bacterial contribution to the complexes. The incubated test bacteria cultured for 24-48 h at 37°C was spread on each of the solidified media using L-spreader. Each complex solution was deposited in 6 mm diameter dug media and incubated at 37°C for 24 h. Microbial growth inhibition was then monitored by measuring the diameter of the zone of inhibition. Standard antibacterial drugs, streptomycin and gentamicin at 10 mg/disc each, were also screened under similar conditions for comparison. The experiment was recorded thrice and average results of the inhibition zone were calculated.
Synthesis of (R,E)-2-(dimethylamino)-3-(4-hydroxyphenyl)-N,2,3-trimethyl-N’-(1-p-tolylethylidene) butanehydrazide, Tmbh
An ethanolic solution of L-tyrosine hydrazide (2 g in 20 mL) was mixed with 2.5 mL of 4-methylbenzaldehyde in a round bottom flask and the reaction mixture was refluxed for four hours. The solution was kept overnight. The precipitate obtained was collected through suction, recrystallized from hot ethanol and dried in air. Yield, 65 %; m.p. 210⁰C; MS m/z (rel. int.): 299 [M] (99 %) (Fig. 1); Anal. Calcd for C17H18N3O2: C, 67.89; H, 6.96; N, 14.04; N2H4, 10.77%; Found: C, 68; H, 6.40; N, 14.14; N2H4, 10.85%
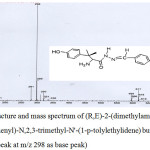 |
Figure 1: Structure and mass spectrum of (R,E)-2-(dimethylamino)-3-(4-hydroxyphenyl)-N,2,3-trimethyl-N’-(1-p-tolylethylidene) butanehydrazide (Tmbh; M+ peak at m/z 298 as base peak) Click here to View figure |
Synthesis of Mn(II) (1), Co(II) (2), Ni(II) (3), Cu(II) (4), Zn(II) (5) complexes
Mn(II), Co(II), Ni(II), Cu(II) and Zn(II) complexes were prepared by refluxing the ethanolic solutions of the ligand (2 g in 25 mL of ethanol, 2 mmol) and the metal chlorides (2.5 g in 10 mL ethanol/methanol, 2 mmol) for 4 h. The precipitate obtained on keeping the reaction mixture overnight was collected through suction, washed with ethanol and dried in air.
Results and Discussion
Analytical data of the complexes (Table 1) shows that (R,E)-2-(dimethylamino)-3-(4-hydroxyphenyl)-N,2,3-trimethyl-N’-(1-p-tolylethylidene) butanehydrazide (Tmbh, LH) reacts with Mn(II), Ni(II), Cu(II) and Zn(II) chlorides in alcoholic media to form complexes of the type [Mn(LH)(H2O)3Cl]Cl·H2O (1), [Co(L)2(H2O)2] 8H2O (2), [Cu(LH)(H2O)4]Cl2·2H2O (4) and [M(LH)(H2O)2Cl2] nH2O (M= Ni, n= 2; M = Zn, n= 1) (3, 5) having different metal-ligand stoichiometries. The complexes are stable under ordinary condition and melt at specific temperatures. They are insoluble in water but soluble/sparingly soluble in common organic solvents. Molar conductance data of the complexes in 0.002 M DMSO at 25°C indicates 1:1 electrolytic behavior for 1 and 3 and 1:2 for 5, nonelectrolytic nature for 2 and 466.
Table 1: Color, melting point, analytical and molar conductance data* (Ω-1cm2mol-1) of the ligand and complexes.
| Ligand/Complexes | M.P.(⁰C) | Color |
% found (Calculated) |
Molar Conductance* | |||||
| C | H | N | Metal | Cl | N2H4 | ||||
| TmbhC17H18N3O2 (LH) | 210 | White | 67.89 (68.00) | 6.96 (6.40) | 14.04 (14.14) | – | – | 10.77(10.85) | – |
| [Mn(LH)(H2O)3Cl]Cl.H2O, 494.94 (1) | 151 | Pink | 40.67(41.22) | 5.09(5.46) | 8.77(8.45) | 10.96 (11.10) | 14.20 (14.35) | 6.80 (6.47) | 63.8 |
| [Co(L)2(H2O)2] 8H2O, 830.93 (2) | 243 | Dark pink | 49.80(49.10) | 9.00(8.91) | 9.99(10.11) | 7.89(7.09) | – | 8.36 (7.70) | 7.24 |
| [Ni(LH)(H2O)2Cl2] 2H2O, 498.69 (3) | 230 | Green | 40.18(40.04) | 5.88(5.41) | 2.41(2.81) | 12.00 (11.79) | 14.17(14.26) | 7.07(6.43) | 30.5 |
| [Cu(LH)(H2O)4]Cl2·2H2O, 539.546 (4) | 144 | Dark green | 38.72(37.85) | 3.20(3.53) | 7.41(7.79) | 10.98 (11.60) | 13.80 (13.17) | – | 115.9 |
| [Zn(LH)(H2O)2Cl2] H2O, 487.38 (5) | 88d | Light yellow | 40.45(41.86) | 5.43(5.13) | 8.07(8.62) | 13.73 (13.33) | 14.20 (14.57) | 7.80 (6.56) | 11.38 |
Thermal Analysis
The TGA-DTA studies of 1-5 were carried out in the temperature range 40 -900°C under N2 atmosphere and the thermal behavior are summarized in Table 2. The results show presence of both lattice and coordinated water molecules in all the complexes. Complexes 1, 3, 4 and 5 experience a mass loss at 207-851°C corresponding to one ligand molecule and two chloride ions in one decomposition step while the weight loss at 240-675°C observed for complex 3 coincides with a mass loss of two ligand molecules. In all cases, the residues are carbon and metal oxides.
Table 2: Thermal dissociation stages with decomposition assignments
| Metal(II): Complexes | Dissociation stages | Temperature range (°C) | Weight loss (mg) found (calcd) | Decomposition assignment |
| Mn(II): 1 | Stage 1 | 46-112 | 0.275 (0.262) | Loss of one lattice water molecule |
| Stage 2 | 115-220 | 0.606 (0.580) | Loss of three coordinated water molecules | |
| Stage 3 | 207-845 | 5.719 (5.448) | Partial decomposition of one ligand and two chloride ions | |
| Co(II): 2 | Stage 1 | 64-112 | 0.902 (0.994) | Loss of eight lattice water molecules |
| Stage 2 | 115-239 | 0.229 (0.228) | Loss of two coordinated water molecules | |
| Stage 3 | 240-675 | 2.140 (1.836) | Loss of two ligand molecules | |
| Ni(II): 3 | Stage 1 | 47-109 | 0.328 (0.368) | Loss of two lattice water |
| Stage 2 | 109-222 | 0.303 (0.294) | Loss of two coordinated water molecule | |
| Stage 3 | 222-793 | 2.398 (2.825) | Loss of one ligand and two Chloride ions | |
| Cu(II): 4 | Stage 1 | 40-103 | 0.305 (0.297) | Loss of two lattice water molecules |
| Stage 2 | 103-196 | 1.200 (1.256) | Loss of four coordinated water molecules | |
| Stage 3 | 328-679 | 5.612 (5.240) | Partial decomposition of one ligand and two chloride ions | |
| Zn(II): 5 | Stage 1 | 41-110oC | 0.219 (0.228) | Loss of one lattice water molecule |
| Stage 2 | 115-250oC | 0.466 (0.506) | Loss of two coordinated water molecules | |
| Stage 3 | 250-851oC | 7.758 (7.646) | Partial decomposition of one ligand and two chloride ions |
Infrared Spectral Studies
The selected IR bands of the ligand and the complexes are given in Table 3 along with their respective assignments. The strong bands at 3362-2920 cm-1 in the spectrum of the ligand due to the NH stretching vibrations of the amide group are highly broadened in the spectra of the complexes and merged with the characteristic bands of the OH– stretching vibrations67 of the water molecules present in the complexes. The IR spectrum of the ligand exhibits bands at 1691, 1444 and 1350 cm-1 that may be assigned to the amide I, II and III modes of the hydrazine while the strong bands at 1612 and 927 cm-1 are assigned to n(CN) and n(NN) modes. In the spectra of complexes 1, 3, 4 and 5, the amide I and II bands show bathochromic shift and the amide III band shows hypsochromic shift indicating participation of the carbonyl oxygen in coordination68. However, in the spectrum of complex 2, these amide bands disappear with appearance of a new strong band at 1606 cm-1. This band may be assigned to n(NCO–) mode indicating deprotonation of the amide group of the ligand and bonding to Co(II) ion through imidol oxygen67. In view of the nonelectrolytic behavior and absence of chloride ions in Co(II) complex 2, the ligand, LH during formation of 1:2 complex probably releases one proton each and acts as a uninegative species, L– so as to balance the +2 charge on cobalt ion. Nonparticipation of the hydroxyl group in complexation is shown by the fact that the strong band observed at 1263 cm-1 in the spectrum of the ligand due to νsym(OH) remains unshifted in the spectra of complexes. Bathochromic shift of 37-67 cm-1 and hypsochromic shift of 17-42 cm-1 suffered, respectively, by the n(CN) and n(NN) bands in the spectra of complexes 1-5 suggest bonding of azomethine nitrogen to the metal ions69. The band at 1109 cm-1 in the spectrum of the ligand due to ω(NH2) does not show any shift in the spectra of the complexes indicating its nonparticipation in bonding70. Appearance of new bands in the range 441-448 cm-1 and 526-553 cm-1 in the spectra of all the complexes are assigned to n(M-O) and n(M-N) modes, respectively, while the bands observed at 416-418 cm-1 in the spectra of 1, 3, 4 and 5 may be due to n(M-Cl) modes71.
Table 3: IR bands of the ligand and complexes
| Ligand/ Complexes | Amides | v(CN) | v(OHsym) | v(NN) | v(MN) | v(MO) | ||
| I | II | III | ||||||
| Tmbh | 1691 | 1444 | 1350 | 1612 | 1263 | 927 | 543 | 488 |
| Mn(II):1 | 1647 | 1429 | 1398 | 1575 | 1255 | 949 | 526 | 443 |
| Ni(II):3 | 1647 | 1419 | 1361 | 1545 | 1234 | 964 | 553 | 441 |
| Cu(II):4 | 1666 | 1421 | 1398 | 1572 | 1271 | 966 | 526 | 445 |
| Zn(II):5 | 1597 | 1425 | 1388 | 1575 | 1265 | 966 | 528 | 443 |
|
(NCO)- |
||||||||
| Co(II):2 |
1606 |
1573 | 1257 | 952 | 528 | 457 | ||
Magnetic Moments and Electronic Absorption Spectral Studies
The electronic absorption spectrum of the ligand exhibits two CT bands where the more intense band at 295 nm may be assigned to the allowed πàπ* transition and the weaker band at 416 nm is due to the forbidden nàπ* transition of the ligand chromophore. The intensity of the band due to n à π* transition increases significantly in the spectra of the complexes indicating formation of the complexes in which energy transfer occurs in between the metals and the ligand.
The µeff value of complex 1 is 4.82 B.M. which is lower than the expected value for high spin Mn(II) complexes. The lowering in magnetic moment may be due to the presence of some antiferromagnetic interactions in high spin Mn(II) complexes and similar results were reported by Luaces et al72 and Wilkinson73. A weak broad band at 524 nm observed in the electronic spectrum of complex 2 may be assigned to the transition 4T1g(P) à4T1g(F) of an octahedron73,74. However, its µeff value, 2.13 B.M. is low for a Co(II) octahedral complex suggesting flattening towards planar arrangement73 or presence of antiferromagnetic coupling in the complex. The magnetic moment value of complex 3 (µeff= 2.87 B.M.) and strong electronic absorption bands at 682 and 774 nm observed in the spectrum of the complex assignable to transitions 3A2g(F) à3T1g(F) and 3A2g à3T2g(F) indicate distorted octahedral geometry around the Ni(II) ion75. The magnetic moment of 4, 1.8 B.M., is normal for one unpaired electron and the electronic absorption spectrum exhibits a broad absorption band at 851 nm assignable to transition 2Eg(D)→2T2g(D) indicating a distorted octahedral geometry around copper ion74.
1H and 13C NMR Spectral Studies of Ligand and Zn(II) Complex
The 1H and 13C NMR spectral data of the ligand and Zn(II) complex 5 are summarized in Table 4. Most of the signals are splitted suggesting existence of more than one isomeric form of the ligand at room temperature which is also supported by the mass spectral features of the ligand and complexes. The -NNHCO- signal suffers upfield shift by δ 1.0 in the spectrum of the complex showing coordination of the azomethine nitrogen and carbonyl oxygen to the metal ion while the signals due to -C6H4(OH) do not show any shift suggesting nonparticipation of this group. Signals due to ring protons and other -CH and -NH protons suffer slight changes in position and intensities perhaps due to change in the chemical environments around the protons upon complexation.
The 13C NMR spectrum of the ligand exhibits a doublet at 171.44, 171.20 ppm due to carbonyl carbon of the -NNHCO moiety and a singlet at 155.96 due to C6H4(CH3)CH-N-, which are, respectively, shifted to 191.34 and 158.5 ppm as singlets in the spectrum of the complex. This observation indicates participation of hydrazidic carbonyl and azomethine nitrogen in coordination. Small shifts suffered by the other 13C signals in the spectrum of the complex as compared to that of the ligand may be explained on the basis of the change in chemical environment due to complex formation.
Table 4: 1H and 13C NMR spectral data* of Tmbh and Complex 5
| Protons | Tmbh | Complex 5 | Carbons | Tmbh | Complex 5 |
| -NNHCO- | 11.0s | 9.9s | -NNHCO- | 171.44, 171.20 | 191.34 |
| -C6H4OH | 8.46s, 8.18s | 8.47s, 8.19s | –CH-N-N- | 155.96 | 158.50 |
| Ring Protons | (6.63- 8.00)m | (6.65-7.94)m | Ring carbons | 114.92-131.30 | 113.70-131.79 |
| -CNH2 | 5.76d | 5.70t | –CH=N | 126.62 | – |
| -CH2– | 3.78d | 3.81d | –CH(NH2)- | 59.54d | 55.64d |
| -NCH– | 2.94m | 2.90m | –C-C- | 35.92 | – |
| -C6H4CH3 | 2.51s | 2.51s | -C6H4CH3 | 20.64 | – |
*Spectra recorded in DMSO-d6. s-singlet, d-doublet; t-triplet; m-multiplet
Electron Spin Resonance Spectral Studies
ESR spectra of all the paramagnetic complexes were recorded at both room (RT) and liquid nitrogen temperatures (LNT) in solid as well as in DMSO solution.
The solid ESR spectra of complex 1 are isotropic in nature with a strong signal centered at g = 2.003 at RT and 1.994 at LNT, while the solution spectra consists of six lines due to hyperfine interaction between the unpaired electrons with 55Mn nucleus (I=5/2) with g values of 1.95 and 2.023 at RT and LNT, respectively. Complex 2 does not exhibit any ESR signal at LNT. However, the RT solid and solution ESR spectra of 2 show small g anisotropy with weak unresolved broad features in the g⊥ region at low field and stronger unresolved broad feature in the g║ region at high field giving the g values, g⊥= 2.286 and g║= 2.018. This type of axial spectrum is typical for tetragonally distorted octahedral d7 species76. Both solid and solution spectra of complex 3 at RT exhibit half field signals at 143 G due to ΔmS= ±1 transition suggesting intramolecular magnetic exchange interaction in a Ni(II) dimer. The solid ESR spectra of complex 4 at RT and LNT and the solution spectrum at RT exhibit unresolved features while the frozen solution spectrum shows four well resolved peaks in the low field region. The g-values obtained are g║= 2.197, g┴= 2.056 and g║= 2.393, g┴= 2.007 in the solid and solution spectra, respectively. The trend in g-values (g║> g┴>ge) indicates tetragonal elongation along the z-axis with the dx2-y2 orbital as the ground state77,78. A relatively high A║ value (109 G) suggests small axial interaction. The bonding parameters viz α2 (covalency of in-plan σ bonds), β2 (in-plan π bonds), γ2 (out-of-plan π bonds) and the orbital reduction factors (K║ and K⊥) were evaluated using the d-d transition energy of the complex (851 nm) and the spin orbit coupling constant for the free Cu(II) ion (λo = 828 cm–1) from the expressions (1-5)77,79.
α2= – (A║/0.036) + (g║ − 2.002) + 3/7(g⊥ − 2.002) + 0.04 (1)
K║2 = (g║ − 2.0023) Ed−d/8λo (2)
K⊥2 = (g⊥ − 2.0023) Ed−d/2λo (3)
K║= α2β2 (4)
K⊥ = α2γ2 (5)
Complete covalent bonding is indicated by 0.5 value of α2 while the value of α2=1.0 indicates complete ionic bonding. The observed value of α2 (0.118) for 4 show high covalent character of the M-L bond in the complex. The β2 (0.588) and γ2 (0.999) values indicate that there is interaction in the in-plane and out-of-plane π-bonding between Cu(II) ion and the ligand. A greater contribution from out-of-plane π-bonding than in-plane π-bonding in the M-L π-bonding is also suggested by higher K║ value (0.693) compared to K⊥ value (0.118). These observations reveal a lower symmetry structure for the complex and thus support distorted octahedral geometry proposed for the Cu(II) complex. The geometric parameter, G= (g║-2)/(g┴-2) calculated for this complex is 5.63 indicating negligible exchange interaction between the Cu-Cu centers in the complex76,80-82.
Cyclic Voltammetric Studies
The electrochemical behavior of the ligand and complexes were examined cyclic voltammetrically in the potential range +0.6 to -2.0 V in 0.005 M DMSO at a scan rate of 100 mV/s using platinum as counter electrode, glassy carbon as working electrode and Ag/AgNO3 as reference electrode. TBAB (0.1M) was used as a supporting electrolyte. The results of the electrochemical study are given in Table 5.
Table 5: Redox reaction data in Cyclic Voltammetric Studies
| Complexes | Anode peak potential, Epa (V) | Ipa, µA | Cathode peak potential, Epc (V) | Ipc, µA | Peak separation, ∆Ep (Epa-Epc) (µA) | Peak current ratio, Ipa/Ipc |
| Tmbh | -0.35 | -3.35 | -1.13 | 6.61 | +0.78 | 0.51 |
| 1 | -0.63 | -2.93 | -0.68 | 5.31 | +0.05 | 0.55 |
| 2 | -0.81 | -1.73 | -0.99 | 1.44 | +0.81 | 0.83 |
| 3 | -0.99 | -1.03 | -1.01 | 1.96 | +0.02 | 0.53 |
| 4 | +0.13 | -6.94 | -0.24 | 4.15 | +0.27 | 1.67 |
| -0.41 | -8.04 | -0.57 | 2.86 | +0.16 | 2.81 | |
| 5 | -0.47 | -1.70 | -0.94 | 1.51 | +0.47 | 1.13 |
The ligand undergoes a redox reaction showing an anodic peak at -0.35 V with a corresponding cathodic potential at -1.13V in the cyclic voltammogram. The cyclic voltammograms of complexes 1, 2, 3 and 5 show one anodic peak and one cathodic peaks each indicating irreversible redox reactions for M(II) 12 ⇌”> M(I) where M=Mn, Co, Ni and Zn. Two oxidation peaks at +0.13V and -0.41V and corresponding reduction peaks at -0.24V and -0.57V observed in the cyclic voltammogram of complex 4 are attributable to the redox reaction Cu(II) 12⇌”> Cu(I). A second anodic peak expected for 1 and 2 are not observed perhaps due to the irreversibility of the reactions. The peak separations (> 59 mV) and the values of the current peak ratio also illustrate irreversible redox behavior83,84 for the ligand and complexes.
XRD powder and SEM studies of the ligand and complexes
Powder X-ray diffraction and electron microscopy techniques are employed to study the morphology of the ligand and its complexes. The XRD powder patterns indicate triclinic and semi-crystalline nature for Tmbh having the following lattice parameters: a=7.85 Å, b=6.94 Å, c=14.88 Å, α=62.63, β=118.10, ɣ=104.16, V=629.31 Å3 while the diffractographs of the complexes do not show sharp defined peaks indicating their amorphous nature.
Scanning electron microscopic (SEM) images of the ligand and its complexes recorded at energy of 20 kV at different magnification exhibit nonspecific shaped particles supporting their non-crystalline nature.
Mass Spectral Studies
The FAB-mass spectra of 1-5 are given in Figures 2-6 along with the tentative structures of the complexes proposed on the basis of elemental and thermal analysis data. The mass spectrum of 1 exhibits the M+ peak at m/z 494 having the proposed composition [Mn(LH)(H2O)3Cl]Cl·H2O. The weak peak at m/z 439 corresponds to [Mn(LH)(H2O)Cl]Cl+ while the medium peak at m/z 853 indicates possible formation of a dimer [Mn(LH)(H2O)2Cl]2 though elemental analysis data are compatible with formation of a monomer. In the mass spectrum of 2, the peaks at m/z 446 and 831 correspond to the compositions [Co(L)(H2O)2] 3H2O and [Co(L)2(H2O)2] 8H2O, respectively. The mass spectrum of complex 3 shows a weak peak at m/z 498 corresponding to composition [Ni(LH)(H2O)2Cl]Cl·2H2O. The peaks observed in the mass spectrum of 4 at m/z 537 and 448 are due to molecules [Cu(LH)(H2O)4]Cl2·2H2O and [Cu(LH)(H2O)]Cl2, respectively. The weak band at m/z 484 observed in the spectrum of complex 5 corresponds to molecular formula [Zn(LH)(H2O)2Cl2]H2O proposed on the basis of elemental and thermal analysis data. The remaining peaks observed at m/z< molecular mass in the spectra of the complexes are due to the mass of the fragments obtained after the complex loses different parts of the ligand while appearance of the peaks at m/z > molecule mass suggests rearrangement of the fragments or collision of the molecular ions with neutral atoms or molecules85. The mass spectra of the complexes except that of 4 exhibit peaks at m/z higher than 800 which also suggests possible existence of polymers or complexes with higher metal:ligand stoichiometries. Thus, the peak at m/z 853 in the spectrum of 2 supports formation of a dimer [Co(L)(H2O)2]2 4H2O and the weak peaks at m/z 821 observed in the spectra of complexes 3 and 5 may be resulted from the further arrangement of the molecular ion with the ligand molecule or fragments of the ligand.
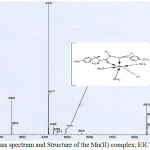 |
Figure 2: Mass spectrum and Structure of the Mn(II) complex; EIC at m/z 416
|
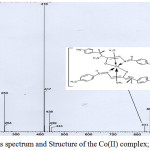 |
Figure 3: Mass spectrum and Structure of the Co(II) complex; EIC at m/z 416 |
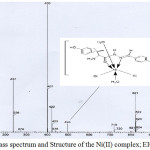 |
Figure 4: Mass spectrum and Structure of the Ni(II) complex; EIC at m/z 400 Click here to View figure |
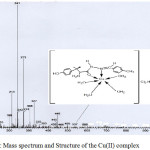 |
Figure 5: Mass spectrum and Structure of the Cu(II) complex
|
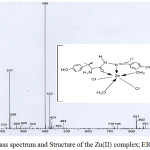 |
Figure 6: Mass spectrum and Structure of the Zn(II) complex; EIC at m/z 400
|
Antibacterial activity
The ligand and complexes synthesized in the present investigation have been subjected to antimicrobial screening against Bacillus subtilis as gram positive and Esherichia coli, Psuedomonas aeruginosa and Klebsiella pneumonia as gram negative so as to ascertain their activity against different microorganisms. The test results obtained are listed in Table 6. Antibacterial data for Streptomycin and Gentamycin are also included in this table for the purpose of comparison.
Table 6: Antibacterial properties of Tmbh and complexes
| Complexes | Bacteria | Inhibition zone (mm) at different concentration (µmol) | ||
| 200 | 400 | 800 | ||
| Tmbh (LH) | Bacillus subtilisE.coliPsuedomonas aeruginosaKlebsiella pneumonia | 0000 | 0000 | 111100 |
| 1 | Bacillus subtilisE.coliPsuedomonas aeruginosaKlebsiella pneumonia | 0000 | 0000 | 121000 |
| 2 | Bacillus subtilisE.coliPsuedomonas aeruginosaKlebsiella pneumonia | 0000 | 0000 | 101000 |
| 3 | BacillussubtilisE.coliPsuedomonas aeruginosaKlebsiella pneumonia | 0000 | 14000 | 1501111 |
| 4 | Bacillus subtilisE.coliPsuedomonas aeruginosaKlebsiella pneumonia | 0000 | 10000 | 120011 |
| 5 | Bacillus subtilisE.coliPsuedomonas aeruginosaKlebsiella pneumonia | 10000 | 11000 | 1516011 |
| Streptomycin (10 µg)) | Bacillus subtilis | 22 | ||
| Gentamicin (10 µg) | E.coliPsuedomonas aeruginosaKlebsiella pneumonia | 242424 | ||
The table shows that there are significant differences in the antibacterial activities shown by the ligand and the complexes. The ligand displays strong antibacterial activities against Bacillus subtilis and Esherichia coli and no activity against Psuedomonas aeruginosa and Klebsiella pneumonia while the complexes show selectiveness in displaying the antibacterial activities as observed in the table. This may be explained by chelation theory where reduction in the polarity of the metal ions on chelation with the ligand enhances the penetration of the complexes into lipid membranes and thus blocking the metal binding sites in the enzymes of the bacteria. Activity is observed at higher concentration and the optimum concentration is 800 µmol. Activities against the microbes increase on complexation and of all the complexes, Ni(II) and Zn(II) complexes, 3 and 5 exhibit highest activity. These results suggest that the ligand and its complexes have potential antibacterial properties and may be used as antibacterial agents in formulation of drugs.
Conclusions
The results of the present study show that (R,E)-2-(dimethylamino)-3-(4-hydroxyphenyl)-N,2,3-trimethyl-N’-(1-p-tolylethylidene) butanehydrazide forms stable Co(II), Ni(II), Cu(II) and Zn(II) complexes in alcoholic medium having different metal:ligand stoichiometries. Elemental and thermal analysis data show presence of both lattice and coordinated water molecules in all the complexes. All the complexes are hexacoordinated having distorted octahedral geometry. The ligand bonds to Co(II) ion as a dinegative species through amido-O and azomethine-N while it coordinates to Mn(II), Ni(II), Cu(II) and Zn(II) complexes as a neutral bidentate species bonding through carbonyl-O and azomethine-N. Subnormal μeff values observed for Mn(II) and Co(II) complexes suggest possible presence of antiferromagnetic interactions. ESR spectral features and parameters indicate tetragonally distorted geometries for the complexes. The ligand and the complexes show irreversible redox behavior. The ligand exhibits broad spectrum activities against bacteria isolates used and the antimicrobial activities are found to increase upon complexation. Single crystals of the complexes could not be grown due to insufficient solubility and therefore, in absence of single crystals, the structures of the complexes 1-5 are tentatively proposed based on the elemental, thermal and spectral data and the proposed structures are supported by their mass spectra.
Acknowledgements
We acknowledge DST, New Delhi for the financial assistance for carrying out the work vide SERB-DST File no. SR/S1.IC-13/2012 dated 13th Sept, 2012 and UGC, New Delhi for awarding BSR fellowship to one of us (PPD). We also thank Physics Department, Manipur University for SEM and XRD studies, SAIF, CDRI, Lucknow for mass spectra and CHN analysis and SAIF, NEHU, Shillong for NMR spectra.
References
- Hursthouse, M. B.; Jayaweera, S. A. A.; Smith, A. J. Chem. Soc. Dalton Trans. 1979, 279-313.
CrossRef - Liang, Y. L.; Liu, C. M.; Ma, Y. X.; Li, Q. S. Transition Met. Chem. 1998, 23, 97-99.
CrossRef - Keypour, H.; Razaeivala, M; Valencia, L; Lourido, P.P; Khavasi, H.R. Polyhedron 2009, 17(28), 3755-3758.
CrossRef - Zoubi, W. Al. International J. Org. Chem. 2013, 3(3A), 73-95.
CrossRef - Ejidike, I.P.; Ajibade, P.A. Molecules 2015, 20(6), 9788–9802.
CrossRef - Nagesh, G.Y.; Raj, K.M.; Mruthyunjayaswamy, B.H.M. J. Mol. Struct. 2015, 1079, 423–432.
CrossRef - Salehi, M.; Amoozadeh, A.; Salamatmanesh, A.; Kubicki, M.; Dutkiewicz, G.; Samiee, S.; Khaleghia, A. J. Mol. Struct. 2015, 1091, 81–87.
CrossRef - Shukla, S.; Srivastava, R.S.; Shrivastava, S.K.; Sodhi, A.; Kumar, P. Med. Chem. Res. 2013, 22, 1604–1617.
CrossRef - Zaltariov, M. F.; Cazacu, M.; Avadanei, M.; Shova, S.; Balan, M.; Vornicu, N. Polyhedron 2015, 100, 121–131.
CrossRef - Zayed, E.M.; Zayed, M.A. Spectrochim. Acta A Mol. Biomol. Spectrosc. 2015, 143, 81–90.
CrossRef - Katerina, H.; Kovarikova, P.; Bendova, P.; Haskova, P.; Mackova, E.; Stariat, J.; Vavrova, A.; Vavrova, K.; Simunek, T. Chem. Res. Toxicol. 2011, 24(3), 290–302.
CrossRef - Du, Y.; Chen, W.; Fu, X.; Deng, H.; Deng, J. G. RSC Adv. 2016, 6(111), 109718-109725.
CrossRef - Jansson, P. J.; Sharpe, P. C.; Bernhardt, P. V.; Richardson, D. R. J. Med. Chem. 2010, 53(15), 5759- 5769
CrossRef - Lovejoy, D. B.; Jansson, P. J.; Brunk, U. T.; Wong, J.; Ponka, P.; Richardson, D. R. Cancer Res. 2011, 71(17), 5871-. 5880.
- Bernhardt, P. V.; Sharpe, P. C.; Islam, M.; Lovejoy, D. B.; Kalinowski, D. S.; Richardson, D. R. J. Med. Chem. 2009, 52(2), 407-415.
CrossRef - Andersen, O. Chem. Rev. 1999, 99(9), 2683–2710.
CrossRef - Konstantinovic, S.S.; Radovanovic, B.C.; Cakic, Z.; Vasic, V. J. Serb. Chem. Soc. 2003, 68(8-9), 641–647.
CrossRef - Chohan, Z.H.; Pervez, H,; Rauf, A.; Khan, K.M.; Supuran, C.T. J. Enzyme Inhib. Med. Chem. 2004, 19(5), 417–423.
CrossRef - Joseyphus, R.S.; Dhanaraj, C.J.; Nair, M.S. Transition Met. Chem. 2006, 31(6), 699–702.
- Liu, W.L.; Zou, Y.; Ni, C.L.; Li, Y.Z.; Meng, Q. J. J. Mol. Struc. 2005, 751(1-3), 1–6.
CrossRef - Shuvaev, K. V.; Dawe, L. N.; Thompson, L. K. Eur. J. Inorg. Chem. 2010, 2010(29), 4583–4586.
CrossRef - Tarafder, M. T.; Chew, H. K.; Crouse, B. K. A.; Ali, A. M.; Yamin, B. M, ; H. K. Fun. Polyhedron 2002, 21(27), 2683–2690.
CrossRef - Liu, W.L.; Zou, Y.; Ni, C.L.; Li, Y.Z.; Meng, Q.J. J. Mol. Struc. 2005, 751(1-3), 1–6.
CrossRef - Singh, M.; Raghav, N. Int. J. Pharm. Sci. 2011, 3(4), 26-32.
- Rollas, S.; Kucukguzel, S. G. Molecules 2007, 12(8), 1910-1939.
CrossRef - Dimmock, J.R.; Vashishtha, S.C.; Stables, J.P. Eur. J. Med. Chem. 2000, 35(2), 241-248.
CrossRef - Cakir, B.; Dag. O.; Yildirim, E.; Erol, K.; Sahin, M. F. S. J. Fac. Pharm. Gazi. 2001, 18(2), 99-106.
- Ragavendran, J.V.; Sriram, D.; Patel, S. K.; Reddy, I. V.; Bharathwajan, N.; Stables, J.; Yogeeswari, P. Eur. J. Med. Chem. 2007, 42(2),146-151.
CrossRef - Kadaba, P. K.; Lin, Z.; United States Patent No.–5. 1999, 942, 527.
- Sridhar, S.K.; Pandeya, S.N.; Stables, J.P.; Ramesh, A. Eur. J. Pharm. Sci. 2002, 16(3), 129-132.
CrossRef - Antonijevic, M.; Petrovic, M. International J. Electrochem. Sci. 2008, 3(1), 1-28.
- Haran, R.; Gairin, J.; Commenges, G. Inorg. Chim. Acta. 1980, 46, 63-67.
CrossRef - Eyer, P.; Hell, W. Arch. Pharm. (Weinheim) 1986, 319, 558-566.
CrossRef - Zishen, W.; Zigi, G.; Zhenhuan, Y. Synth. React. Inorg. Met.-Org. Chem. 1990, 20(3), 335-344
CrossRef - Rudolph, T.; Phillips, J. P. Anal. Chim. Acta. 1996, 34, 235-237..
CrossRef - Parashar, R. K.; Sharma, R. C.; Anilkumar; Mohon, G. Inorg. Chim. Acta. 1998, 151, 201-208.
CrossRef - Edward, J.T. Biometals 1998, 11(3), 203- 205.
CrossRef - Edward, J.T.; Ponka, P.; Richardson, D.R. Biometals 1995, 8, 209-217.
CrossRef - Becker, E.; Richardson, D.R. J. Lab. Clin. Med. 1999, 134(5), 510-521.
CrossRef - Mohamad, M.E.; Shakdofa.; Majed, H.; Shtaiwi.; Nagy Morsy.; Tayseer, M.A.; Abdel-rassel. A review, Main Group Chem. 2014, 13, 187–218.
- Gallego, M.; Garcia- Vargas, M.; Valcaral, M. Analyst, 1979, 104, 613-619.
CrossRef - Prakash, A.; Adhikari D. Int. J. Chem. Tech.Res. 2011, 3(4), 1891-1896.
- Abdel Rahman, L.H.; El-Khatib, R.M.; Nassr, L.A.; Abu Dief, A.M. J. Molec. Struc. 2013, 1040, 9-18.
CrossRef - Neelakanton, M.; Rusalraj, A.; Dharmaraja, F.; Johnsonraja, J. Spectrochim. Acta, part A: Molecular and Biomolecular Spect. 2008, 91, 1599-1609.
- Moradi, S.; Amini, Z.; Boghaei, Z.; Notash, D. Polyhedron, 2013, 53(10), 76-82.
CrossRef - Dogan, A.; Esma, C.; Boghaei, D. M. ; Notash, B. J. Sol. Chem. 2014, 33, 1539-1547.
CrossRef - Koide, S.; Sidhu, S. S. ACS Chem. Biol. 2009, 4(5), 325-334.
CrossRef - Hermans, J.; Leach, S. J.; Scheraga, H. A. J. Am. Chem. Soc. 1963, 85(10), 1390–1395.
CrossRef - Rao, T. R.; Khan, I. A. Proc. Indian Acad. Sci. (Chem. Sci.), 1987, 98(4), 273-278.
- Shaheen, Al.; Amira, J.; Mula, Al.; Miaa, A. Res. J. Chem. Sci. 2014, 4(8), 25-32.
- Wang, L.; Liu, L.; Wu, L.; Liu, L.; Wang, X.; Yang S.; Zhao, H. RSC Adv. 2015, 5, 30456–30463.
CrossRef - Lonibala, R.K.; Rao, T.R.; Devi, R.K.B. J. Chem. Sci. 2006, 118(4), 327-334.
CrossRef - Sharmeli, Y.; Lonibala, R.K. J. Chem. Eng. Data 2009, 54(1), 28-34.
CrossRef - Lonibala, R.K.; Devi, N.I.; Devi, R.K.B.; Rao, T.R. Synth. React. Inorg. Met.-Org. Chem. 2001, 31(1), 179-194.
CrossRef - Rao, T. R.; Lonibala, R. K. Cryst. Res. Technol. 1991, 26, K1 –K4.
CrossRef - Singh, G.; Shastry, P. S. S. J.; Lonibala, R. K.; Rao, T. R. Synth. React. Inorg. Met.-Org. Chem. 1992, 22(7), 1040–1059.
- Sharmeli, Y.; Lonibala, R. K. J. Chem. Eng. Data 2009, 54(1), 28–34.
CrossRef - Sharmeli, Y.; Lonibala, R. K. Asian J. Chem. 2010, 22(10), 7541–7550.
- Varam, Y.; Lonibala, R.K. J. Sol. Chem. 2016, 45(12), 1729- 1754.
- Devi, T. P.; Lonibala, R. K. Oriental J. Chem. 2014, 30(4), 2029-2035.
- Devi, T.P.; Pengkiliya, P.; Lonibala, R.K. S. Afr. J. Chem. 2014, 67, 218–225.
- Yuimi, V.; Lonibala, R. K. J. Mol. Liq. 2017, 227,127–138.
CrossRef - Vogel. A. I. A Textbook of Quantitative Inorganic Analysis, 3rd Ed., Longman, England, 1961.
- Shirley, R. BARC, Mumbai, India.
- Greenwood D.; Slack R.; Peurtherer J. Medical Microbiology: A Guide to Microbial Infections: Pathogenesis, Immunity, Laboratory Diagnosis and Control, 14th Ed., Churchill Livingstone, Edinburgh, United Kingdom. 1992, 407-408.
- Geary, W. J. Coord. Chem. Rev. 1971, 7(1), 81-122.
CrossRef - Rao, C. N. R. Chemical Applications of Infrared Spectroscopy, Academic Press, New York 1963.
- Sayed L. El.; Iskander M. F. J. Inorg. Nucl. Chem. 1971, 33(2) ,435-443.
CrossRef - Braibanti A.; Dallavale F.; Pellinghelli, M. A.; Leporati, E. Inorg. Chem. 1968, 7(7), 1430-1433.
CrossRef - Nakamoto, K. Infrared and Raman Spectra of Inorganic and Coordination Compounds, 4th Ed., Wiley, New York. 1986.
- Inomata, T.; Moriwaki, T. Bull. Chem. Soc. Jpn. 1973, 46(4), 1148-1154.
CrossRef - Luaces, L.; Bermejo, M. R.; Garcia-Vazquez, J. A.; Romero, J.; Sousa, A.; Pritchard, R. G.; McAuliffe, C. A.; Mugnier, Y. Polyhedron 1996, 15(21), 3717-3724.
CrossRef - Wilkinson, G.; Gillard, R.; McCleverty, J. A. Comprehensive Coordination Chemistry, Pergamon Press, Oxford 1989, 28(6) 786-790.
- Lever, A. B. P. Inorganic Electronic Spectroscopy, Elsevier, Amsterdam. 1968.
- Nicholls, D. Comprehensive Inorg. Chem. 1973, 24, 1053.
- West, D. X. J. Inorg. Nucl. Chem. 1981, 43(12), 3169-3174.
CrossRef - Figgis, B. N. Introduction to Ligand Fields, John Wiley & Sons, New York 1976.
- Tomlinson, A. A. G.; Hathaway, B. J. J. Chem. Soc. (A), 1968, 7(1160), 1685-1688.
CrossRef - Landschoot, R. C. V.; Hest, J. A. M. V.; Reedjik J. J. Inorg. Nucl. Chem. 1976, 38(1), 185-190.
CrossRef - Rockenbauer, A. J. Magn. Res. 1979, 35(3), 429-438.
- Madhukar, K.; Madhu, B.; Sastry, B. A.; Ponticelli, G.; Massacesi, M. Polyhedron, 1989, 8(7), 935-940.
CrossRef - Goodman, B. A.; Raynor, J. B. Adv. Inorg. Chem. Radiochem. 1970, 13, 135-362.
CrossRef - David, K.; Gosser, Jr. Cyclic Voltammetry, Simulation and Analysis of Reaction Mechanisms, Wiley-VCH, New York. 1993.
- Kulkarni, A. D.; Patil, S. A.; Badami, P. S. Int. J. Electrochem. Sci. 2009, 4, 717 -729.
- Syamal, A. Coord. Chem. Rev. 1975, 16(4), 309-339.
CrossRef

This work is licensed under a Creative Commons Attribution 4.0 International License.
![]()
A New Edition of Web of Science
Journal Impact Factor
2022: 0.5
Five Year: 0.8
Journal is Indexed in

Cabells Whitelist
![]()


