Thermodynamics and Mechanism of Silicon Reduction by Carbon in a Crucible Reaction
Vladimir Alexandrovich Grachev
A. N. Frumkin Institute of Physical Chemistry and Electrochemistry RAS 31, Bldg 4, Leninsky prospect, 119071, Moscow, Russia.
Corresponding Author E-mail: mtrushin@mail.ru
DOI : http://dx.doi.org/10.13005/ojc/320612
In the paper, the authorhas represented a thermodynamic analysis of a crucible reaction, which takes placein crucible induction furnaces. The author has suggested a diagram of a crucible reaction that took into account partial pressure and activity of the components participating in the process. The author has defined more exactly what effect the elements usually present in cast iron (Mn, S, P) and main alloying elements (Cr, Ni, Al, Cu) had on activity and equilibrium concentrations of carbon and silicon in cast iron. The electrochemical mechanism of a crucible reaction has been studied. The author has proved that electrical current had influence on the process. The obtained data allow improving the technology of cast iron induction melting.
KEYWORDS:cast iron melting; electric induction furnace; crucible reaction; thermodynamics; electrochemical mechanism of reaction
Download this article as:| Copy the following to cite this article: Grachev V. A. Thermodynamics and Mechanism of Silicon Reduction by Carbon in a Crucible Reaction. Orient J Chem 2016;32(6). |
| Copy the following to cite this URL: Grachev V. A. Thermodynamics and Mechanism of Silicon Reduction by Carbon in a Crucible Reaction. Orient J Chem 2016;32(6). Available from: http://www.orientjchem.org/?p=26225 |
Introduction
Metal melting is a complex physical-chemical process of a metal’s simultaneous heating, melting, and overheating over melting temperature and interaction with the gas phase and the reaction products, which change from the metallic state to the oxide and form a slag. In foundry operations cast iron melting or the so-called secondary cast iron melting is carried out in coke and gas cupolas, induction-type and electric arc furnaces. Cast iron melting in a foundry conductor is increasingly done in electric induction furnaces [1,2]. While in Russia in 2010, 60% of all cast iron was smelted in cupola furnaces and 40% –in electric induction furnaces, by 2014electric induction furnaces accounted for 60% of all cast iron produced and only 40% was produced in cupola furnaces.
Method
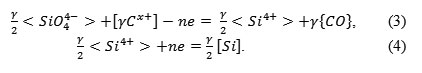
One of the most important aspects of cast iron melting in an induction furnace is the crucible reaction’s process:
![]()
The equilibrium of this reaction, depending on the temperature, is described by the diagram of equilibrium values [Si] and [C] (it is also being called Olsen – Roche – Orts diagram) (Figure 1a). This diagram was made more precise by the value in Neumann and Dötsch research [7]. All the authors believed that
![]()
However,
![]()
can be assumed only in a completely new lining. A worn out, or in other words previously used, liner has a SiO2 content of 60-65%, and accordingly, the value of
![]()
changes. The migration of the point of intersection of the lines DG –Тfor CO and SiO2, when and
![]()
is shown in the Figure 2. With that,
![]()
may be significant for vacuum melting; under real conditions of induction melting, the CO pressure reaches 2.5 atm or more.
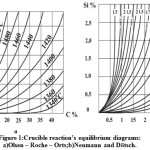 |
Figure 1: Crucible reaction’s equilibrium diagrams: а)Olsen – Roche – Orts;b)Neumann and Dötsch. |
For the crucible reaction, the real values of decrease from 1 to 0.6 as the reaction proceeds. Real pressure values for industrial furnaces reach 3 atm. Figure 2 shows the change in pressure by height for various induction furnaces, calculated using the formula:
![]()
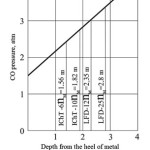 |
Figure 2: CO pressure in industrial electric induction furnaces. |
It is clear that for the initial period of CO formation, when the radius of its emerging bubble is insignificant, a substantial resistance to the proceeding of the crucible reaction is possible.
When analyzing Neumann and Dötsch’sand our data, the equilibrium of the crucible reaction must be considered in the interval of pressure
![]()
from 1.5 to 3 atm and in the interval of activity
![]()
from 0.6 to 1. A refined diagram, based on the aforementioned assumption, is shown in Figure 3. It is clear, that for the bottom part of the crucible
![]()
the probability of the crucible reaction proceeding is substantially lower than for the upper part
![]()
Crucible reaction inhibition due to the decrease in SiO2 activity is also quite noticeable.
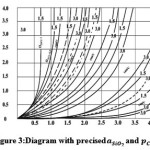 |
Figure 3: Diagram with precised and αSIO2 and ρCO Click here to View figure |
The update of the Olsen – Roche – Orts diagram, performed by Neumann and Dötsch, affected the activities αc and αsi with due account for their mutual influence (Figure 1b).
Results
The author clarified the effect of elements usually present in cast iron (Mn, S, P), as well as the effect of main alloying elements (Cr, Ni, Al, Cu) on activity and equilibrium concentrations of carbon and silicon in cast iron.
The calculation, taking into account the influence coefficients ɛCMn, ɛCS and other, ɛCjand ɛSij according to Elliott[3], allowed to calculate the corrections of the equilibrium values of C and Si (Table 1 and 2).
Table 1:Change in equilibrium concentration of carbon depending on the content of elements
|
C |
1.0 |
||||
|
Mn |
0.5 |
1.0 |
1.5 |
||
|
∆CMn |
-0.0134 |
-0.0270 |
-0.0407 |
||
|
S |
0.02 |
0.1 |
0.15 |
||
|
∆CS |
+0.002 |
+0.0201 |
+0.0151 |
||
|
P |
0.02 |
0.1 |
0.15 |
0.5 |
|
|
∆CP |
+0.0023 |
+0.0113 |
+0.0169 |
+0.0444 |
|
|
Cr |
0.5 |
1.0 |
5.0 |
10.0 |
15.0 |
|
∆CCr |
-0,0271 |
-0.0550 |
-0.3065 |
-0.7021 |
-1.2144 |
|
Ni |
0.5 |
9 |
17 |
||
|
∆CNi |
+0.0135 |
+0.2172 |
+0.3713 |
||
|
Cu |
0.5 |
1.0 |
2.7 |
||
|
∆CCu |
+0.0178 |
+0.0353 |
+0.0927 |
||
|
Al |
0.1 |
1.4 |
3.0 |
10.0 |
|
|
∆CAl |
+0.0095 |
+0.1234 |
+0.5423 |
+0.5774 |
|
|
C |
2.0 |
||||
|
Mn |
0.5 |
1.0 |
1.5 |
||
|
∆CMn |
-0.0259 |
-0.0521 |
-0.0787 |
||
|
S |
0.02 |
0.1 |
0.15 |
||
|
∆CS |
+0.0039 |
+0.0194 |
+0.0291 |
||
|
P |
0.02 |
0.1 |
0.15 |
0.5 |
|
|
∆CP |
+0.0044 |
+0.0219 |
+0.0327 |
+0.1068 |
|
|
Cr |
0.5 |
1.0 |
5.0 |
10.0 |
15.0 |
|
∆CCr |
-0.0271 |
-0.0550 |
-0.3065 |
-0.7021 |
-1.2144 |
|
Ni |
0.5 |
9 |
17 |
||
|
∆CNi |
+0.0135 |
+0.2172 |
+0.3713 |
||
|
Cu |
0.5 |
1.0 |
2.7 |
||
|
∆CCu |
+0.0344 |
+0.0683 |
+0.1794 |
||
|
Al |
0.1 |
1.4 |
3.0 |
10.0 |
|
|
∆CAl |
+0.0183 |
+0.2391 |
+0.4707 |
+1.1319 |
|
|
C |
3.0 |
||||
|
Mn |
0.5 |
1.0 |
1.5 |
||
|
∆CMn |
-0.0376 |
-0.0756 |
-0.1141 |
||
|
S |
0.02 |
0.1 |
0.15 |
||
|
∆CS |
+0.0057 |
+0.0282 |
+0.0422 |
||
|
P |
0.02 |
0.1 |
0.15 |
0.5 |
|
|
∆CP |
+0.0064 |
+0.0318 |
+0.0475 |
+0.155 |
|
|
Cr |
0.5 |
1.0 |
5.0 |
10.0 |
15.0 |
|
∆CCr |
-0.0760 |
-0.1538 |
-0.8500 |
-1.9318 |
-3.3079 |
|
Ni |
0.5 |
9.0 |
17.0 |
||
|
∆CNi |
+0.0743 |
+0.6132 |
+1.0551 |
||
|
Cu |
0.5 |
1.0 |
2.7 |
||
|
∆CCu |
+0.0500 |
+0.0991 |
+0.2607 |
||
|
Al |
0.1 |
1.4 |
3.0 |
10.0 |
|
|
∆CAl |
+0.0266 |
+0.3477 |
+0.6863 |
+1.6651 |
|
|
C |
4.0 |
||||
|
Mn |
0.5 |
1.0 |
1.5 |
||
|
∆CMn |
-0.0485 |
-0.0975 |
-0.1472 |
||
|
S |
0.02 |
0.1 |
0.15 |
||
|
∆CS |
+0.0073 |
+0.0364 |
+0.0545 |
||
|
P |
0.02 |
0.1 |
0.15 |
0.5 |
|
|
∆CP |
+0.0082 |
+0.0410 |
+0.0613 |
+0.2003 |
|
|
Cr |
0.5 |
1.0 |
5.0 |
10.0 |
15.0 |
|
∆CCr |
-0.0980 |
-0.1984 |
-1.0924 |
-2.4731 |
-4.2157 |
|
Ni |
0.5 |
1.0 |
2.7 |
||
|
∆CNi |
+0.0487 |
+0.1280 |
+0.3711 |
||
|
Cu |
0.5 |
1.0 |
2.7 |
||
|
∆CCu |
+0.0645 |
+0.1280 |
+0.3711 |
||
|
Al |
0.1 |
1.4 |
3.0 |
10.0 |
|
|
∆CAl |
+0.0344 |
+0.4498 |
+0.8902 |
+2.1778 |
|
Table 2: Change in equilibrium concentration of silicon depending on the content of elements
|
Si |
0.5 |
|||
|
Mn |
0.5 |
1.0 |
1.5 |
|
|
∆SiMn |
+0.0020 |
+0.0059 |
+0.0019 |
|
|
S |
0.02 |
0.1 |
0.15 |
|
|
∆SiS |
+0.0020 |
+0.0066 |
+0.0088 |
|
|
P |
0.02 |
0.1 |
0.15 |
0.5 |
|
∆SiP |
+0.0020 |
+0.0113 |
+0.0181 |
+0.0568 |
|
Cr |
0.5 |
10.0 |
1.0 |
15.0 |
|
∆SiCr |
0 |
0 |
0 |
0 |
|
Ni |
0.5 |
9.0 |
17.0 |
|
|
∆SiNi |
+0.0022 |
+0.0507 |
+0.0925 |
|
|
Cu |
0.5 |
1.0 |
2.7 |
|
|
∆SiCu |
+0.0072 |
+0.0217 |
+0.0420 |
|
|
Al |
0.1 |
1.4 |
3.0 |
10.0 |
|
∆SiAl |
+0.0064 |
+0.0847 |
+0.1602 |
+0.3497 |
|
Si |
1.0 |
|||
|
Mn |
0.5 |
1.0 |
1.5 |
|
|
∆SiMn |
+0.0031 |
+0.0050 |
+0.0072 |
|
|
S |
0.02 |
0.1 |
0.15 |
|
|
∆SiS |
+0.0040 |
+0.0131 |
+0.0191 |
|
|
P |
0.02 |
0.1 |
0.15 |
0.5 |
|
∆SiP |
+0.0040 |
+0.0256 |
+0.0345 |
+0.1158 |
|
Cr |
0.5 |
1.0 |
10.0 |
15.0 |
|
∆SiCr |
0 |
0 |
0 |
0 |
|
Ni |
0.5 |
9.0 |
17.0 |
|
|
∆SiNi |
+0.0044 |
+0.0997 |
+0.1831 |
|
|
Cu |
0.5 |
1.0 |
2.7 |
|
|
∆SiCu |
+0.0176 |
+0.0307 |
+0.0851 |
|
|
Al |
0.1 |
1.4 |
3.0 |
10.0 |
|
∆SiAl |
+0.0128 |
+0.1664 |
+0.3194 |
+0.6977 |
|
Si |
2.0 |
|||
|
Mn |
0.5 |
1.0 |
1.5 |
|
|
∆SiMn |
+0.0069 |
+0.0119 |
+0.0371 |
|
|
S |
0.02 |
0.1 |
0.15 |
|
|
∆SiS |
+0.0068 |
+0.0261 |
+0.0354 |
|
|
P |
0.02 |
0.1 |
0.15 |
0.5 |
|
∆SiP |
+0.0119 |
+0.0460 |
+0.0697 |
+0.2287 |
|
Cr |
0.5 |
1.0 |
5.0 |
10.0 |
|
∆SiCr |
0 |
0 |
0 |
0 |
|
Ni |
0.5 |
9.0 |
17.0 |
|
|
∆SiNi |
+0.0123 |
+0.2019 |
+0.3626 |
|
|
Cu |
0.5 |
1.0 |
2.7 |
|
|
∆SiCu |
+0.0337 |
+0.0646 |
+0.1699 |
|
|
Al |
0.1 |
1.4 |
3.0 |
10.0 |
|
∆SiAl |
+0.0254 |
+0.3321 |
+0.6343 |
+1.3889 |
|
Si |
3.0 |
|||
|
Mn |
0.5 |
1.0 |
1.5 |
|
|
∆SiMn |
+0.0104 |
+0.0162 |
+0.0221 |
|
|
S |
0.02 |
0.1 |
0.15 |
|
|
∆SiS |
+0.0161 |
+0.0389 |
+0.0558 |
|
|
P |
0.02 |
0.1 |
0.15 |
0.5 |
|
∆SiP |
+0l0162 |
+0.0686 |
+0.1084 |
+0.3390 |
|
Cr |
0.5 |
1.0 |
5.0 |
10.0 |
|
∆SiCr |
0 |
0 |
0 |
0 |
|
Ni |
0.5 |
9.0 |
17.0 |
|
|
∆SiNi |
+0.0174 |
+0.2964 |
+0.5372 |
|
|
Cu |
0.5 |
1.0 |
2.7 |
|
|
∆SiCu |
+0.0488 |
+0.0920 |
+0.2471 |
|
|
Al |
0.1 |
1.4 |
3.0 |
10.0 |
|
∆SiAl |
+0.0379 |
+0.4941 |
+0.9463 |
+2.0743 |
These data show that decrease in carbon activity due to presence of manganese in the cast iron sample is equivalent to a decrease in carbon concentration by 0.1%. A positive change in carbon activity due to presence of sulfur and phosphorus in quantities that are natural for cast iron samples (0.1-0.15%) is equivalent to an increase in carbon content by 0.1%.
Thereby, there is no need to update the Neumann and Dötsch diagram on the content of Mn, S and P in gray cast irons.
The changes in concentration of Si (Table 2), equivalent to the change in activity, are so negligible
![]()
that there is also no need to take them into account, as this effect is equivalent to a change in equilibrium temperature by just 5°C.
Alloying elements can have a substantial impact on the crucible reaction: a significant amount of Cr inhibits the crucible reaction; the reaction is accelerated by significant amounts of Ni, Cu, and especially Al (Table 1 and 2).
Figure 4 shows a nomogram designed for real conditions of melting, allowing precise measurement of the melting mode.
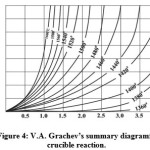 |
Figure 4: V.A. Grachev’s summary diagram for crucible reaction |
Discussion
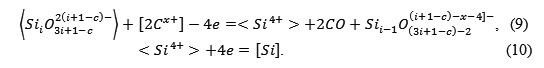
The research of the crucible reaction’s mechanism was performed on SiO2 samples, which were sintered with boric acid and loaded into the molten cast iron in the induction furnace. By passing electrical currents of different intensities and polarities, it was found that the crucible reaction can be accelerated. The sample is one of the electrodes, the second electrode is metal. Since the passing of the electrical current had a noticeable impact on the crucible reaction, we suggest the presence of an electrolyte between the electrodes. Therefore, the crucible reaction’s mechanism can be presented in the following way:
This mechanism should be considered very tentatively, as the structure of the highly siliceous layer is much more complex than the
![]()
ionic melt.
The boundary layer of the quartz lining is composed of polyionic complexes of various complexities with inclusions of boric compounds and various impurities. The development of the capillary and other phenomena leads to decrease in SiO2 content to 60-70%in the boundary layer. Spent mass of the induction furnace’s lining is composed of 70% SiO2, 4-8% Al2O3, 2-8% Fe2O3, 8-12% FeO, 1-2% CaO, 0.8-1.6% MgO, 0.4-1.5% B2O3, and 4-8% MnO.
According to Zolotov [8], spent lining is composed of 65.64% SiO2, 6.72% Al2O3, 4.9% Fe2O3, 12.33% FeO, 1.39% CaO, 1.24% MgO, 0.4% B2O3, 7.02% MnO, and 0.2% TiO2.
According to the Esin – Masson theory [4, 5, 6], the silicon-oxygen anions get polymerized:
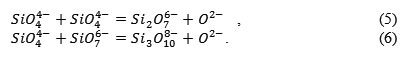
These reactions are characterized by the polymerization constant K, and in general the silicon ions can be written as
![]()
and the polymerization reaction is as follows:
![]()
The calculations given by Esin for various values of the SiO2 mole fraction in the silicate
![]()
have shown that even when , the melt contained various complex anions. According to the Esin – Masson theory, this can be explained by the occurrence of the disproportionation reaction:
![]()
Table 3 demonstrates data on the distribution of anions in molten silicates for the values of , which correspond to 65.6% SiO2.
It is reasonable to assume that in the boundary layer of the lining, which is softened and glass-like as a result of sintering, the following reaction occurs:
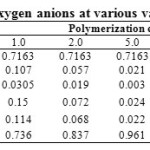 |
Table 3: Distribution of silicon-oxygen anions at various values of polymerization constant |
Contact with the Fe–Si–C–Mn melt leads to an exchange on the interface and to creation of a double electrical layer. With that, the electrode (metal) and the electrolyte permeate each other, and the anode and cathode stages of the process do not localize on any specific surfaces.
The established electrochemical nature of the crucible reaction gives hope that it is possible to determine the value of protection potential, which is able to inhibit the cathode stage without intensification of the anode stage.
Assuming that the crucible reaction is composed of electrochemical actions on the cathode and anode, a study of this reaction’s electrochemical stages was made, implementing the standard potentiodynamic method at thepotentiostat P-5848, with the reference electrode placed in the boundary layer of the lining. The scheme of this cell is shown in Figure 5. The obtained potentiodynamic curves are shown in Figure 6. During Fe – 3%C melting, the potentiodynamic curve clearly shows two horizontal sectionscorresponding to the limiting currents of the electrode processes:
![]()
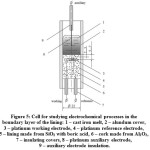 |
Figure 5: Cell for studying electrochemical processes in the boundary layer of the lining: 1 – cast iron melt, 2 – alundum cover, 3 – platinum working electrode, 4 – platinum reference electrode, 5 – lining made from SiO2 with boric acid, 6 – cork made from Al2O3, 7 – insulating covers, 8 – platinum auxiliary electrode, 9 – auxiliary electrode insulation. |
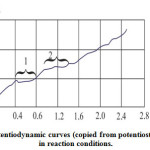 |
Figure 6: Potentiodynamic curves (copied from potentiostat diagrams) in reaction conditions |
It has been established that voltage of 800 mV is able to inhibit the first stage. The curve that corresponds to the highly siliceous melt (Figure 6) displays certain fluctuations (apparently, caused by impurities) in the area close to the current-zero, which indicates that the reaction is not occurring.
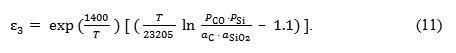
Experimental data has allowed to calculate the empirical values of activation energy and to obtain the expression for determining the protection potential:
The testing to determine the possibility of protecting the lining from the crucible reaction was carried out in a high-frequency induction furnace. The furnace was simultaneously lined with two alundum crucibles, in one of which the inside lining had a protection voltage. The melt in the crucibles had the same composition. The progress of the reaction was judged by the silicon content in the samples selected at regular time intervals. It has been established, that in the crucible that had noprotection voltage, silicon content increased and carbon content decreased faster than in the crucible that had protection voltage. This confirms the influence of electrical current on the process.
Conclusion
The author has clarified the effect of Mn, S, P, elementsusually present in cast iron, and of main alloying elements Cr, Ni, Al, Cuon the C and Si activity and equilibrium concentrations in cast iron. The corrections of the equilibrium values of C and Si have been calculated. It has been shown that alloying elements had a substantial impact on the crucible reaction: a significant amount of Cr inhibited the crucible reaction; the reaction was accelerated by significant amounts of Ni, Cu, and especially Al. It has been found that the crucible reaction could be accelerated by passing electrical currents of different intensities and polarities. The author demonstrated the possibility to determine the value of protection potential, able to inhibit the cathode stage without intensification of the anode stage:in the crucible that had no protection voltage, silicon content increased and carbon content decreased faster than in the crucible that had protection voltage.
References
- Dibrov, I. A. Development of the foundry engineering in Russia. LiteishchikRossii, 2015, 8, 1-48
- Dibrov, I. A. State and prospects of the Russian foundry production. UNIDO in Russia, Special issue,2014. Retrieved from http://www.unido-russia.ru/archive/special_02/special_02_art6/.
- Elliott, J. F. The Chemistry of Electric Furnace Steelmaking. In Electric Furnace Proceedings. New York: American Institute of Mining, Metallurgical, and Petroleum Enginers, 1974,. 62-74.
- Esin, O. A. On the calculation of the components’ activities of molten silicates. In Proceedings of the Ural Polytechnic Institute (Vol. 2). Sverdlovsk: Ural Polytechnic Institute, 1974,. 2-11
- Masson, С. R.; Smith, I. B.;Whiteway, S. G. Activities and ionic distributions in liquid silicates: application of polymer theory. Canadian Journal of Chemistry, 1970, 48 (9), 1456-1464.
- Masson, С. R. An Approach to the Problem of Ionic Distribution in Liquid Silicates. Proceedings of the Royal Society of London, 1965, A 287, 201-221.
- Neumann, F.; Dötsch, E. Thermodynamics of Fe-C-Si melts with particular emphasis on the oxidation behavior of carbon and silicon. Giessereiforschung,1975,27 (1), 318-38.
- Zolotov, Yu. A. Introduction to analytical chemistry. Moscow: BINOM, Laboratoriya Znanii, 2016.

This work is licensed under a Creative Commons Attribution 4.0 International License.
![]()
A New Edition of Web of Science
Journal Impact Factor
2022: 0.5
Five Year: 0.8
Journal is Indexed in

Cabells Whitelist
![]()


