Biosynthesis of Silver Nanoparticles Using Marine Sponge
Mahta Rezazaeh Hamed, Mohammad Hadi Givianrad*and Ali Mashinchian Moradi
Department of Marine Chemistry, Science and Research Branch, Islamic Azad University, Tehran, Iran
Corresponding Author Email: givianradh@yahoo.com
DOI : http://dx.doi.org/10.13005/ojc/310413
Article Received on :
Article Accepted on :
Article Published : 02 Nov 2015
Biosynthesis of silver nanoparticles using marine sponge extract Haliclona was carried out. Marine sponges' extracts are responsible for the reduction of silver nitrate solution. Silver nanoparticles synthesized using fresh and dry marine sponge. Experimental factors including, time duration, pH, temperature were optimized. Silver nanoparticles were characterized by UV-Visible spectrophotometry. The sizes of synthesis silver nanoparticles were 27-46 nm and confirmed by scanning electron microscopy (SEM). X-ray diffraction (XRD) crystallography indicated the silver nanoparticles crystalline nature. Fourier transform infrared spectroscopy (FT-IR) was revealed the functional groups of extract of Haliclona, which are capable of reduction of silver nanoparticles. This method is a cost-effective, eco-friendly and nontoxic procedure..
KEYWORDS:Biosynthesis; Silver nanoparticles; Haliclona; SEM; XRD
Download this article as:| Copy the following to cite this article: Hamed M. R, Givianrad M. H, Moradi A. M. Biosynthesis of Silver Nanoparticles Using Marine Sponge. Orient J Chem 2015;31(4). |
| Copy the following to cite this URL: Hamed M. R, Givianrad M. H, Moradi A. M. Biosynthesis of Silver Nanoparticles Using Marine Sponge. Orient J Chem 2015;31(4). Available from: http://www.orientjchem.org/?p=12132 |
Introduction
Nanotechnology is appearing as a rapidly growing field with its application in science and technology1. Nanobiotechnology has emerged duo to mixing both of biotechnology and nanotechnology for developing biosynthetic and eco-friendly technology for synthesis of nanomaterial2. Nanoscale materials display novel properties different from their bulk counterparts3. The change in chemical, physical, optical, electronic and magnetic properties considerably depends on the particle size and shape4. The metallic nanoparticles are prepared from metal like Au, Pt, Pd, and Ag synthesized by different procedure include of physical, chemical and biological methods5. Physically and chemically mediated syntheses require high pressure, energy, temperature, high cost and harmfulness6. Use of chemical and physical procedure in the synthesis of silver nanoparticles is costly and cumbersome7. Investigators have used biological extracts for the synthesis of nanoparticles, by adopting simple protocols, involving in the process of reduction of metal ions by using biological extracts as a source of reduction either extracellulrly8. Silver or silver ions have long been known to show antimicrobial activity9. Synthesis of nanoparticles using biological entities like bacteria10, actinomycetes, yeast, fungi11 and plants12 were reported. The reduction of metal ions by combinations of biomolecules found in these extracts like enzymes/proteins, amino acids, polysaccharides, and vitamins is environmentally benign, yet chemically complex13. Silver nanoparticles have received major attention due to their unique and tunable surface Plasmon resonance (SPR)14. Silver has long been recognized as an antibacterial agent in medical and industrial process15. The antimicrobial activity of silver nanoparticles depends on the size property. The small-sized nanoparticles have large surface area to improve the antibacterial activity16.The biosynthesis of silver nanoparticles using marine sponge Haliclona extract was implemented in this investigation. Literatures revealed that synthesis of nanoparticles using marine sponges has been undiscovered, which aroused our interest .The oceans are the source of a large group of structurally unique natural products which are mainly accumulated in invertebrates like sponges, tunicates, bryozoans 17.The important component were found include amines groups, hydroxyls, phenols, carbonyl and alkyl halides18.The aim of present investigation is to develop a simple process, cost- effective and ecofriendly procedures19.
Experimental Section
Materials and Methods
Silver nitrate (AgNO3) was purchased from Merck, Germany. Deionized water was used for all experiment and buffer solution.
Collection of Samples
Haliclona is a marine sponge which was collected from the intertidal region at (Lat. 26° 33/ 41// Long. 26° 34/ 15 //) located on the Persian Gulf.
Protections Against Contaminations
Samples were washed carefully with fresh water to remove adhering debris and associated s biota then brought to the laboratory in an ice box. Marine sponges were washed with deionized water. The extract obtained was followed by Millipore filter (0.45 µm) and used at 4˚C added experiments.
Biosynthesis of Silver nanoparticles for fresh and dry sponges
Fresh sponge
For fresh marine sponge, five grams of sponge was weighted and were boiled with 50 ml of deionized water at 70˚C for 10 min. The crude extract was filtered by Millipore filter (0.45 µm) and maintained at 4˚C for further experiment
Dry sponge
The cleaned marine sponge with deionized water were freeze dried at -20°C and then crushed into powder and stored at 4°C for future use. Then the dried sponge powder Haliclona (5g) was boiled with 50 ml of deionized water at 70 ˚C for 10 min.
Biosynthesis of silver Nanoparticles
10 ml fresh and dry sponge aqueous extract was mixed with 100 AgNO3 solution 1mM in a 250 ml Erlenmeyer flask .The whole mixture was placed in to a stirrer at 70 ˚C (700rpm) for 4 hour and kept in the dark .The bio reduction of AgNO3 ions achieved within 4 hour continuous stirring. A color change to yellowish .The solution were centrifuged at 12000 rpm for 30 min in 4˚C and then the pellets were suspended in deionized water and again centrifuged at 8000 rpm for 15 min .The purified silver nanoparticles were freeze dried and stored at 4˚C for further use characterization.
The extract attained was followed by Millipore filter (0.45 µm) and used at 4˚C for additional experiments.
Characterization of silver nanoparticles
UV-Vis Analysis
The reduction of AgNO3 was showed by UV-Visible spectrophotometer in the diverse wavelength range of 350- 600 nm (T90+UV/ spectrophotometer PG Instruments Ltd). It is one of the important techniques to confirm the formation of metal nanoparticles provided surface Plasmon resonance exists for the metal. For identify silver nanoparticles at the absorption range of 400-450 nm20.
FTIR Analysis
FT-IR spectra of functional groups in sponge extract solution was recorded by using FT-IR spectrometer (Thermo-scientific ,Nicolet 8700 USA FT-IR)at a resolution of 4 cm-1 range from 400 to 4000 cm-1 in KBr pellet.
The presence of bioactive functional groups responsible in sponge extract and synthesized Ag-NPs recorded using FT-IR spectrometer (Thermo Nicolet, Nexus 870, USA FTIR) at a resolution of 4 cm-1 range from 400 to 4000 cm-1 in KBr pellet.
XRD and SEM Analysis
The crystal nature of the Ag- NPs was resolute using XRD. The patterns of silver nanoparticles were recorded using STADI MP STOE diffractometer with Cu-K 14α”> radiation (λ=1.5406 A°) at a voltage of 40 kV and a current 30 mA.
Morphology and the size of silver nanoparticles were described by using Scanning Electron Microscope (MIRA3 TESCAN).
Effect of different factors in NPs biosynthesis
For study the effect of increase time on nanoparticles synthesis, the reaction solution was incubated at 2, 4, 24 and 72 hours. To study the effect of pH, experiments were carried out by different pH (4.5, 5.5, 7.5 and 8.5) of the reaction solution. The reaction temperature was maintained at 35°C, 50°C 14, “> 70°C and 90°C. The absorbance of the resulting solution was measured by UV-Vis spectrophotometer at different wavelengths.
Result And Discussion
Synthesis of Silver Nanoparticles
Biosynthesis of silver nanoparticles was definite by using UV-Vis spectrum analysis. After 4 hours it was saw that the color solution in Erlenmeyer flask turned to yellowish brown (Fig. 1) .It confirmed the synthesis of silver nanoparticles in flask and color change was due to excitation of SPR effect and the reduction of silver ions21.
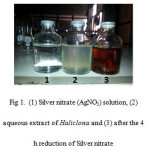 |
Figure 1: (1) Silver nitrate (AgNO3) solution, (2) aqueous extract of Haliclona and (3) after the 4 h reduction of Silver nitrate |
UV-Vis spectrum analysis of important the factor in biosynthesis of silver nanoparticles .The silver nanoparticles obtained were characterization by UV-Visible spectrophotometer at 422 nm and 425 nm for fresh and dried Haliclona in the spectrum confirmed of silver nanoparticles (Fig. 2). This is like the surface plasma vibration with characteristic peaks of silver nanoparticles.
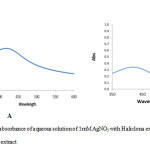 |
Figure 2: UV-Vis absorbance of aqueous solution of 1mM AgNO3 with Haliclona extract (A) fresh extract; (B) dry extract Click here to View figure |
Optimization of Different Parameters
Different parameters were optimized for synthesizing silver nanoparticles including temperature, pH, and time duration22.
Effect of temperature
The temperature is one of the most important parameters for nanoparticle synthesis. As we see in
(Fig 2.) temperature with range 35 to 90˚C.Though increasing temperature, the speed of formation of silver nanoparticle also increased rapidly. Color change in 35˚C was 72h, while color change in 90˚C was 50 min. The measure of the nanoparticle decreased initially due to the reduction in an agglomeration of the growing nanoparticles. As increasing temperature after 70˚C, the absorption pattern decreased.
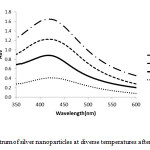 |
Figure 3: UV-Vis spectrum of silver nanoparticles at diverse temperatures after 6 h of reaction time |
Effect of pH
The pH is important effect for nanoparticles synthesis. The size of Ag-NPs are dependent on the pH of solution, the acidic pH 4.5 shows the peak week at 425 nm and absorbance band was increased while increasing pH up to 8.5 due to the excitation of surface Plasmon resonance. The alkaline (pH=8.5) absorbance peak subsequence was at 423 nm. Therefore acidic pH destroyed the nanoparticle formation. At low pH, agglomeration happened since of the over nucleation and synthesis of large NPs. At high pH, a large number of nanoparticles with the small surface area are present due to the bioavailability of functional groups in the sponge extract21. Therefore pH 8.5 was optimum for the nanoparticles formation.23 (Fig. 4).
Therefore our research showed that by increasing pH and temperature the synthesis of silver nanoparticles would be accelerated and also with raising temperature more than 90 C, accumulation of nanoparticles will take place.
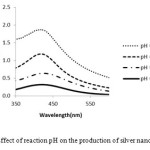 |
Figure 4: Effect of reaction pH on the production of silver nanoparticles |
Effect of time
Other factor is time duration. The time duration of reaction time, the silver nanoparticles formation was increased while increasing time reduction24. (Fig. 5).
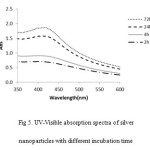 |
Figure 5: UV-Visible absorption spectra of silver nanoparticles with different incubation time |
FTIR measurements
The sponge extract and the silver nanoparticles synthesis FT-IR spectra of silver nanoparticles was recorded before and after the reduction of silver nanoparticles (Fig.6)
Figure 6a illustrations some bands in the FT-IR spectrum of Haliclona extract in the range of 3422.25 , 2922.20 , 2851.36 , 1657.63 , 1541.36 , 1467.33 , 1384.91 , 1241.27 , 1035.53 , 874. 53, 720 .49, 469 .20 cm-1. An absorption peak at 3422.25 cm-1 corresponded of phenols, alcohols with free O 14-“> H group. The peak at 1035.53 cm-1 indicated C 14-“> O bend that verification is the O 14-“> H group. A signal at 2922.20 and 2851.36 cm-1 shows to C 14-“> H stretch alkanes and O 14-“> H stretch carboxylic acids25. The peak at 1657.63 cm-1 belongs to carbonyl groups and amides. The band 1467.33 cm-1 corresponds to O 14-“> H bend indicated carboxylate26. The peak at 720.49 cm-1 was assigned for C 14-“> Cl stretching vibration of alkyl halides.
FT-IR analysis of silver nanoparticles (Fig. 6b) indicated different bands at 3416.59, 2922.32, 1649.05, 1519.86, 1384.32, 1040.13 cm-1. The band at 3416.59 cm-1 is the characteristic of the hydroxyl functional group in alcohol and phenol compounds. The peaks at 2922.32 and 1649.05 show carbonyl group and secondary amines and shows C 14-“> H stretching for alkanes. The peak at 1649.05 cm-1 indicate the group , amines and amides .The band shift in hydroxyl groups and carbonyl groups in FT-IR spectra approve the oxidation of amides, alcohols, phenol and carboxylicacides27 .
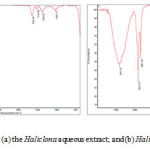 |
Figure 6: FTIR spectrum for (a) the Haliclona aqueous extract; and (b) Haliclona formed Ag-NPs Click here to View figure |
XRD
XRD illustrations the typical pattern of silver nanoparticles synthesized by the marine sponge Haliclona is crystalline with small size (Fig. 7). Almost different peaks were observed in the spectra at 2θ values of 27.66°, 32.12°, 38.35˚, 46.08°, 54.775˚, 57. 645˚, 78.63˚ reflection of both silver (Ag) and silver oxide (Ag2O). A peak at 2θ = 32.12° represents the formation of pure silver (Ag) at the start of the reaction. The formation of Ag2O may be due to the coupling reaction with alcohol (O-H) groups28.
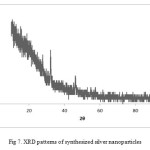 |
Figure 7: XRD patterns of synthesized silver nanoparticles |
SEM
Scanning electron microscopy has provided further insight in to morphology and size detail of silver nanoparticles. This image shows that the spherical and face centered cubic structures and particle size between 27 and 46 nm (Fig.8)29.
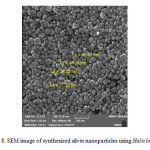 |
Figure 8: SEM image of synthesized silver nanoparticles using Haliclona Click here to View figure |
Conclusion
The present investigation is the first report which used marine sponge for the production of silver nanoparticles. The results showed that the extract of marine sponges is capable of reducing silver nanoparticles extracellularly. The formation of silver nanoparticles was observed within 4 hours at 70˚C and 50 min at 90˚. Also we studied that the fresh extract has more potential for synthesis of silver nanoparticle compared to the dried extract. This technique is simple, rapid, eco-friendly and nontoxic method without any physical or harmful chemicals.
Acknowledgments
The authors are grateful to the central investigation of fishery institute of Bandar Abbas Iran for providing the samples. Laboratory Complex of Islamic Azad University for valuable technical assistance.
References
- Najimu- Nisha, S.; Aysha, O. S.; Syed- Nasar -Rahman, J.; Vinoth -Kumar, P.; Valli, S.; Nirmala, P.; Reena, A.; Spectrochim Acta A. 2014, 124 ,194-198.
- 2. Inbakandan, D.; Kumar, C.; Stanly-Abraham, L.; Kirubagaran, R.; Colloid Surface B. 2013, 111, 636-643.
- Givianrad, M. H.; Rabani, M.; Saber-Tehrani, M.; Aberoomand-Azar, P.; Hosseini-Sabzevari, M.; J. Saudi Chem. Soc. 2013, 17, 329-335.
- Ganjavi, M.; Ezzatpanah, H.; Givianrad, M. H.; Shams, A.; Food Chem. 2010, 3, 525-528.
- Givianrad, M.H.; Hashemi, A.; Orient. J. Chem. 2014, 30, 737-743.
- Saber-Tehrani, M.; Givianrad, M. H.; Hashemi Moghaddam, H.; Talanta. 2007, 3, 987-1447.
- Aminzadeh Vahedi, T.; Givianrad, M. H.; Ramezan, Y.; Orient. J. Chem. 2015, 31, 1141-1146.
- Asmathunisha, N.; Kathiresan, K.; Colloids Surface B. 2013, 103, 283-287.
- 9. Seo, S.Y.; Lee, G. H.; Lee, S.G.; Jung, S.Y.; Lim, J. O.; Choi, J. H.; Carbohyd Polym . 2012, 90, 109-115.
- Vigneshwaranm, N.; Ashtaputre, N. M.; Varadarajan, P. V.; Nachane, R. P.; Paralikar, K. M.; Balasubramanya, R. H.; Mater Lett. 2007, 61, 1413–1418.
- Shaligram, N. S.; Blue, M.; Bhambure, R .; Singhal, R. S.; Singh, S. K.; Szakacs, G.; Pandey, A.; Proc Biochem. 2009, 44, 939-943.
- Arocki- Aarthi-Rajathi, F.; Parthiban a, C.; Ganesh Kumar b, V.; Anantharaman, P.; Spectrochim Acta A. 2012, 99, 166–173.
- Inbakandan, D.; Venkatesan, R.; Ajmal Khan, S.; Colloid Surface B. 2010, 81, 634-639.
- Kumara, P.; Govindarajua, M.; Senthamilselvib, S.; Premkumarc, K.; Colloid Surf B. 2013, 103, 658– 66.
- Vanaja, M.; Gnanajobitha, G.; Paulkumar, K.; Rajeshkumar, S.; Malarkodi, C. ; Annadurai, G.; J Nanostructure Chem. 2013, 3,17.
- Toshikazu, T.; Inorg Mat. 1999, 6, 505–511.
- Givianrad, M. H.; Sadeghi, T.; Larijani, K.; Hosseini, S. E.; J. Food Tech. Nutr. 2011, 30, 38-44.
- Govindaraju, K.; Kiruthiga, V.; Kumar, G. V.; Singaravelu, G.; J. Nanosci. Nanotechnol. 2009, 9, 5497-5501.
- Kirthi, A.V.; Abdul- Rhuman, A.; Jayaseelan, C.; Karthik, L.; Marimuthu, S.; Santhoshkumar, T.; Venkatesan, J.; Kim, S.K. ; Kumar, G. ; Sathish.K, S, R. ; Rao, K,V, B.; Mater Lett . 2012, 81, 69-72
- Kora, A. J.; Manjusha, R.; Arunachalam, J.; Mater. Sci. Eng. 2009, 29, 2104-2109.
- Mulvaney, P.; Langmuir. 1996, 12,788–800.
- Gericke, M.; Pinches, A.; Gold Bull. 2006, 39, 22–28.
- Fayaz, A. M.; Balaji, K.; Kalaichelvan, P. T.; Venkatesan, R.; Colloid Surf B. 2009, 74,123–126.
- Shanmugam, N.; Rajkamal, P.; Cholan, S.; Kannadasan, N.; Sathishkumar, K.; Viruthagiri, G.; Sundaramanickam, A.; Appl Nanosci. 2014, 4, 881–888.
- Rajeshkumar, S.; Kannan, C.; Annadurai, G.; DIT. 2012, 4511–513.
- Rastogi, L.; Arunachalam, J.; Mater Chem Phy. 2011, 129, 558–563.
- Singh, M.; Kumar, M.; Kalaivani, R.; Manikandan, S.; Kumaraguru, A. K.; Bioprocess Biosyst Eng. 2013, 36, 407–415.
- Shen, L. M.; Bao, N. Z.; Yanagisawa, K.; Nanotechnology. 2006, 17, 5117-5123.
- Kannan, R. R. R.; Stirk, W. A.; Van Staden, J.; S. Afr. J. Bot. 2013, 86, 1-4.

This work is licensed under a Creative Commons Attribution 4.0 International License.
![]()
A New Edition of Web of Science
Journal Impact Factor
2022: 0.5
Five Year: 0.8
Journal is Indexed in

Cabells Whitelist
![]()


